E ff ects of Size and Oxidation on the Nonlinear Optical Response and Optical Limiting of Graphene Oxide Sheets
Ioannis Papadakis,
⊥Aristides Bakandritsos,
⊥Akshaya Kumar Swain, Tamas Szabo, and Stelios Couris*
Cite This:J. Phys. Chem. C2020, 124, 11265−11273 Read Online
ACCESS
Metrics & More Article Recommendations*
sı Supporting InformationABSTRACT: In the present work we report on the effect of the size and the degree of oxidation on the third-order nonlinear optical response and the optical limiting action of water dispersed graphene oxide (GO) sheets, under 4 ns and 532 and 1064 nm laser excitation. The results show clearly that both the nonlinear optical (NLO) third-order susceptibility χ(3) and the optical limiting (OL) threshold depend importantly on the size of the GOs, scaling linearly with the lateral size. In addition, it was found that the similar size but highly oxidized GO samples exhibited lower NLO response than the less oxidized ones, while their OL efficiency was found to be slightly affected by the degree of oxidation, increasing with the increase of the size of the GO sheets.
The OL thresholds of the graphene oxide samples were found to be
very low, comparable to some of the benchmark optical limiting materials. The observed size dependent NLO response of the GOs seems to be closely connected to the size of the conjugated areas of the graphenic sheets. Thefindings suggest a straightforward and efficient way for preparing graphene oxide sheets exhibiting custom-made nonlinear optical properties for specific applications in optoelectronics and photonics.
■
INTRODUCTIONThe discovery of graphene1and the synthesis of its numerous different derivatives that followed, had a significant impact on several scientificfields, ranging from physics and chemistry to materials science and biology, to mention some of them. Due to their attractive physicochemical and photophysical proper- ties, graphene and its derivatives have been also applied within the scientific areas of photonics,2optoelectronics,3and lasers.4 Among the different graphene derivatives synthesized, GO is probably the most attractive graphene derivative,5 while it is characterized by facile synthesis and processing, combining important nonlinear optical response and optoelectronic features. Furthermore, GO is a key graphene derivative because it can be prepared in large amounts as a fine dispersion of single or few-layered flakes, it is particularly hydrophilic and thus readily dispersible in water, which is a very convenient solvent.6,7 The polar nature and pH- dependent surface charge of GO add to its ability to produce fine aqueous dispersions,7,8a property which renders it an even more attractive system, considering the various health and environmental safety issues often arising during the use of nanomaterials. In addition, the presence of hydroxyl, epoxy, phenolic, and carboxyl functionalities significantly expand its chemistry for further derivatization.9,10This rich chemistry of GO has been extensively exploited as a powerful tool among other things for modulating in a controllable way its NLO response.11Even though graphene dispersions exhibit stronger
NLO response and more efficient OL action than GO dispersions,12GO’s properties can be tuned effectively through the degree of oxidation.13 Such features increase the applicability of GO due to easier handling, processing, and integration in hybrid materials and devices.
Tuning the NLO response has been a subject of great importance toward specific applications based on laser light− matter interactions.2 Several approaches have been examined, as for example by varying the stacking of multiple monolayers,4 doping in graphene14 and exploiting interference phenom- ena.15Changing GO’s chemistry to control NLO properties is undoubtedly a valuable feature of this material. Nevertheless, if this could be achieved by changing the size only, it could provide a direct entryway for integration of materials with different NLO response in devices, without having to change the handling and the processing parameters, or the accompanying components (i.e., compatible supports), as for instance in the fabrication procedures of fiber lasers.4 Importantly, combined size and chemically modified/con-
Received: April 8, 2020 Revised: April 30, 2020 Published: May 4, 2020 Downloaded via UNIV OF SZEGED on September 21, 2020 at 11:07:33 (UTC). See https://pubs.acs.org/sharingguidelines for options on how to legitimately share published articles.
trolled NLO response could further boost the desired properties and widen even more the tunability window. It is noteworthy that size features drastically influence a wide range of other properties of graphene oxide lamellae. For instance, the liquid crystalline behavior of GO, the composition dependence of which is determined by the shape anisotropy of particles.16 In another example, Gonçalves et al. reported that the breakdown of GOflakes into nanoparticles resulted in the change of the edge structure which resulted in the modification of its optoelectronic properties.17Finally, the size- tunability of the aggregation behavior of GO in aqueous electrolyte solutions has also been highlighted recently.8
In the present work, we report some recent experimental results concerning the effects of the size and the degree of oxidation on the third order NLO response and the OL action of some GO sheets dispersed in water having different sizes.
Although the influence of the degree of oxidation of GOs on their NLO response has been also studied previously,13it is, to the best of our knowledge, the first time that detailed experimental evidence is presented concerning the size- dependence of these properties. Toward that goal, two different sets of samples were prepared, each set having a substantially different degree of oxidation, while each set comprised of graphene oxide samples having different lateral size. Then, their NLO properties were investigated using 4 ns and visible (532 nm) and infrared (1064 nm) laser excitation conditions, while their optical limiting efficiency was studied and assessed, and their optical limiting thresholds were determined. For both cases, the laser beam was focused into the samples using a 20 cm focal length quartz lens. The spot radii at the focus was measured using a CCD camera and was found to be 18 and 30 μm for the 532 and 1064 nm laser beams respectively (with respective Rayleigh lengths of 1.91 and 2.66 mm). It is among the motivations of the present work to extend our knowledge on the possible routes allowing to achieve efficient tuning of the nonlinear optical properties and the optical limiting efficiency of graphene oxide sheets, in order to match better specific needs of potential applications in optoelectronics, photonics, etc.
■
EXPERIMENTAL SECTIONNatural graphite powder (trace metals <100.0 ppm, purity
>99.99%, average particle size <45μm) was used as received from Sigma-Aldrich. The graphite powder was oxidized to produce graphene oxide (GO) by a modified Hummers method. To oxidize the graphite powder, the method described by Marcano et al. was followed.18GO was washed repeatedly with HCl, deionized (DI) water, and ethanol. The final wash was done using DI water. The GO suspension was thenfiltered using a nylonfilter paper with a pore size of∼0.45 μm. The smaller sized GO sheets (<0.45 μm) were thus separated from the larger sized GO sheets and collected in the filtrate. The resultingfiltrate containing GO sheets (<0.45μm) were sonicated for 2 h in a bath sonicator. The suspension was thenfiltered through a nylonfilter paper with a pore size of 0.2 μm and the GO having sizes∼220 nm was collected.19The filtrate was further rigorously sonicated using a probe sonicator for 2 h. The suspension was then centrifuged at 10k rpm for 15 min to collect GO sheets of size ∼120 nm. The remaining suspension after centrifugal separation was treated with a few drops of 1 M NaOH and sonicated using a probe sonicator for 3 h. Two different sized (∼50 and ∼80 nm) GO sheets were
then separated from the suspension by repeating the above procedure.
The surface chemical properties of the materials were determined with X-ray photoelectron spectroscopy (XPS) obtained on a PHI VersaProbe II (Physical Electronics) spectrometer using an Al Kα source (15 kV, 50 W).
Dynamic light scattering (DLS) was performed on aqueous dispersions of ∼0.1 mg/mL on a Malvern ZetaSizer Nano instrument. Scattered light was collected at a fixed angle of 173°. The reported hydrodynamic diameters (Dh) are the mean of three measurements, and each measurement was the sum of 12 correlograms and fitting procedures. Cumulants analysis was applied, and the reported average Dh values are z- average means.
Raman spectra were recorded on a DXR Raman microscope using the 532 nm excitation line of a diode laser.
The third-order nonlinear optical response of the prepared graphene oxides was investigated by means of the Z-scan technique,20 a very popular and powerful technique since, besides its experimental simplicity being a single beam technique, it allows the simultaneous determination of the sign and magnitude of the nonlinear absorption and refraction of a sample, all from a single measurement. The nonlinear absorption and refraction of a sample are usually expressed in terms of the nonlinear absorption coefficient (β) and the nonlinear refractive index parameter (γ′), which are related to the imaginary (Imχ(3)) and real (Reχ(3)) parts of the third- order susceptibilityχ(3), respectively.
In more detail, according to the standard Z-scan experimental procedures, the nonlinear absorption coefficient, β, and the nonlinear refractive index parameter, γ′, are determined from the measurement of the sample trans- mittance, as it moves along the propagation direction of a focused Gaussian laser beam, thus experiencing variable intensity. The sample transmittance is measured in two different ways: (i) by collecting the transmitted laser beam just after the sample and (ii) by measuring the transmitted laser beam after it has passed through a small aperture placed in the far field. The former measurement is the so-called
“open-aperture”(OA) Z-scan while the latter one is known as
“closed-aperture” (CA) Z-scan. From the former Z-scan, the sign and the magnitude of the nonlinear absorption coefficient βof the sample can be determined by fitting the OA Z−scan with the following equation:
∫
π β
=
+ + −
β +
−∞
Ä +∞
ÇÅÅÅÅÅ ÅÅ
É ÖÑÑÑÑÑ ÑÑ
Ä ÇÅÅÅÅÅ ÅÅÅÅÅ É ÖÑÑÑÑÑ ÑÑÑÑÑ T
I L
z z t t
1 ln 1
(1 / )exp( ) d
I L z z
(1 / )
0 eff 2
0 2
2
0 eff 2
0 2
(1) whereTis the normalized transmittance,I0is the peak on-axis irradiance of the laser beam at the focus, z0 is the Rayleigh length, andLeff= [1−exp(−α0L)]/α0, withα0being the linear absorption coefficient at the laser wavelength andLdenoting the thickness of the glass cell (i.e., 1 mm here).
The presence of a minimum/maximum at the OA Z-scan indicates the sign of the nonlinear absorption coefficient β, corresponding to reverse saturable (RSA,β> 0) or saturable absorption (SA,β< 0), respectively.
From the CA Z-scan, the nonlinear refractive index parameter γ′ of the sample can be obtained. A CA Z-scan
exhibits a prefocal transmittance minimum (valley) followed by a postfocal maximum (peak) or a prefocal maximum (peak) followed by a postfocal minimum (valley), indicating positive or negative γ′ (i.e., Reχ(3)), with the sample behaving as positive (focusing) or negative (defocusing) lens respectively when it experiences high enough intensity, i.e., around the
focal plane. In the absence of significant nonlinear absorption, the nonlinear refractive parameterγ′can be obtained directly from the CA Z-scan using the following equation:
γ λα
′ = π
−
Δ
− −
T−
I S
1 e a L 0.812 (1 )
0 p v
0 0.25
0 (2)
Figure 1.(a) Survey XPS spectra of the low oxidation degree samples: (i) GO250, (ii) GO280, (iii) GO2120, and (iv) GO2220, along with (b) the elemental analysis as obtained from HR-XPS (numbers denote atomic % contents). The spectra ii, iii, and iv in panel a are horizontally shifted for clarity. All carbon signals were centered at 284.8 eV, as in spectrum (i).
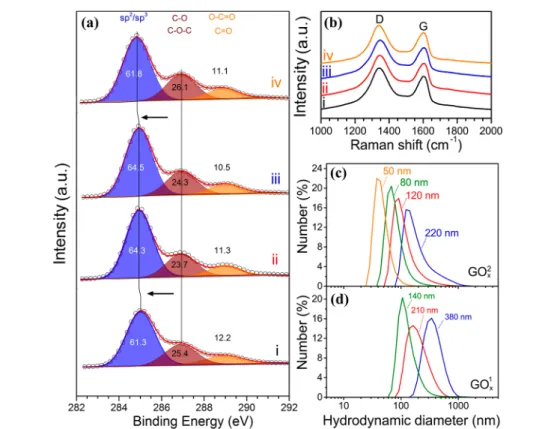
Figure 2. (a) C 1s core level HR-XPS and (b) Raman spectra of the (i) GO250, (ii) GO280, (iii) GO2120, and (iv) GO2220 samples. The deconvolution of the C 1s HR-XPS spectra suggest the almost identical composition, with similar content of sp2/sp3carbons (284−285.6 eV) and carbons bonded to oxygen groups (epoxides, hydroxyls, ethers: 285.6−287.7 eV and carbonyls, carboxyls: 288.2−289.7 eV). TheID/IGintensity ratios are (i) 1.24, (ii) 1.24, (iii) 1.25, and (iv) 1.22. (c and d) Apparent mean hydrodynamic diameters of the GO2xand GO1xsample sets as aqueous dispersions.
whereλis the laser wavelength,ΔΤp‑vis the difference between the peak and the valley of the normalized transmittance, Sis the linear transmittance of the aperture (defined as S = 1− exp(−2ra2/wa2), withrabeing the radius of the aperture andwa being the beam radius at the aperture). The quantitiesα0,I0, andLare as previously defined.
However, when absorption cannot be neglected, the nonlinear refractive index parameter γ′ is deduced from the
“divided”Z-scan, resulting from the division of the OA and CA Z-scans.
From the determined nonlinear absorption coefficientβand the nonlinear refractive index parameterγ′the imaginary part (Imχ(3)) and real part (Reχ(3)) of the third-order nonlinear susceptibility, χ(3), can be calculated through the following relations:
χ = − π γ′
Re cn
(esu) 10
480 (cm /W)
(3) 6 02
2 2
(3) and
χ = − π ωβ
Im c n
(esu) 10
96 (cm/W)
(3) 7
2 0
2
2 (4)
whereω (in s−1) is the frequency of the laser light.
Then, the magnitude ofχ(3)can be easily calculated:
χ(3) = (Reχ(3) 2) +(Imχ(3) 2) . (5)
■
RESULTS AND DISCUSSIONTwo sets of GO samples having different degree of oxidation and different lateral sizes were prepared and studied, referred in the next as GOyx, where y = 1, 2 denotes the set and x denotes the apparent lateral size of the GO sheet (in nanometers). Thefirst set of samples comprised three highly oxidized GOs, named as GO1140, GO1210, and GO1380, while the second set comprised four, less oxidized samples, named as GO250, GO280, GO2120, and GO2220. The higher degree of oxidation of the GO1xset was evidenced by the presence of multiple absorption bands below 400 nm in the corresponding UV−vis-NIR absorption spectra, as can be seen in Figures S1, S2 in the Supporting Information. More specifically a band centered at about 300 nm, originating from the attachment of carbonyl groups on the graphenic sheets,21−23 is observable only for the case of the GO1xset, denoting its higher degree of oxidation. The corresponding absorption spectra of the GO2x samples were lacking this feature, indicating their lower oxidation degree.13,24 The oxidation degree of the samples was also confirmed by means of high-resolution X-ray photoelectron spectroscopy (HR-XPS) which can reveal more precisely, among other things, the oxygen and sp2
carbon contents. It should be noted, that very similar to the present GO1x samples, but more highly oxidized, were also prepared and analyzed in ref13. Here, as an example,Figures 1 and2a present the HR-XPS spectra of the GO2xsamples set.
The comparison of such HR-XPS measurements confirmed the markedly lower oxygen content and higher sp2carbon bonding of the GO2x samples in comparison to the GO1x ones. The practically identical chemical structures of all GO2x samples was clearly confirmed by XPS (Figure 1 and Figure 2a) and Raman spectroscopy (Figure 2b). Nevertheless, as can be seen from Figure 2a, the sp2/sp3 component of the larger sized GO2x appeared at lower binding energies, suggesting a more extended conjugation. The latter is related to the increase of the density of states at the Fermi level (i.e., the decrease of the band gap), shifting the binding energies to lower values.25The decrease of the band gap was also reflected by the slight blue shift of the UV−vis−NIR spectra and the Tauc plots, as will be discussed later.26,27The size increase of the conjugated areas can be correlated to the significant increase of the lateral size of the flakes, the latter supported by dynamic light scattering (DLS) measurements shown in Figure 2c,d. It should be emphasized here that the DLS results, expressed as hydro- dynamic diameters, do not represent an absolute size of the flakes in the suspension, but the equivalent size of a sphere corresponding to the average diffusion coefficient, which is the measured quantity by DLS. Nevertheless, the results reflect the magnitude of the size variations of theflakes in the different GO samples.
The values of the determined NLO parameters of the studied GO samples, under 4 ns ansd 532 nm laser excitation, are summarized inTable 1. Their NLO response, under 1064 nm excitation, was found to be negligible. As can be seen, all GOs exhibited reverse saturable absorption (RSA) correspond- ing to positive NLO absorption coefficientβ(i.e.,Imχ(3)> 0) and negative sign NLO refractive index parameter γ′ (i.e., Reχ(3) < 0) suggesting self-defocusing behavior. Concerning the nonlinear absorption of the present GO samples, as it was previously reported,13,24highly oxidized GOs (e.g., GOs with O/C ratio higher than 0.5) were found exhibiting saturable absorption (SA) behavior at low enough incident laser intensities, which, however, was changed to RSA at higher laser intensities, due to the saturation of the SA response. In general, it was observed that the highly oxidized samples (i.e., those having O/C ratio higher than 0.85) exhibited more pronounced SA behavior easily observed experimentally, while lower oxidation GOs exhibited weaker or even insignificant SA behavior. In the present study, the SA behavior was not observable even at the lowest laser intensities used (i.e.,∼1.5 MW/cm2), since both GO samples sets had an O/C ratio lower than 0.5. In fact, as can be seen fromFigure 1b, the GO2x Table 1. NLO Parameters of the GOyxSamples under 4 ns and 532 nm Laser Excitationa
GOyxsamplesb β(×10−11m/W) γ′(×10−18m2/W) n2c(×10−12esu) |χ(3)|(×10−13esu)
GO1140 89.5±10.5 −47.4±10.5 162.6±36.0 68.0±10.0
GO1210 183.0±21.0 −62.5±4.2 214.4±14.4 108.0±8.0
GO1380 250.0±8.0 −91.7±8.0 314.5±27.4 158.0±8.0
GO250 33.8±6.3 −71.0±15.0 243.5±51.4 81±18
GO280 43.0±5.0 −82.5±8.8 283.0±30.2 95±9
GO2120 100±20 −150±30 514.5±102.9 200±40
GO2220 213±24 −263±29 902.09±99.5 310±35
aAll values refer to a concentration of 1 mg/mL.by= 1: highly oxidized samples,y= 2: lower oxidized samples;x: mean lateral length.cn2was calculated using the relation:n2(esu) = (cn0/40π)γ′(m2/W).
samples had an O/C ratio of about 0.25. The more oxidized GO1xsamples had an O/C ratio of about 0.35. In any case, it should be clear that both sets of samples studied here exhibited O/C ratios significantly lower than that of the highly oxidized GO samples of ref13.
As can be seen in Table 1, the determined values of the NLO parameters were found to increase with the lateral dimension of the GO sheet, thus leading to a similar increase of the third order nonlinear susceptibilityχ(3), which was found to scale linearly with the lateral size of the graphenic sheet, as shown in the plots ofFigure 3.
In addition to the above, the NLO responses of the different degree of oxidation GO samples, having however similar lateral dimensions, were found to be significantly different. So, for example, the less oxidized GO2220sample was found exhibiting three times higher third order nonlinear susceptibility χ(3) compared to the more oxidized GO1210 sample, both having similar sizes. A similar situation was found to hold for the other samples as well, confirming the effect of the different oxidation degree on the NLO response.
Similar conclusions were reached recently in a previous study,13where it was also found that the degree of oxidation has great impact on the NLO response of graphene oxide samples. However, in that study, the studied GO samples were highly oxidized and such samples did not exhibit any sizable
NLO refraction, following the general trend we have observed that very oxidized graphene samples present insignificant NLO refraction and possess only NLO absorption. In the present work, since the prepared GO samples are significantly less oxidized than those of ref13(supported also by the results of the XPS measurements, which, for instance, for the GO2x samples show an O/C ratio of about 0.25), they were expected to present NLO refraction, a situation which was clearly confirmed experimentally here, as all studied samples exhibited sizable NLO refraction (see also Table 1). This is nicely depicted in Figure 4a,b, where the OA and CA Z-scans of GO280and highly oxidized GO*(taken from ref13) obtained under similar experimental conditions, are presented. As can be seen from the OA Z-scan of the highly oxidized GO*, a slight increase of the normalized transmittance is observed on either side of the focal plane, followed by a large dip. This is due to the saturation of the SA behavior, occurring at lower intensities, which then switches to RSA behavior at higher intensities, as was discussed previously. On the other hand, this phenomenon is absent in the case of GO280, since its O/C ratio is much lower and therefore SA behavior is not occurring.
Regarding the NLO refraction of the two GOs, as can be seen in Figure 4b, GO280 exhibits strong self-defocusing, whereas the CA Z-scan of the highly oxidized GO is ratherflat, as this last one exhibits negligible NLO refraction. In full agreement with the above big picture, when comparing the two presently investigated sets of GOs, it is evident that the less oxidized GOs (i.e., those of the second set, GO2x) exhibit far stronger NLO refraction than the similar sized more oxidized GOs (i.e., those of the first set, GO1x); that is, the GO2230 sample exhibited more than a 4-fold increase of its NLO refractive index parameter γ′ than that of the more oxidized but of similar size, GO1210 sample.
Regarding the strength of the observed NLO absorption observed here, compared to that of the GOs of refs13and24, it can be easily quantified through the value of the nonlinear absorption coefficientβ. As can be seen fromTable 1, theβof the GOyxs was found to range from 33.8×10⁻¹¹up to 250× 10−11m/W. For the case of the fully oxidized GOs of ref24, their mean hydrodynamic diameter was found to be 520±100 nm and their βwas determined to be ∼110 ×10−11m/W.
However, the fully oxidized GO of ref13possessed aβvalue of
∼50 × 10−11 m/W, which indicates that its mean hydro- dynamic diameter should be quite smaller, possibly around 260 Figure 3.Dependence of third-order nonlinear susceptibilityχ(3)with
the lateral size of the GOyxsheets.
Figure 4.(a) OA Z-scans and (b) CA Z-scans of GO280and GO*. The GO*Z-scans are unpublished results of the investigated GOs of ref13.
nm. The GO2220 sample, which has a comparable size to the GO of ref13and is smaller by a factor of 2 than that of ref24, exhibited much stronger NLO absorption (β value of 213× 10−11m/W) than both GOs, which is expected, given its much lower degree of oxidation. This comparison shows that the degree of oxidation can be efficiently used for modifying the NLO absorption of graphene oxides.
It should be also added here that there is another interesting difference between the present GOyxs and those of refs13and 24, which is the lack of NLO response under 1064 nm excitation. In more detail, it was found that the GOs of refs13 and 24 presented weak but nonetheless measurable NLO response under infrared excitation. However, their concen- trations were as high as 1.3 mg/mL, whereas the concentration of the present GOyxs was 0.1−0.2 mg/mL. Thus, even though the intensities used in the present study (∼250 MW/cm2) were quite a bit higher than those of refs13and24, the NLO response of the GOyxs was found to be negligible under 1064 nm excitation, most probably because of the lower concentration used.
Another interesting observation concerns the modulation of the relative strengths of the NLO absorption and NLO refraction parameters. In fact, it becomes evident from the inspection of the values of the NLO parameters presented in Table 1that the ratio β/γ′ is much larger in the case of the highly oxidized graphene oxide samples, i.e., the GO1x set, whereas the opposite trend was observed for the less oxidized GO2x samples set. This finding suggests how efficiently the oxidation degree can change the NLO properties of the graphene oxide sheet, allowing not only for the switching between RSA and SA behavior13,24but modulating largely the relative strength of the NLO absorption and refraction in view of specific applications.
As discussed previously, both the Raman and the XPS measurements of the graphene oxide samples suggest the absence of significant composition differences among the samples belonging to the same set, all of them having very similar oxidation degree. Therefore, the increase of the third- order nonlinear susceptibility χ(3) with the lateral size of the GO sheets cannot be explained in terms of composition differences but should be rather correlated to some other size- dependent effects.
Among the most common size-dependent optical phenom- ena, is the nonlinear scattering. In fact, submicrometer size entities and nanostructures (as, e.g., carbon nanotubes) are known to exhibit important nonlinear scattering.28So, in order to examine if such contributions are occurring here, scattering measurements of the GOyxdispersions were performed, under identical laser excitation conditions to those employed for the Z-scan experiments.
Briefly, the scattered light was detected by a sensitive fast photodiode placed behind the sample, at different angles with respect to the incident laser beam propagation axis, confirming the lack of any significant scattering. Therefore, the observed increase of the third-order nonlinear susceptibilityχ(3) of the GOyx samples with the lateral size, should be entirely correlated to some other size dependent property. Here, it is important to be reminded that the increase of the lateral size can result in an increased length of the conjugated rings, as suggested by the shift of the sp2/sp3component in the C 1s envelope in the HR-XPS results and as it expected on geometric grounds and is schematically depicted inFigure 5.
The bottom line is that the change of the length of the
conjugated rings leads to the modification of the GO’s band gap.26,27Therefore, taking into account that the band gap of graphenes determines greatly their electronic and optical properties23 and also that that the decrease of the band gap results in a significant enhancement of the NLO response,13,29 this tentative explanation could be a reasonable explanation of the experimentally observed size dependence of the NLO response of the GOyx.
In order to provide some more insight into and confirmation of the modification of the band gap of the studied GO samples, the corresponding Tauc plots (Figures S3 and S4) were constructed, which offer some experimental evidence on the modification of the band gap of the GO samples with the lateral size. In fact, the Tauc plots results revealed that the increase of the size of the GO sheet was followed by an increase of the band gap, in agreement with the increasing of the size of the conjugated areas.26Therefore, based on these experimental evidence, it can be assumed that the extent ofπ- conjugation, as quantified by the amount of sp2 species arranged in nanodomains, plays a crucial role concerning the NLO response of the GO sheets.
Comparing the NLO response of samples having similar oxidation degree (i.e., same set of samples), it becomes also evident that smaller sized GOs (i.e., having wider band gap) exhibited lower NLO response. On the other hand, the more oxidized GOs exhibited lower NLO response, as it results from the comparison between the more oxidized GO1140and GO1210 samples with the less oxidized, but similar sizes, GO2120 and GO2220. It is interesting to mention that the oxidation effect seems to affect mostly the NLO refractive response, leaving the NLO absorptive response rather unaffected.
As it has been reported previously, all GO samples of the present study exhibited strong RSA behavior, under 532 nm laser excitation, as denoted by the large values of the NLO absorption coefficient β that have been determined and are presented in Table 1. The observed RSA response can be understood in terms of two photon or excited state absorption processes which exhibit favorable absorption cross-section, for instance larger than that of the ground state and a large enough lifetime.30,31A direct consequence of the strong RSA behavior that has been observed in all of the GOyx samples is their remarkable optical limiting action, under 532 nm laser excitation, which was confirmed experimentally in the present work as well. All GOs were found to exhibit very important optical limiting behavior, under visible excitation, which was also influenced by the size of the graphenic sheets. To facilitate Figure 5.Size reduction of the conjugated areas as a GO sheet is cut into smaller fragments is a direct geometrical consequence.
the comparison between the different size GO samples, dispersions of similar transmittance, i.e., around 90%, were prepared, the lowest transmittance being 87% and the highest at about 94%. Despite the high transmittances of the GOs dispersions, they were found to exhibit low onset of the optical limiting threshold (OLtrh), the OLthrbeing defined as the value of the inputfluence at which the sample transmittance starts to deviate from its linear transmittance corresponding to the Beer−Lambert law, ranging between 0.375 and 0.8 J/cm2.
In Figure 6a,b, the dependence of the OLtrhon the size of the GO sheets is presented. As can be seen, the OL onset exhibits a linear decrease with the size increase for both sets of GOs. As a general remark, the best OL action was found for the GO1380sample which had an OLthrof about 0.375 J/cm2. It should be emphasized here that, while the OLthrwas found to be strongly size dependent, it appears not being noticeably affected by the degree of oxidation of the samples. So, while the increase of the size of the GOs leads to lower OLthr, similar sized GOs, as for instance the GO2220and the GO1210samples, or the GO2120 and the GO1140 ones, were found to exhibit about the same onset of the optical limiting activity. This last, however, must be expected since the nonlinear absorption coefficient β was only slightly changed with the degree of oxidation as well, while it was strongly dependent on the size of the graphenic sheet.
Comparing the OL action of the present GOs with some other carbon nanomaterials widely known for their optical limiting performance, as, e.g., some graphene nanosheets (GNSs), C60, etc., shows that the GOyxsamples exhibit at least similar if not better OL efficiency. In particular, the GNSs and the C60 are reported to exhibit OLthr of 0.5 and 0.1 J/cm2, respectively,23,32 while the present GO1380 and the GO2220 graphene oxide samples were found to exhibit OLthrof 0.375 and 0.520 J/cm2, respectively. However, it should be considered that the GO dispersions had linear transmittance of about 90%, while the GNSs and C60dispersions had linear transmittances of about 70% and 50%, respectively, thus much lower than that of GOs dispersions. In another study, the optical limiting action of some CdS nanoparticles was investigated.33 It was found that these CdS nanoparticles exhibited quite low OLthr, comparable to that of the investigated GOs here. However, as for the case of GNSs and C60, the CdS dispersions had a linear transmittance of about 75%, thus again concluding that the GOs are much more efficient optical limiters. Another very recent study investigat-
ing the optical limiting action of some Au nanocages and nanoparticles has reported OLtrh of 1.12 and 1.98 J/cm2, respectively,34still quite higher than that of the present GOs.
From these comparisons, with some of the more recent experimental results, it seems that the GOs of the present study exhibit efficient optical limiting action, similar if not much better than some of the reference materials commented above, some of them being considered as benchmark optical limiting materials (as e.g., C60).
■
CONCLUSIONSIn conclusion, the present study showed that the nonlinear optical properties of graphene oxide can be largely tuned by modifying the degree of oxidation and the size of the graphenic sheets as well. The controlled variation of these two parameters was shown to allow for the efficient modulation of the nonlinear absorption and refraction of the GOs, which were both found to increase, following the increase of the GOs’ lateral size. Moreover, the modification of the degree of oxidation was found to alter profoundly the nonlinear absorptive response of GO, as this last can be switched from SA to RSA behavior. So, the less oxidized graphenic sheets exhibit strong RSA behavior, which is of interest for optical limiting applications. Very interestingly, the onset of the optical limiting action, OLthr, of the studied GOs was also found to be efficiently modulated by varying the size and the degree of oxidation of the samples, attaining very low values, comparable if not better than that of some of the benchmark materials for optical limiting applications, making GO a modular platform for optical limiting applications.
■
ASSOCIATED CONTENT*sı Supporting Information
The Supporting Information is available free of charge at https://pubs.acs.org/doi/10.1021/acs.jpcc.0c03134.
UV−vis−NIR spectra of the studied GOs Tauc plots of the studied GOs (PDF)
■
AUTHOR INFORMATION Corresponding AuthorStelios Couris−Department of Physics, University of Patras, 26504 Patras, Greece; Institute of Chemical Engineering Sciences (ICE-HT), Foundation for Research and Technology- Hellas (FORTH), Patras 26504, Greece; orcid.org/0000- Figure 6.Dependence of the optical limiting onset (OLthr) on the lateral size of (a) GO1xand (b) GO2x.
0002-8495-7082; Email:couris@iceht.forth.gr,couris@
upatras.gr
Authors
Ioannis Papadakis−Department of Physics, University of Patras, 26504 Patras, Greece; Institute of Chemical Engineering Sciences (ICE-HT), Foundation for Research and Technology- Hellas (FORTH), Patras 26504, Greece
Aristides Bakandritsos−Regional Centre of Advanced Technologies and Materials, Faculty of Science, Palacky University in Olomouc, 779 00 Olomouc, Czech Republic Akshaya Kumar Swain−Regional Centre of Advanced
Technologies and Materials, Faculty of Science, Palacky University in Olomouc, 779 00 Olomouc, Czech Republic Tamas Szabo− Department of Physical Chemistry and
Materials Science, University of Szeged, 6720 Szeged, Hungary;
orcid.org/0000-0001-8182-640X Complete contact information is available at:
https://pubs.acs.org/10.1021/acs.jpcc.0c03134 Author Contributions
⊥I.P. and A.B. contributed equally.
Author Contributions
I.P. performed the NLO experiments and analyzed the data, measured the UV−vis−NIR absorption spectra, prepared the Tauc plots, and contributed in the interpretation of the results and the writing of the manuscript. A.B. contributed in the synthesis of the GO samples, their XPS and DLS character- ization, in the analysis and interpretation of the results, and contributed in the writing of the manuscript. A.K.S.
contributed in the synthesis of the GO samples and in the DLS measurements. T.S. synthesized the highly oxidized GO samples and commented on the manuscript. S.C. conceived and conceptualized this research, planned and supervised the work, and contributed in the interpretation of the results and in the writing of the manuscript. All authors have given approval to thefinal version of the manuscript.
Notes
The authors declare no competingfinancial interest.
■
ACKNOWLEDGMENTSI.P. and S.C. acknowledge partial support by the project
“HELLAS-CH”in the frame of“Cooperation ELI-LASERLAB Europe, HiPER & IPERION−CH.gr”(MIS 5002735), which is implemented under the “Action for the Strategic Develop- ment on the Research and Technological Sector”, funded by the Operational Programme“Competitiveness, Entrepreneur- ship and Innovation” (NSRF 2014-2020) and cofinanced by Greece and the European Union (European Regional Development Fund). A.B. and A.K.S. acknowledge support from the Ministry of Education, Youth and Sports of the Czech Republic (Projects CZ.1.05/2.1.00/19.0377 and CZ.02.1.01/
0.0/0.0/16_019/0000754). Martin Petr is acknowledged for the XPS and Dr. Zuzana Chaloupkova for Raman measure- ments. This research was also supported by Project No.
126498, provided by the National Research, Development and Innovation Fund of Hungary,financed under the KH funding scheme. T.S. also acknowledges the support by the János Bolyai Research Scholarship of the Hungarian Academy of Sciences.
■
(1) Novoselov, K. S.; Geim, A. K.; Morozov, S. V.; Jiang, D.; Zhang,REFERENCES Y.; Dubonos, S. V.; Grigorieva, I. V.; Firsov, A. A. Electric Field Effect in Atomically Thin Carbon Films.Science2004,306, 666−669.(2) Sun, Z.; Martinez, A.; Wang, F. Optical Modulators with 2D Layered Materials.Nat. Photonics2016,10, 227−238.
(3) Leuthold, J.; Koos, C.; Freude, W. Nonlinear Silicon Photonics.
Nat. Photonics2010,4, 535−544.
(4) Martinez, A.; Sun, Z. Nanotube and Graphene Saturable Absorbers for Fibre Lasers.Nat. Photonics2013,7, 842−845.
(5) Chen, D.; Feng, H.; Li, J. Graphene Oxide: Preparation, Functionalization, and Electrochemical Applications. Chem. Rev.
2012,112, 6027−6053.
(6) Li, D.; Müller, M. B.; Gilje, S.; Kaner, R. B.; Wallace, G. G.
Processable Aqueous Dispersions of Graphene Nanosheets. Nat.
Nanotechnol.2008,3, 101−105.
(7) Szabo, T.; Tomba cz, E.; Illes, E.; Dekany, I. Enhanced Acidity and pH-Dependent Surface Charge Characterization of Successively Oxidized Graphite Oxides.Carbon2006,44, 537−545.
(8) Szabo, T.; Maroni, P.; Szilagyi, I. Size-Dependent Aggregation of Graphene Oxide.Carbon2020,160, 145−155.
(9) Eigler, S.; Hirsch, A. Chemistry with Graphene and Graphene OxideChallenges for Synthetic Chemists. Angew. Chem., Int. Ed.
2014,53, 7720−7738.
(10) Georgakilas, V.; Tiwari, J. N.; Kemp, K. C.; Perman, J. A.;
Bourlinos, A. B.; Kim, K. S.; Zboril, R. Noncovalent Functionalization of Graphene and Graphene Oxide for Energy Materials, Biosensing, Catalytic, and Biomedical Applications.Chem. Rev.2016,116, 5464− 5519.
(11) Jiang, X.-F.; Polavarapu, L.; Neo, S. T.; Venkatesan, T.; Xu, Q.- H. Graphene Oxides as Tunable Broadband Nonlinear Optical Materials for Femtosecond Laser Pulses.J. Phys. Chem. Lett.2012,3, 785−790.
(12) Feng, M.; Zhan, H.; Chen, Y. Nonlinear Optical and Optical Limiting Properties of Graphene Families.Appl. Phys. Lett.2010,96, 033107.
(13) Liaros, N.; Tucek, J.; Dimos, K.; Bakandritsos, A.;
Andrikopoulos, K. S.; Gournis, D.; Zboril, R.; Couris, S. The Effect of the Degree of Oxidation on Broadband Nonlinear Absorption and Ferromagnetic Ordering in Graphene Oxide. Nanoscale 2016, 8, 2908−2917.
(14) Lee, C.-C.; Miller, J. M.; Schibli, T. R. Doping-Induced Changes in the Saturable Absorption of Monolayer Graphene.Appl.
Phys. B: Lasers Opt.2012,108, 129−135.
(15) Zaugg, C. A.; Sun, Z.; Wittwer, V. J.; Popa, D.; Milana, S.;
Kulmala, T. S.; Sundaram, R. S.; Mangold, M.; Sieber, O. D.; Golling, M.; et al. Ultrafast and Widely Tuneable Vertical-External-Cavity Surface-Emitting Laser, Mode-Locked by a Graphene-Integrated Distributed Bragg Reflector.Opt. Express2013,21, 31548−31559.
(16) Kim, J. E.; Han, T. H.; Lee, S. H.; Kim, J. Y.; Ahn, C. W.; Yun, J. M.; Kim, S. O. Graphene Oxide Liquid Crystals.Angew. Chem., Int.
Ed.2011,50, 3043−3047.
(17) Goncalves, G.; Vila, M.; Bdikin, I.; de Andres, A.; Emami, N.;
Ferreira, R. A. S.; Carlos, L. D.; Gracio, J.; Marques, P. Breakdown into Nanoscale of Graphene Oxide: Confined Hot Spot Atomic Reduction and Fragmentation.Sci. Rep.2015,4, 6735.
(18) Marcano, D. C.; Kosynkin, D. V.; Berlin, J. M.; Sinitskii, A.;
Sun, Z.; Slesarev, A.; Alemany, L. B.; Lu, W.; Tour, J. M. Improved Synthesis of Graphene Oxide.ACS Nano2010,4, 4806−4814.
(19) Swain, A. K.; Li, D.; Bahadur, D. UV-Assisted Production of Ferromagnetic Graphitic Quantum Dots from Graphite.Carbon2013, 57, 346−356.
(20) Sheik-Bahae, M.; Said, A. A.; Wei, T.-H.; Hagan, D. J.; Van Stryland, E. W. Sensitive Measurement of Optical Nonlinearities Using a Single Beam.IEEE J. Quantum Electron.1990,26, 760−769.
(21) Luo, Z.; Lu, Y.; Somers, L. A.; Johnson, A. T. High Yield Preparation of Macroscopic Graphene Oxide Membranes. J. Am.
Chem. Soc.2009,131, 898−9.
(22) Cuong, T. V.; Pham, V. H.; Tran, Q. T.; Hahn, S. H.; Chung, J.
S.; Shin, E. W.; Kim, E. J. Photoluminescence and Raman Studies of Graphene Thin Films Prepared by Reduction of Graphene Oxide.
Mater. Lett.2010,64, 399−401.
(23) Loh, K. P.; Bao, Q.; Eda, G.; Chhowalla, M. Graphene Oxide as a Chemically Tunable Platform for Optical Applications.Nat. Chem.
2010,2, 1015−1024.
(24) Liaros, N.; Aloukos, P.; Kolokithas-Ntoukas, A.; Bakandritsos, A.; Szabo, T.; Zboril, R.; Couris, S. Nonlinear Optical Properties and Broadband Optical Power Limiting Action of Graphene Oxide Colloids.J. Phys. Chem. C2013,117, 6842−6850.
(25) Diaz, J.; Paolicelli, G.; Ferrer, S.; Comin, F. Separation of the sp3 and sp2 Components in the C1s Photoemission Spectra of Amorphous Carbon Films.Phys. Rev. B: Condens. Matter Mater. Phys.
1996,54, 8064.
(26) Kang, D.; Shin, H. S. Control of Size and Physical Properties of Graphene Oxide by Changing the Oxidation Temperature. Carbon Lett.2012,13, 39−43.
(27) Zhang, L.; Liang, J.; Huang, Y.; Ma, Y.; Wang, Y.; Chen, Y.
Size-Controlled Synthesis of Graphene Oxide Sheets on a Large Scale Using Chemical Exfoliation.Carbon2009,47, 3365−3380.
(28) Vivien, L.; Riehl, D.; Hache, F.; Anglaret, E. Nonlinear Scattering Origin in Carbon Nanotube Suspensions.J. Nonlinear Opt.
Phys. Mater.2000,09, 297−307.
(29) Shi, H.; Wang, C.; Sun, Z.; Zhou, Y.; Jin, K.; Redfern, S. A. T.;
Yang, G. Tuning the Nonlinear Optical Absorption of Reduced Graphene Oxide by Chemical Reduction. Opt. Express 2014, 22, 19375−19385.
(30) Jiang, X.-F.; Polavarapu, L.; Neo, S. T.; Venkatesan, T.; Xu, Q.- H. Graphene Oxides as Tunable Broadband Nonlinear Optical Materials for Femtosecond Laser Pulses.J. Phys. Chem. Lett.2012,3, 785−790.
(31) Liu, Z. B.; Wang, Y.; Zhang, X. L.; Xu, Y. F.; Chen, Y. S.; Tian, J. G. Nonlinear Optical Properties of Graphene Oxide in Nanosecond and Picosecond Regimes.Appl. Phys. Lett.2009,94, 021902.
(32) Feng, M.; Zhan, H.; Chen, Y. Nonlinear Optical and Optical Limiting Properties of Graphene Families.Appl. Phys. Lett.2010,96, 033107.
(33) Venkatram, N.; Rao, D. N.; Akundi, M. A. Nonlinear Absorption, Scattering and Optical Limiting Studies of CdS Nanoparticles.Opt. Express2005,13, 867−872.
(34) Zheng, C.; Huang, J.; Lei, L.; Chen, W.; Wang, H.; Li, W.
Nanosecond Nonlinear Optical and Optical Limiting Properties of Hollow Gold Nanocages.Appl. Phys. B: Lasers Opt.2018,124, 124.