Effect of pH in the hydrothermal preparation of monoclinic tungsten oxide
Teod ora Nagyn e-Kov acs
a,*, Istv an Endre Luk acs
b, Anna Szab o
c, Klara Hernadi
c, Tam as Igricz
d, Krisztina L aszl o
e, Imre M. Szil agyi
a, Gy orgy Pokol €
a,faDepartment of Inorganic and Analytical Chemistry, Budapest University of Technology and Economics, M}uegyetem rakpart 3, Budapest, H-1111, Hungary
bResearch Institute for Technical Physics and Materials Science, Hungarian Academy of Sciences, Konkoly Thege M. út 29-33, Budapest, H-1121, Hungary
cDepartment of Applied and Environmental Chemistry, University of Szeged, Rerrich B.ter 1, Szeged, H-6720, Hungary
dDepartment of Organic Chemistry and Technology, Budapest University of Technology and Economics, M}uegyetem rakpart 3, Budapest, H-1111, Hungary
eDepartment of Physical Chemistry and Materials Science, Budapest University of Technology and Economics, M}uegyetem rakpart 3, Budapest, H-1111, Hungary
fResearch Centre for Natural Sciences, Hungarian Academy of Sciences, Magyar tudosok k€orútja 2, Budapest, H-1117, Hungary
A R T I C L E I N F O Keywords:
Monoclinic WO3
Hydrothermal pH Morphology Band gap
A B S T R A C T
This paper presents the preparation of monoclinic WO3by a one-step hydrothermal method. The effect of very acidic pH (0.1) and the significance of various additives (CH3COOH, NaClO4, Na2SO4) were investigated. To clarify the role of pH on the obtained crystal structure and morphology, every synthesis using pH 1 were repeated, and the effect of temperature, using 180 and 200C, was also studied. All samples prepared at pH 0.1 were pure, well crystallized monoclinic WO3independently from the temperature, the presence and the quality of the ad- ditives. At 180 and 200C, applying CH3COOH and NaClO4resulted nanosheets similar in size. With Na2SO4 additive at 180C sheets, at 200C sheets and also rods formed indicating that SO42was a capping agent only at 200C. For comparison, at pH 1 at both temperatures the crystalline phases and the morphologies varied depending on the type of the additive.
1. Introduction
Tungsten oxides are widely studied materials due to their versatile possibilities in everyday use. They can catalyse many reactions e.g. CO oxidation [1], isomerization of alkenes [2], dehydrogenation of alcohols [3], hydrodesulphurization and hydrocracking [4,5], epoxidation of cycloocta-1,5-diene [6], Knoevenagel condensation [7] but can be also used as gas sensors [8–13] or photoanodes in electrochemical cells [14–16]. Additionally, their potential in photocatalysis has attracted many researchers’ interest, since due to their smaller band gap (2.5–2.8 eV) than TiO2they are able to absorb not only ultra violet but visible light as well [17–25].
For the preparation of WO3powders or thinfilms there are numerous ways such as sol-gel method [14,15,26,27], spray pyrolysis [28,29], annealing of various W precursors [10,30,31], evaporation techniques [32,33] or hydrothermal procedures [34–41]. Among these, the hydro- thermal method offers not only simple apparatus and usage, but also well-crystallized nanostructures.
In most cases the one-step hydrothermal treatment results hexagonal (h-) or orthorhombic (o-) WO3 phase, and for the preparation of
monoclinic (m-) WO3there is always need for a post calcination step [21, 42–47]. The implementation for one-step hydrothermal synthesis of m-WO3without any post calcination would be huge improvement, since it is the most examined phase of WO3. So far, however, only some papers have reported about its one-step hydrothermal synthesis [48–52].
Although, in these works the authors studied the effect of various pa- rameters such as temperature, time, pH in the acidic range or concen- tration of the acid, the role of pH is still not clear. Since these preparations were carried out always in the presence of some additive, it is not clarified, whether the additive itself, the additive together with the adjusted pH, or only the pH is responsible for the formation of m-WO3. In this report, we prepared m-WO3by one-step hydrothermal reaction without any calcination using 0.1 pH. Moreover, we investigated the effects of different additives such as CH3COOH in the volume of 1.25/
2.5/5 and 7.5 mL, as well as Na2SO4and NaClO4. To get a definite answer to the effect of pH we carried out syntheses also at pH 1 and also without any additive. For revealing the influence of temperature, we used 180 and 200C as well. We investigated the obtained crystalline phases and morphology of the samples by XRD and SEM, then the pure m-WO3
products were further examined by FT-IR, Raman, UV–Vis spectroscopy,
* Corresponding author.
E-mail address:kovacs.teodora@mail.bme.hu(T. Nagyne-Kovacs).
Contents lists available atScienceDirect
Journal of Solid State Chemistry
journal homepage:www.elsevier.com/locate/jssc
https://doi.org/10.1016/j.jssc.2019.121044
Received 18 July 2019; Received in revised form 7 September 2019; Accepted 31 October 2019 Available online 1 November 2019
0022-4596/©2019 The Authors. Published by Elsevier Inc. This is an open access article under the CC BY license (http://creativecommons.org/licenses/by/4.0/).
Instruments) and put into a furnace at 180 or 200C for 24 h. Finally, the product was filtered, washed with ion exchanged water followed by ethanol and dried at 60C for 2 h.
The performed reactions are listed inTable 1. The obtained minor crystal phases are written in italics.
2.2. Characterization
For X-ray powder diffraction (XRD) measurements a PANanalytical X’Pert Pro MPD diffractometer with Cu Kαradiation (λ¼0.15418 nm), while for investigating the morphology of the samples a LEO 1540 XB electron microscope was used. Energy-dispersive X-ray spectroscopy (EDX) analyses were carried out by a JEOL JSM 5500-LV instrument. FT- IR spectra were taken by a PerkinElmer 2000 FT-IR spectrometer be- tween 450 and 4000 cm1applying KBr pellets (1 mg sample/300 mg KBr). Raman spectra were recorded by a Jobin Yvon LabRam spec- trometer equipped with an Olympus BX41 optical microscope using a frequency doubled Nd-YAG laser (532 nm), while diffuse reflectance UV–Vis spectra by a Jasco V-570 UV/VIS/NIR spectrometer. Trans- mission electron microscopy (TEM) images were taken by a FEI Tecnai G2 20 X-TWIN instrument operated at 200 keV. N2 adsorption was measured at – 196C with a Nova2000e (Quantachrome) computer- controlled apparatus. The apparent surface area (SBET) was calculated from the Brunauer–Emmett–Teller (BET) model [55].
3. Results and discussion
3.1. Crystal structure and morphology 3.1.1. Samples obtained at 180C, pH 0.1
Based on XRD patterns, samples1–7are identified as pure m-WO3
(ICDD 04-005-4272) independently on the used additive (Fig. 1). The samples are well crystallized indicated by the sharp and narrow peaks without any other phases or impurities. In the case of using CH3COOH a slight difference in crystallinity can be observed, i.e. the smaller acid volume improves it more, which is demonstrated by the much sharper reflections of samples1and2.
Based on the SEM images, not only the crystalline phase is the same, but also the morphology of samples1–7is very similar. Uniformly, the morphology consists of mostly sheets with cuboid-like shapes. In the case of using CH3COOH additive, the sheets are generally 20–100 nm thick and 200–300 nm wide and long, and the ratio of the cuboids is getting more significant due to the larger volume of the acid (samples 1–4, Fig. 2). The sample prepared with NaClO4 has similar morphology, containing bit thicker, 50–200 nm sheets (samples5–6,Fig. 2), while using Na2SO4additive results much more robust appearance of sheets, namely 100–200 nm thickness, 200–300 nm width and 350–800 nm length. Intriguingly, without additive, the morphology has the similar characteristics as sample1(sample7,Fig. 2).
3.1.2. Samples obtained at 180C, pH 1
All XRD reflections are assigned to orthorhombic WO3∙0.33H2O (ICDD 01-087-1203) in the case of using CH3COOH additive (samples 8–11,Fig. 3). The sharp, well distinguished peaks prove high degree of crystallinity of every sample independently from the volume of the acid.
On the SEM images homogenous morphology can be seen containing strongly agglomerated forms (Fig. 4). The WO3⋅0.33H2O crystals formed in angular shapes with 100–200 nm thickness and width and 200–300 nm length in the case of 1.25–5 mL CH3COOH (samples8–10, Fig. 4). These become longer when 7.5 mL acid was used, in general, more than 300 nm (sample11,Fig. 4).
3.1.3. Samples obtained at 200C, pH 0.1
Every sample is identified as pure, single phase m-WO3with high crystallinity (Fig. 5). The lower volume of CH3COOH is more beneficial as it gives narrower and sharper XRD peaks. Similar was observed in the case of 180C.
3
10 180 1.0 5 mL
CH3COOH
11 180 1.0 7.5 mL
CH3COOH
* [54] 180 1.0 2 g NaClO4
* [53, 54]
180 1.0 2 g Na2SO4 h-WO3 nanorods
* [53] 180 1.0 – WO3∙0.33H2O nanograins
12 200 0.1 1.25 mL
CH3COOH
m-WO3 nanosheets
13 200 0.1 2.5 mL
CH3COOH
14 200 0.1 5 mL
CH3COOH
15 200 0.1 7.5 mL
CH3COOH
16 200 0.1 2 g NaClO4
17 200 0.1 2 g Na2SO4
18 200 0.1 –
19 200 1.0 1.25 mL
CH3COOH
WO3∙0.33H2O,m- WO3
angular nanostructures
20 200 1.0 2.5 mL
CH3COOH
21 200 1.0 5 mL
CH3COOH
22 200 1.0 7.5 mL
CH3COOH
* [54] 200 1.0 2 g NaClO4 WO3∙0.33H2O angular nanostructures
* [53, 54]
200 1.0 2 g Na2SO4 h-WO3 nanorods
200 1.0 – WO3∙0.33H2O nanorods,
nanograins The asterisk at the samples prepared at pH 1 with the usage of NaClO4, Na2SO4or without additive refers to samples which we prepared in one of our former studies [53,54]. Thus, these results are not here reported in detail along with the last sample inTable 1(200C, pH 1, without additive).
Fig. 6shows the homogenous, well defined morphology of samples 12–18. Nanosheets are the characteristic forms when CH3COOH or NaClO4 and even when no additive were used, however, elongated, anisotropic forms appear when Na2SO4 was applied. The sheets are 20–100 nm thick and 200–300 nm wide in the case of CH3COOH, simi- larly to those observed at 180C, but became much longer from 300 to 800 nm due to the higher temperature. Beside the thin sheets, cubes and wider angular forms also appear in some places (samples12–15,Fig. 6).
When NaClO4 was used, 100–200 nm thick and 200–300 nm width
sheets formed with more than 400 nm length (sample16,Fig. 6). When no additive was used, the obtained morphology was similar to samples 12–16(sample18,Fig. 6). In the case of Na2SO4additive, however, the morphology is mainly consisted of rods along with the sheets and con- sisted of mainly rods along with sheets. These rods are 200–400 nm thick and wide and can be even more than 1μm long.
Fig. 1. XRD patterns of samples1–7(180C, pH 0.1).
Fig. 2.SEM images of samples1–7(180C, pH 0.1).
Fig. 3.XRD patterns of samples8–11(180C, pH 1).
Fig. 4.SEM images of samples8–11(180C, pH 1).
Fig. 5.XRD patterns of samples12–18(200C, pH 0.1).
The effect of Na2SO4 additive on the crystalline phase and morphology in the hydrothermal reaction of Na2WO4and HCl is well known. It results hexagonal (h-)WO3with rod-like morphology at around pH 1 [53,56,57]. Its role as a capping agent in this work, however, seemed to be varying. Based on the XRD and SEM results neither h-WO3, nor rods formed at pH 0.1, 180C (Figs. 1–2). At 200C, however, the effect of Na2SO4additive on the morphology can be observed and the product contained rod-likefigures as well beside nanosheets.
3.1.4. Samples obtained at 200C, pH 1
Samples 19–22 were identified as crystalline WO3⋅0.33H2O with small amount of m-WO3(Fig. 7). The ratio of m-WO3phase decreases along with the decreasing volume of CH3COOH.
Samples19–22have similar morphology consisting of objects with shorter and longer angular shapes (Fig. 8). They are, in general, at least 200 nm thick, 200–300 nm wide and 200–800 nm long. Comparing them to samples 8–11, prepared at 180C, we can conclude, that higher temperature is favourable for the growth of larger crystals. Due to that much greater but fewer crystal formed.
From the above detailed results we concluded, that neither the quality of the additive, nor the temperature had considerable influence on the obtained crystalline phase at pH 0.1. The formation of the m-WO3phase can be attributed only to the highly acidic pH. Therefore, we further investigated only the as-prepared new m-WO3phase found in samples 1–7.
3.2. Elemental composition (EDX)
A typical EDX spectrum shows the main components of samples1–7,
namely W and O (Fig. 9A). There are no other elements present referring to any impurity.
3.3. FT-IR, Raman spectroscopy
In the FT-IR spectra of samples1–7, the region of 1000 and 500 cm1 refers to the characteristic lattice vibrations of WO3(Fig. 9B). There are three well distinct peaks at around 750, 815 and 950 cm1, which belong toν(W–O),ν(W–O–W) andν(W–O, W––O), respectively. The broad peak at 3400-3600 cm1along with the band at 1600 cm1and in the case of some samples at 1400 cm1are ascribed to the vibration ofνsym(OH) of hydroxyl group as well as δ(OH) and ν(OH) of W–OH interaction, respectively (framed inFig. 9B) [11,58–61]. The appearance of the latter is more considerable when the volume of the acetic acid additive in- creases (samples3–4) and in the case of NaClO4additive (sample5).
Fig. 9C shows the Raman spectra of samples1–7which are the same without any difference in contrast with the FT-IR spectra. The main peaks at 810 and 710 cm1are ascribed to the stretching vibrations of m-WO3. Bands appearing at 320 and 270 cm1are assigned to the bending modes, while the less intensive ones below 200 cm1belong to the lattice vi- brations of the monoclinic phase [15,23,62–65].
3.4. UV–Vis spectroscopy, band gap
According to the diffuse reflectance UV–Vis spectra of samples1–7, significant absorption develops only in UV and the UV-near region of the Fig. 6.SEM images of samples12–18(200C, pH 0.1).
Fig. 7.XRD patterns of samples19–22(200C, pH 1).
Fig. 8.SEM images of samples19–22(200C, pH 1).
visible light (Fig. 9D). Their absorption edge is located at 450–460 nm in good agreement to the light yellow colour of m-WO3phase.
Based on the spectra, the band gaps were also calculated (Table 2).
Calculation was carried out usingαhυ¼A ðhυ EgÞnequation, where αis molar absorption coefficient,hυis the photon energy, A is a constant, Egis the band gap energy and n is depending on the direct or indirect allowed or forbidden type of the electron transition of the material, but is 2 for WO3. With plottingαhυagainst hυ(Tauc-plot), drawing a tangent line onto the linear range and extrapolating, the value at hυ¼0 gave the band gap energy (eV). For approximating A, Kubelka-Munk function was used [51,66–68].Table 2shows the band gap energy of each sample derived from diffuse reflectance spectra which are in good accordance with the reported range (2.5–3.0) [17,21,22,51,69–71]. The calculated values are technically equal which means, that neither the quality, nor the quantity of the used additives change the optical properties of m-WO3
phase.
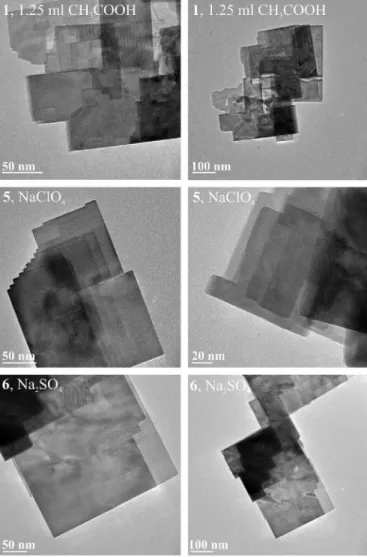
3.5. TEM
The TEM images show, that the 150–250 nm wide sheets are single crystalline and have smooth surface (Fig. 10). Their strict, straight edges can be clearly seen confirming the angular shapes appeared on the SEM images. Their thinness agrees with the SEM images and is obvious due to the visibility of other sheets ordered under each other. This up and down
ordering is confirmed by the step-like edges at samples5and6.
3.6. Specific surface area
The apparent surface area of the samples is listed inTable 3.SBETof samples 1 and 5 are comparable, considering the similar nanosheet morphology, however,6has much smaller area which can be attributed to the more robust appearance of sheets, which were considerably thicker than in the case of samples1and5, as discussed in 3.1.1.
4. Conclusion
In this study, we successfully prepared m-WO3using pH in the very acidic range (pH 0.1) during a one-step hydrothermal method without any post-calcination. Besides, we investigated the effect of various ad- ditives such as CH3COOH in different volumes (1.25/2.5/5.0/7.5 mL), as well as NaClO4, Na2SO4 and changed the temperature from 180 to 200C. As reference we carried out reactions using no additive, as well.
Tofind out the role of pH in the formation of m-WO3we repeated every synthesis at pH 1. The samples prepared at pH 0.1 at 180C and 200C were pure m-WO3 in all cases, independently on the type or on the presence of the additive. The samples had similar, nanosheet-like morphology in the case of CH3COOH, NaClO4and even when no addi- tives were used, at 180 and also at 200C. When Na2SO4was used, however, elongated sheets were obtained at 180C, but the morphology consisted of mainly rods with more than 1μm length at 200C. The appearance of the elongated sheets and rods can be attributed to the structure directing role of Na2SO4. Applying pH 1, the usage of CH3COOH in every volume, NaClO4and the absence of any additives resulted WO3⋅0.33H2O, but Na2SO4gave h-WO3. The morphology was affected by the type of the additives. The m-WO3samples prepared at pH 0.1 were further studied by EDX, FT-IR, Raman and UV–Vis spectros- copies, TEM and their band gap (2.57 eV) and specific surface area were Fig. 9.A typical EDX spectrum (A), FT-IR (B), Raman (C) and diffuse reflectance UV–Vis spectra (D) of samples 1-7.
Table 2
Calculated band gap of samples1–7.
1 2 2 4 5 6 7
Eg, Band gap (eV) 2.58 2.57 2.57 2.57 2.58 2.58 2.57 For further investigating the nanosheet morphology of m-WO3, TEM images were also taken of samples1,5and 6, and their specific surface area were also determined.
also determined.
Declarations of interest none.
Acknowledgements
T. Nagyne-Kovacs thanks for the Jozsef Varga Research Scholarship. I.
M. Szilagyi thanks for a Janos Bolyai Research Fellowship of the Hun- garian Academy of Sciences and for the ÚNKP-18-4-BME-238 New Na- tional Excellence Program of the Ministry of Human Capacities, Hungary.
A GINOP-2.2.1-15-2017-00084, an NRDI K 124212 and an NRDI TNN_16 123631 grants are acknowledged. The work performed within project VEKOP-2.3.2-16-2017-00013 was supported by the European Union and the State of Hungary, co-financed by the European Regional Develop- ment Fund. The research reported in this paper was supported by the Higher Education Excellence Program of the Ministry of Human Capac- ities in the frame of Nanotechnology and Materials Science research area of Budapest University of Technology (BME FIKP-NAT).
(2017) 46726–46737.
[8] W. Zeng, et al., Hydrothermal synthesis, characterization of h-WO3nanowires and gas sensing of thinfilm sensor based on this powder, Thin Solid Films 584 (2015) 294–299.
[9] W. Yan, M. Hu, P. Zeng, S. Ma, M. Li, Room temperature NO2-sensing properties of WO3 nanoparticles/porous silicon, Appl. Surf. Sci. 292 (2014) 551–555.
[10] I.M. Szilagyi, et al., Preparation of hexagonal WO3from hexagonal ammonium tungsten bronze for sensing NH3, Mater. Res. Bull. 44 (2009) 505–508.
[11] T. Nguyen, et al., Polycrystalline tungsten oxide nanofibers for gas-sensing applications, Sens. Actuators B Chem. 160 (2011) 549–554.
[12] I.M. Szilagyi, et al., Gas sensing selectivity of hexagonal and monoclinic WO3to H2S, Solid State Sci. 12 (2010) 1857–1860.
[13] I.M. Szilagyi, et al., Controlling the composition of nanosize hexagonal WO3for gas sensing, Mater. Sci. Forum 589 (2008) 161–166.
[14] M. Yagi, S. Maruyama, K. Sone, K. Nagai, T. Norimatsu, Preparation and photoelectrocatalytic activity of a nano-structured WO3plateletfilm, J. Solid State Chem. 181 (2008) 175–182.
[15] C. Santato, M. Odziemkowski, M. Ulmann, J. Augustynski, Crystallographically oriented mesoporous WO3films: synthesis, characterization, and applications, J. Am. Chem. Soc. 123 (2001) 10639–10649.
[16] W.L. Kwong, H. Qiu, A. Nakaruk, P. Koshy, C.C. Sorrell, Photoelectrochemical properties of WO3thinfilms prepared by electrodeposition, Energy Procedia 34 (2013) 617–626.
[17] D.B. Hernandez-Uresti, D. Sanchez-Martínez, A. Martínez-De La Cruz, S. Sepúlveda- Guzman, L.M. Torres-Martínez, Characterization and photocatalytic properties of hexagonal and monoclinic WO3prepared via microwave-assisted hydrothermal synthesis, Ceram. Int. 40 (2014) 4767–4775.
[18] Z.G. Zhao, M. Miyauchi, Nanoporous-walled tungsten oxide nanotubes as highly active visible-light-driven photocatalysts, Angew. Chem. Int. Ed. 47 (2008) 7051–7055.
[19] F.A. Ofori, F.A. Sheikh, R. Appiah-Ntiamoah, X. Yang, H. Kim, A simple method of electrospun tungsten trioxide nanofibers with enhanced visible-light photocatalytic activity, Nano-Micro Lett. 7 (2015) 291–297.
[20] X. Chen, et al., Ultrathin, single-crystal WO3nanosheets by two-dimensional oriented attachment toward enhanced photocatalystic reduction of CO2into hydrocarbon fuels under visible light, ACS Appl. Mater. Interfaces 4 (2012) 3372–3377.
[21] H. Zhang, et al., Template-free facile preparation of monoclinic WO3nanoplates and their high photocatalytic activities, Appl. Surf. Sci. 305 (2014) 274–280.
[22] S.B. Upadhyay, R.K. Mishra, P.P. Sahay, Structural and alcohol response characteristics of Sn-doped WO3nanosheets, Sens. Actuators B Chem. 193 (2014) 19–27.
[23] B. Ahmed, S. Kumar, A.K. Ojha, P. Donfack, A. Materny, Facile and controlled synthesis of aligned WO3nanorods and nanosheets as an efficient photocatalyst material, Spectrochim. Acta Part A Mol. Biomol. Spectrosc. 175 (2017) 250–261.
[24] Q.H. Li, L.M. Wang, D.Q. Chu, X.Z. Yang, Z.Y. Zhang, Cylindrical stacks andflower- like tungsten oxide microstructures: controllable synthesis and photocatalytic properties, Ceram. Int. 40 (2014) 4969–4973.
[25] I.M. Szilagyi, et al., Photocatalytic properties of WO3/TiO2core/shell nanofibers prepared by electrospinning and atomic layer deposition, Chem. Vap. Depos. 19 (2013) 149–155.
[26] G. Leftheriotis, S. Papaefthimiou, P. Yianoulis, A. Siokou, D. Kefalas, Structural and electrochemical properties of opaque sol-gel deposited WO3layers, Appl. Surf. Sci.
218 (2003) 275–280.
[27] L. Meda, et al., Photo-electrochemical properties of nanostructured WO3prepared with different organic dispersing agents, Sol. Energy Mater. Sol. Cells 94 (2010) 788–796.
[28] M. Regragui, et al., Preparation and characterization of pyrolytic spray deposited electrochromic tungsten trioxidefilms, Thin Solid Films 358 (2000) 40–45.
[29] R. Sivakumar, et al., Preparation and characterization of spray deposited n-type WO3thinfilms for electrochromic devices, Mater. Res. Bull. 39 (2004) 1479–1489.
[30] G.R. Bamwenda, H. Arakawa, Visible light induced photocatalytic activity of tungsten trioxide powders, Appl. Catal. A Gen. 210 (2001) 181–191.
[31] I.M. Szilagyi, et al., Stability and controlled composition of hexagonal WO3, Chem.
Mater. 20 (2008) 4116–4125.
Fig. 10. TEM images of1,5and6.
Table 3
Specific surface area of samples1,5and6.
1 5 6
SBET(m [2]/g) 9.0 11 5.8
[32] R. Sivakumar, R. Gopalakrishnan, M. Jayachandran, C. Sanjeeviraja, Preparation and characterization of electron beam evaporated WO3thinfilms, Opt. Mater. 29 (2007) 679–687.
[33] D. Meng, T. Yamazaki, Y. Shen, Z. Liu, T. Kikuta, Preparation of WO3nanoparticles and application to NO2sensor, Appl. Surf. Sci. 256 (2009) 1050–1053.
[34] T. Peng, et al., Hexagonal phase WO3nanorods: hydrothermal preparation, formation mechanism and its photocatalytic O2production under visible-light irradiation, J. Solid State Chem. 194 (2012) 250–256.
[35] T. Kida, A. Nishiyama, M. Yuasa, K. Shimanoe, N. Yamazoe, Highly sensitive NO2 sensors using lamellar-structured WO3particles prepared by an acidification method, Sens. Actuators B Chem. 135 (2009) 568–574.
[36] L. Zhou, et al., Green synthesis of hexagonal-shaped WO30.33H2O nanodiscs composed of nanosheets, Cryst. Growth Des. 8 (2008) 3993–3998.
[37] Z. Gu, et al., Controllable assembly of WO3nanorods/nanowires into hierarchical nanostructures, J. Phys. Chem. B 110 (2006) 23829–23836.
[38] Z. Gu, et al., Large-scale synthesis of single-crystal hexagonal tungsten trioxide nanowires and electrochemical lithium intercalation into the nanocrystals, J. Solid State Chem. 180 (2007) 98–105.
[39] J. Huang, et al., Flower-like and hollow sphere-like WO3porous nanostructures:
selective synthesis and their photocatalysis property, Mater. Res. Bull. 47 (2012) 3224–3232.
[40] F. Amano, M. Tian, G. Wu, B. Ohtani, A. Chen, Facile preparation of platelike tungsten oxide thinfilm electrodes with high photoelectrode activity, ACS Appl.
Mater. Interfaces 3 (2011) 4047–4052.
[41] X. Feng, Y. Chen, Z. Qin, M. Wang, L. Guo, Facile fabrication of sandwich structured WO3nanoplate Arrays for efficient photoelectrochemical water splitting, ACS Appl.
Mater. Interfaces 8 (2016) 18089–18096.
[42] A. Fujii, et al., Preparation of Pt-loaded WO3with different types of morphology and photocatalytic degradation of methylene blue, Surf. Coat. Technol. 271 (2015) 251–258.
[43] L. You, et al., Highly sensitive NO2sensor based on square-like tungsten oxide prepared with hydrothermal treatment, Sens. Actuators B Chem. 157 (2011) 401–407.
[44] J. Ram, et al., Effect of annealing on the surface morphology, optical and structural properties of nanodimensional tungsten oxide prepared by coprecipitation technique, J. Electron. Mater. 48 (2019) 1174–1183.
[45] S.J. Hong, H. Jun, P.H. Borse, J.S. Lee, Size effects of WO3nanocrystals for photooxidation of water in particulate suspension and photoelectrochemicalfilm systems, Int. J. Hydrogen Energy 34 (2009) 3234–3242.
[46] S.S. Kalanur, Y.J. Hwang, S.Y. Chae, O.S. Joo, Facile growth of aligned WO3 nanorods on FTO substrate for enhanced photoanodic water oxidation activity, J. Mater. Chem. 1 (2013) 3479–3488.
[47] Z. Liu, M. Miyauchi, T. Yamazaki, Y. Shen, Facile synthesis and NO2gas sensing of tungsten oxide nanorods assembled microspheres, Sens. Actuators B Chem. 140 (2009) 514–519.
[48] D. Jin, A. Phuruangrat, S. Thongtem, J. Sung, Hydrothermal synthesis of monoclinic WO3nanoplates and nanorods used as an electrocatalyst for hydrogen evolution reactions from water, Chem. Eng. J. 165 (2010) 365–369.
[49] J. Ma, et al., Topochemical preparation of WO3nanoplates through precursor H2WO4and their gas-sensing performances, J. Phys. Chem. C 115 (2011) 18157–18163.
[50] S. Adhikari, D. Sarkar, Hydrothermal synthesis and electrochromism of WO3 nanocuboids, RSC Adv. 4 (2014) 20145–20153.
[51] D. Nagy, D. Nagy, I.M. Szilagyi, X. Fan, Effect of the morphology and phases of WO3 nanocrystals on their photocatalytic efficiency, RSC Adv. 6 (2016) 33743–33754.
[52] Y. Zhang, D. Zhang, X. Xu, B. Zhang, Morphology control and photocatalytic characterization of WO3nanofiber bundles, Chin. Chem. Lett. 29 (2018) 1350–1354.
[53] T. Nagyne-Kovacs, et al., Preparation of iron tungstate (FeWO4) nanosheets by hydrothermal method, Mater. Res. Bull. 95 (2017) 563–569.
[54] T. Nagyne-Kovacs, et al., in: Effect of Different Anions upon the WO3Morphology and Structure, vol. 18, 2018, pp. 2–5.
[55] S. Brunauer, P.H. Emmett, E. Teller, Adsorption of gases in multimolecular layers, J. Am. Chem. Soc. 60 (1938) 309–319.
[56] Z. Gu, Y. Ma, W. Yang, G. Zhang, Yao, J. Self-assembly of highly oriented one- dimensional h-WO3nanostructures, Chem. Commun. 3597 (2005),https://doi.org/
10.1039/b505429j.
[57] Y. Wu, Z. Xi, G. Zhang, J. Yu, D. Guo, Growth of hexagonal tungsten trioxide tubes, J. Cryst. Growth 292 (2006) 143–148.
[58] F.S. Manciu, J.L. Enriquez, W.G. Durrer, Y. Yun, Spectroscopic analysis of tungsten oxide thinfilms, J. Mater. Res. 25 (2010) 2401–2406.
[59] V.B. Kumar, D. Mohanta, Formation of nanoscale tungsten oxide structures and colouration characteristics, Bull. Mater. Res. 34 (2011) 435–442.
[60] N.Y. Bhosale, S.S. Mali, C.K. Hong, A.V. Kadam, Hydrothermal synthesis of WO3 nanoflowers on etched ITO and their electrochromic properties, Electrochim. Acta 246 (2017) 1112–1120.
[61] V.I. Ethoxide, et al., Continuousflow synthesis of tungsten oxide (WO3) nanoplates from tungsten (VI) ethoxide, Chem. Eng. J. (2013),https://doi.org/10.1016/
j.cej.2013.03.094.
[62] M.F. Daniel, B. Desbat, J.C. Lassegues, B. Gerand, M. Figlarz, Infrared and Raman study of WO3tungsten trioxides and WO3xH2O tungsten trioxide hydrates, J. Solid State Chem. 67 (1987) 235–247.
[63] A. Takase, K. Miyakawa, Raman study on sol-gel derived tungsten oxides from tungsten ethoxide, Jpn. J. Appl. Phys. 30 (1991) 1508–1511.
[64] I.M. Szilagyi, et al., WO3photocatalysts: influence of structure and composition, J. Catal. 294 (2012) 119–127.
[65] Z. Lu, M. Kanan, C.P. Tripp, Synthesis of high surface area monoclinic WO3particles using organic ligands and emulsion based methods, J. Mater. Chem. 12 (2002) 983–989.
[66] C.G. Granqvist, Electrochromic tungsten oxide: review of progress 1993-1998, Sol.
Energy Mater. Sol. Cells 60 (2000) 201–262.
[67] R.S. Vemuri, M.H. Engelhard, C.V. Ramana, Correlation between surface chemistry, density, and band gap in nanocrystalline WO3thinfilms, ACS Appl. Mater.
Interfaces 4 (2012) 1371–1377.
[68] K. Gesheva, A. Szekeres, T. Ivanova, in: Optical Properties of Chemical Vapor Deposited Thin Films of Molybdenum and Tungsten Based Metal Oxides, vol. 76, 2003, pp. 563–576.
[69] Sohail Azmat, S.Z. Ilyas Tariq Jan, Ather Hassan, Imtiaz Habib, A.M. Qasim Mahmood, Solar light triggered photocatalytic performance of WO3nanostructures;
Waste water treatment, Mater. Res. Express 5 (2018) 115025.
[70] M. Oamar, et al., Selective photocatalytic oxidation of aromatic alcohols into aldehydes by tungsten blue oxide (TBO) anchored with Pt nanoparticles, RSC Adv.
6 (2016) 71108–71116.
[71] R.R. Kharade, S.R. Mane, R.M. Mane, P.S. Patil, P.N. Bhosale, Synthesis and characterization of chemically grown electrochromic tungsten oxide, J. Sol. Gel Sci.
Technol. 56 (2010) 177–183.