Cite this:Phys. Chem. Chem. Phys., 2018,20, 15473
Tailoring the hexagonal boron nitride nanomesh on Rh(111) with gold
R. Gubo´,abG. Va´ri,bJ. Kiss,cA. P. Farkas,acK. Palota´s, cdL. O´ va´ri, *acA. Berko´c and Z. Ko´nya bc
It is known that the hexagonal boron nitride (h-BN) monolayer has a periodically corrugated structure on Rh(111), termed ‘‘nanomesh’’, while the h-BN layer is planar on the close packed surfaces of coinage metals (Cu, Ag, Au) due the weak interactions. Our studies are aimed at understanding the metal–h-BN interaction, when both Rh and Au are present. On the one hand, the growth and thermal properties of gold deposited on h-BN nanomesh prepared on Rh(111) were studied. On the other hand, the formation of h-BN was examined on Au/Rh surface alloys prepared by the deposition of Au on Rh(111) and subsequent annealing at 1000 K. In each case, the h-BN was prepared by the decomposition of borazine at about 1000 K. Low energy ion scattering (LEIS), X-ray photoelectron spectroscopy (XPS) and scanning tunneling microscopy (STM) measurements revealed that the growth of Au on h-BN/Rh(111) at room temperature leads to the formation of mainly three dimensional (3D) gold nanoparticles, although at low coverages (o0.2 ML) 2D particles formed as well. Stepwise annealing to higher temperatures induces the intercalation of Au below the nanomesh, which was complete at around 1050 K. Some agglomeration and desorption of Au also took place. Interestingly, the nanomesh structure was observable after intercalation up to relatively large Au coverages. Measurements performed in the reverse order, namely exposing a Au/Rh(111) surface alloy to borazine, revealed that Rh atoms get covered by h-BN (or by its precursors) at significantly smaller borazine exposures than Au atoms. The nanomesh structure was essentially present up to a gold coverage of 0.9 ML, but with a smaller pore diameter, while it gradually disappeared at higher gold amounts. In this way the application of surface alloy supports provides a key for gradual tuning of the mesh morphology. Density functional theory calculations confirmed the decreased pore diameter of the BN layer upon the formation of a surface Rh–Au alloy layer.
1. Introduction
Since the discovery of the exceptional properties of graphene, including its self-supporting nature and peculiar electronic properties,1,2intense research into different nearly two dimen- sional (2D) materials has almost exploded.3–6Along these lines, hexagonal boron nitride (h-BN) has also been thoroughly investigated.5,6 One of its attractive properties is the high predicted thermal conductivity.7Most importantly, the electri- cally insulating 2D hexagonal boron nitride is an excellent support for graphene nanoelectronics.6,8 Besides, recent studies demonstrated that h-BN alone or decorated by small
Au nanoparticles is a highly selective catalyst in oxidative dehydrogenation or partial oxidation reactions.9–11
h-BN monolayers can be synthetized relatively easily on metal single crystal surfaces of hexagonal symmetry,12–25but also on rectangular ones like Pd(110),26as well as on bcc(110) surfaces.6,27The preparation of monolayer h-BN films was first realized in 1990 by decomposing borazine (B3N3H6) on Pt(111) and Ru(0001),12 and the same precursor was also applied in many later studies, as well as in the present work. The mor- phology of the h-BN layer is determined by the lattice mismatch and the strength of the interaction between the nitride and the metal. The interaction with coinage metals is weak, leading to the formation of a planar h-BN monolayer.16,21,28,29 Since Au(111) is too inert toward the decomposition of borazine, h- BN was synthetized by magnetron sputtering in a previous study.30 The formation of triangular flakes was observed at submonolayer coverages. The stronger bonding of the under- coordinated flake edges to the support led to a preferential orientation of h-BN triangles along the nearest-neighbor
aExtreme Light Infrastructure-ALPS, ELI-HU Non-profit Ltd, Dugonics te´r 13, H-6720 Szeged, Hungary
bDepartment of Applied and Environmental Chemistry, University of Szeged, Rerrich B. te´r 1., H-6720 Szeged, Hungary
cMTA-SZTE Reaction Kinetics and Surface Chemistry Research Group, Rerrich B. te´r 1., H-6720 Szeged, Hungary. E-mail: ovari@chem.u-szeged.hu
dInstitute of Physics, Slovak Academy of Sciences, SK-84511 Bratislava, Slovakia Received 2nd February 2018,
Accepted 7th May 2018 DOI: 10.1039/c8cp00790j
rsc.li/pccp
PAPER
Published on 08 May 2018. Downloaded by UNIVERSITY OF SZEGED on 11/06/2018 10:25:49.
View Article Online
View Journal | View Issue
directions on the Au(111) surface. Due to the weak interaction between gold and h-BN it was not possible to grow a continuous monolayer of the nitride before the onset of the second layer.
The almost perfect coincidence of the lattice constants of Ni(111) and bulk h-BN, accompanied by a stronger interaction between nickel and boron nitride, result in a commensurate (11) planar overlayer with N atoms at on-top positions, and B atoms in fcc hollow sites, as revealed by low energy electron diffraction (LEED), X-ray photoelectron diffraction (XPD) and density functional theory (DFT).29,31–33 Ru(0001) and Rh(111) can bind the nitride even stronger, leading to the formation of a periodically corrugated, continuous monolayer of h-BN (‘‘nano- mesh’’) on top.18,22,23,29,34,35 Similar to the Ni(111) case, the binding of h-BN to Rh(111) and Ru(0001) is strongest with N atoms at on-top positions, and B atoms in three-fold hollow sites.29 Due to the significant lattice mismatch between h-BN and the metal substrate (which is 7.0% for Rh(111), and 8.2%
for Ru(0001)), there are regions where N atoms are in hollow sites. In these areas, the distance between the surface and h-BN is larger, leading to the observed corrugation.
The growth and intercalation of metal deposits have also been intensely studied on both boronitrene and graphene using various supports.3,22,36–44 Deposition of various metals at room temperature mostly resulted in 3D nanoparticles, like for Co on h-BN/Ni(111),36for Co on h-BN/Rh(111),22for Mn on graphene/Rh(111) and on h-BN/Rh(111),42 and also for Au on h-BN/Rh(111), when the clusters are sufficiently large (consist of more thanca.30 atoms).37,43DFT calculations on single Au adatoms on h-BN/Rh(111) indicated that the interaction of Au with bulk h-BN and with the wire regions of the nanomesh is weak, but – as an effect of the Rh substrate – in the pore regions it adsorbs much stronger, especially on top of B atoms. More- over, Au atoms are negatively charged in that position.40In a similar way, for Au clusters adsorbed on the nanomesh, DFT studies predicted an extra negative charge on Au, but the amount of charge transferred per Au atom is smaller.41,43 Experimentally, on the nanomesh structure metal clusters are typically stabilized in the pores or at the edge of the pores.
Interestingly, more two dimensional gold nanoparticles also form on h-BN/Ru(0001)38as well as on graphene/Ru(0001), and also the Au platelets were characterized by the nanomesh moire´ pattern.39Raising the substrate temperature to 440 K during Co deposition on h-BN/Ni(111) led to a significant drop of the sticking coefficient.36 The intercalation of the admetal at higher temperatures is another frequently observed process.
It was significant at a deposition temperature of 450 K for Co/h-BN/Ni(111),36 and after annealing the Mn deposit on h-BN/Rh(111) at B650 K,42 in both cases accompanied by a 3D - 2D transition. Annealing smaller coverages of Au on h-BN/Ru(0001) leads mostly to agglomeration and evaporation, while at higher initial coverages (from 0.5 ML) intercalation and partial surface alloying is the dominant process. Annealing of 1 ML of Au to 1050 K on h-BN/Ru(0001) is still characterized by the nanomesh structure, although with a somewhat disturbed appearance.38 Due to the weak interaction between h-BN and gold, the intercalation of Au below a h-BN monolayer prepared
on Ni(111) resulted in a quasi-free standing state of boron nitride.45
The striking difference in the structure and bonding of h-BN on Rh(111) and Au(111) motivated the present work dealing with the interaction of boronitrene with bimetallic Au/Rh(111) surfaces. Two deposition sequences were applied: (i) prepara- tion of h-BN on Rh(111) by borazine decomposition, followed by deposition of Au atB300 K and annealing; (ii) deposition of Au on Rh(111) and annealing leading to the formation of a surface alloy, followed by borazine decomposition. Literature data about h-BN growth on bimetallic surfaces are very scarce.
Similarly, the effect of annealing was not yet studied in detail for gold deposits on h-BN/Rh(111). At a 0.2 ML initial gold coverage, high-resolution core level photoemission suggested agglomeration at 573 KrTr773 K.37At higher temperatures, it was difficult to discriminate between evaporation, intercala- tion and surface alloying. Nevertheless, NEXAFS measurements indicated the presence of the nanomesh structure.37 Here we present a detailed study on thermal processes after Au deposi- tion on h-BN/Rh(111). While in previous STM measurements the intercalation of metals was demonstrated by indirect evidence,36,42 here we also applied low energy ion scattering (LEIS), which is very well suited to this task due to its topmost layer sensitivity.46The experimental results on the evolution of the nanomesh morphology upon alloying the top Rh layer with Au are supported by DFT and STM calculations.
2. Experimental and calculation methods
The experiments were carried out in two separate ultrahigh vacuum (UHV) systems evacuated down to 5 10 8 Pa. The first one was equipped with a commercial scanning tunnelling microscope (RT-STM, WA-Technology), a cylindrical mirror analyzer with a central electron gun (Staib-DESA-100) for Auger electron spectroscopy (AES), and a quadrupole mass spectro- meter (Balzers-Prisma). The second UHV system was equipped with facilities for X-ray photoelectron spectroscopy (XPS), AES and LEIS.
In the first chamber the Rh(111) sample was mounted on a transferable sample cartridge, equipped with facilities for indirect heating of the crystal, and for temperature measure- ment by a chromel-alumel thermoelement spot-welded to the side of the probe. STM images of 256 256 pixels were generally recorded in constant current mode at a bias of +1.5 V on the sample and a tunnelling current of 0.1 nA, using Pt–Ir tips. The conditioning of the tip was a relatively simple procedure: several seconds at +3 V and 10 nA. The constant current (cc) morphology images are shown in the top-view representation, where brighter areas correspond to higher Z values. Images of enhanced lateral resolution were recorded in constant height (ch) mode, where the position dependent variation of the tunnelling current (no feedback) served for construction of the image. In the case of some high-resolution images, a gentle fast Fourier-transformation (FFT) treatment
Published on 08 May 2018. Downloaded by UNIVERSITY OF SZEGED on 11/06/2018 10:25:49.
was also applied. The X–Y–Z calibration of the STM images was performed by measuring the characteristic morphological para- meters of a TiO2(110)-(11) support (lateral unit cell: 0.296 nm 0.650 nm, step height: 0.297 nm). During the evaluation of the measured lengths, the subsequent bulk crystallographic data were used for the nearest atom–atom distances: Rh (0.2687 nm) and Au (0.2884 nm).
In the second chamber a (Leybold Heraeus) hemispherical electron energy analyzer was used for XPS, AES and LEIS. An Al Ka X-ray source47 was applied for XPS, performed with a constant pass energy. The binding energy scale was calibrated against the 4f7/2peak of a thick Au layer, fixed at 84.0 eV, and the 3d5/2peak of the Rh single crystal, fixed at 307.2 eV. The detection angle was 161with respect to the surface normal. For LEIS, He ions of 800 eV kinetic energy were applied at a low ion flux (B0.03 mA cm 2), if not mentioned otherwise, using a SPECS IQE 12/38 ion source. The incident and detection angles were 501(with respect to the surface normal), while the scatter- ing angle was 951. The angle between the ‘‘incident plane’’
(the plane defined by the ion source axis and the surface normal) and the ‘‘detection plane’’ (the plane defined by the surface normal and the analyzer axis) was 531. The probe was radiatively heated by a W filament placed behind the sample.
Its temperature was measured with a chromel-alumel (K-type) thermocouple spot welded to the side of the sample.
In all chambers one side polished Rh(111) single crystals (dia. 6 mm 1.5 mm, orientation accuracy: 0.11) were used.
The samples were routinely cleaned by applying cycles of Ar+ ion sputtering (5–10mA cm 2, 1.5 keV, 20 min) at 300 K and 10 min annealing under UHV at 1200 K. The sample was afterwards heated under 310 8mbar O2at 1050 K. The last treatment was UHV annealing at 1200 K for 1 min. h-BN monolayers were prepared at 1000 Kviathermal decomposition of499.8% purity borazine, a product of Katchem Ltd. Au was deposited by commercial 4-pocket PVD sources (Oxford Applied Research) using high-purity (99.95%) Au. The coverage of Au is expressed in monolayers (ML), defined as the surface concen- tration of Rh(111): 1.601015cm 2. This definition was used because of the pseudomorphic growth of Au on Rh(111) up to 1 ML.48 In the XPS-LEIS chamber the gold coverage was monitored by a quartz crystal microbalance (QCM), while in the STM chamber it was monitored from the volume of the deposited gold nanoparticles. In both cases, the evaporation rate was B0.2 ML per min. LEIS and XPS measurements presented in our preceding paper indicated that the sticking coefficient of Au on Rh(111) is close to unity at 500 K.48Our present XPS measurements showed that the sticking coefficient of Au on h-BN/Rh(111) is not significantly smaller at 300 K.
DFT calculations were performed using the Vienna Ab initio Simulation Package (VASP)49,50 with projector augmented waves51and van der Waals correction at the optB86b level.52,53 The slab geometry in the supercell is based on two Rh(111) layers involving 12 12 Rh atoms each, and the experimental lattice constant of Rh,a2D = 2.689 Å was used. A third metallic layer, corresponding to either pure Rh or to the Rh–Au surface alloy with a Au content of 0.49 ML (71/144), was added pseudomorphically to
this structure, followed by the h-BN overlayer in a 13 13 superstructure, corresponding to the lattice mismatch between the Rh(111) and h-BN.34 The Rh contents of the surface layer (144 and 73 Rh atoms, respectively) were always centered below the N atom at the lateral minimum of the h-BN nanomesh. Altogether 770 (2 144(Rh) + 144(Rh/Au) + 2 169(B + N)) atoms were included in the supercell. The bottom Rh layer was fixed and all other atoms were freely relaxed during the geometry optimizations, where the convergence criterion for the forces acting on individual atoms was set to 0.02 eV Å 1. A separating vacuum region of min.
16 Å thickness was used to avoid unphysical interactions between the repeated image slabs in the perpendicular (111) direction. Due to the large size of the supercell, the Brillouin zone was sampled by theGpoint only. For the STM calculations the single electron wave functions were calculated with a 331G-centered Monkhorst–
Packk-point mesh,54and the BSKAN code55,56was used with an s-wave tip orbital within the revised Chen method57corresponding to the Tersoff–Hamann model.58
3. Results and discussion
3.1. The growth of h-BN on Rh(111)
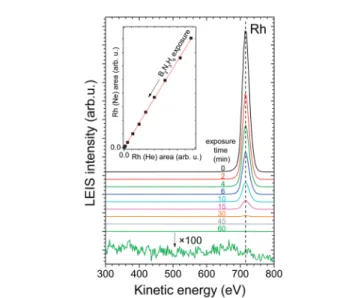
Since the growth of boronitrene was not studied previously by LEIS on Rh(111), we present here some related results. In Fig. 1 LEIS spectra, obtained with He after stepwise borazine exposure (at appr. 210 8mbar) at 1000 K, are shown. The adsorption and decomposition of borazine led to the diminution and disappear- ance of the Rh peak, which could be monitored with high sensitivity. At the same time, no new peaks appeared in the low kinetic energy region at 337 eV and 414 eV, where contributions from B and N are expected. This is in agreement with previous LEIS studies on Pt(111) and on Ru(0001) and can be rationalized by the lower sensitivity of LEIS for light elements.12Please note
Fig. 1 LEIS spectra obtained at 300 K with He, after exposing the Rh(111) surface toB1.310 8mbar borazine at 1000 K for successively increas- ing time. The last spectrum is shown also after magnification. Inset: The Rh LEIS area collected with Ne as a function of that with He, obtained in an identical measurement at 1000 K. A linear fit is also displayed.
Published on 08 May 2018. Downloaded by UNIVERSITY OF SZEGED on 11/06/2018 10:25:49.
that we had to keep the ion flux small, in order to avoid sputtering damage of the h-BN overlayer.
The information depth of LEIS with noble gas ions is restricted to the outermost atomic layer due to the dominance of single scattering. Thereby the impinging noble gas ions are directly scattered off one surface atom toward the analyzer, and almost all noble gas ions participating in multiple collisions are neutralized and consequently cannot be detected.46Since neutralization is also significant for single scattering events, the intensity of an ion scattering peak depends sensitively on the neutralization probability of the impinging noble gas ions upon the collision with the surface atoms. Although matrix effects for the neutralization probability (i.e. changes in the neutralization during scattering off a given atom as a function of its chemical environment), often simply referred to as ‘‘neutraliza- tion effects’’, are relatively rare in LEIS, these can severely hinder a quantitative evaluation of the data, if they arise.46For this reason, we addressed possible neutralization effects related to the growth of h-BN on Rh(111). As suggested in ref. 59, relevant information can be gathered from the inspection of the peak areas obtained with neon, as a function of the peak areas detected with helium in the same measurement: if neutralization effects are negligible for element A with both helium and neon, then the peak area with Ne (denoted A(Ne)) is a linear function of the peak area with He (denoted A(He)), because both depend linearly on the surface concentration of A. We observed this linear behavior for Rh(Ne) vs.Rh(He), as shown in the inset of Fig. 1, indicating the lack of neutralization effects for h-BN on Rh(111). Consequently, Rh LEIS intensity can be quantitatively analyzed, clearly indicating that the boronitrene layer is almost perfectly continuous at the end of the preparation process, leaving uncovered less than 0.0005 ML of Rh.
Please note that a previous LEIS study indicated no neutralization effects for Rh and Au.60
3.2. The growth of Au on h-BN/Rh(111)
Although the growth of Au on h-BN/Rh(111) was previously studied (not with LEIS), we performed some related measure- ments, which basically confirmed literature results, but also with some differences. First, we present our spectroscopic results on the growth of gold on h-BN/Rh(111) at 300 K, starting with LEIS (Fig. 2). The Au LEIS intensity increased steeply at small Au coverages, while it changed moderately at higher gold doses. Notably, the Au peak intensity did not reach a saturation level even atYAuB27 ML, indicating the lack of a continuous gold overlayer. This behavior is a strong indication of 3D growth, assuming that the intercalation is not the dominant process at 300 K. In any case, if intercalation proceeded to some extent at this temperature, it should occur more at small amounts of Au, because Au clusters formed on top of h-BN presumably act as nucleation centers for Au atoms landing later. However, in our measurements the Au peak increased more rapidly at small coverages, indicating that intercalation is not significant at 300 K. We determined the Au LEIS intensity of a continuous gold layer in separate measurements dosing increasing amounts of gold on Rh(111) at 500 K. As shown in our previous paper, complete decking of Rh(111) by gold can be
achieved only at YAu B 2.5 ML.48 Once the saturation Au intensity was known, the initial slope of Fig. 2 was estimated to correspond to the formation of 1–2 layers thick Au particles, implying that the initial growth of gold on h-BN is rather two- dimensional, in accordance with literature data.37,43
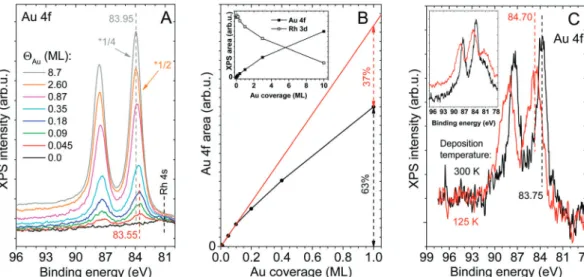
XPS measurements (Fig. 3A) of the room temperature deposition of Au on the nanomesh revealed a rather low Au 4f7/2binding energy (83.55 eV) atYAu= 0.045 ML. Although this is in agreement with previous results on h-BN/Rh(111),37,43it might be somewhat surprising, because many studies dealing with small Au clusters on insulating or semiconducting surfaces reported Au 4f7/2 binding energies higher than the bulk value (84.0 eV), attributed to less efficient screening.61–64 Since previous DFT studies40,41,43 revealed that Au atoms and small Au clusters are negatively charged on h-BN/Rh(111), we assign the observed low binding energy to an electron transfer from h-BN (and Rh(111)) to Au nanoparticles. With increasing gold coverage, as expected, the Au 4f7/2 peak gradually approached the bulk value. The negative charging of Au clusters was also confirmed by high resolution electron energy loss spectroscopy (HREELS), because the stretching vibration of adsorbed CO on Au/h-BN/Rh(111) was found at a relatively low position (2090 cm 1) atYAu= 0.2 ML, while it was detected at 2125 cm 1atYAu= 1 ML (not shown).65
The Au 4f area is displayed in Fig. 3B as a function of Au coverage. The area of the Au doublet was determined as follows:
(i) First the Rh 4s spectral contribution was removed. It was assumed that the shape and position of the Rh 4s peak did not change upon gold adsorption. This is probably fulfilled, because neither did the Rh 3d doublet change regarding shape and position. The shape of Rh 4s was known from the Au 4f region collected before gold deposition (the black spectrum of Fig. 3A, which obviously contained only Rh 4s and no Au 4f).
From the spectrum of interest obtained after gold deposition, we subtracted the Au 4f region collected before Au deposition multiplied by an attenuation factor for the Rh area. This attenuation factor was used, because gold deposition obviously resulted in a decrease in both the Rh 3d and Rh 4s areas. The attenuation factor for Rh 3d at the investigated Au coverage Fig. 2 Au LEIS intensities obtained during deposition of Au on h-BN/Rh(111) at 300 K.
Published on 08 May 2018. Downloaded by UNIVERSITY OF SZEGED on 11/06/2018 10:25:49.
could be easily determined by integrating the Rh 3d region using a Shirley baseline and dividing it by the Rh 3d area obtained for the clean h-BN/Rh(111) surface. The attenuation factor for Rh 4s was assumed to be equal to that found for Rh 3d. The importance of the removal of Rh 4s is illustrated in Fig. 3C.
(ii) After removal of the Rh 4s contribution, a Shirley base- line was also subtracted from the investigated Au 4f spectrum, and it was integrated afterwards without peak fitting.
Au 4f XPS areas presented elsewhere in the manuscript (e.g.in Fig. 5B) were obtained in an analogous way.
Interestingly, a significant broadening of the Au 4f peaks toward higher binding energies was observed, when 0.2 ML of Au was deposited at a low substrate temperature (125 K, Fig. 3C), resulting in an overall Au 4f7/2 peak position at 84.7 eV, in agreement with a previous study.43The large widths of the Au 4f peaks indicate that Au atoms are not in a single well-defined state.
The high binding energy part of the peaks presumably arises primarily due to the smaller cluster size of Au at low substrate temperature, which induces a final state effect. Nevertheless, a more positive (less negative) charge state can also play a role. It was demonstrated on various supports that at lower metal deposition temperatures smaller clusters form due to kinetic reasons.66,67 It was shown on several oxides and on non-oxidic inert surfaces that in small Au clusters (o100 atoms), very strong upward shifts (up to 1.8 eV) in the Au 4f7/2binding energy take place, attributed to less efficient screening due to the loss of metallic character in small nanoparticles.67,68
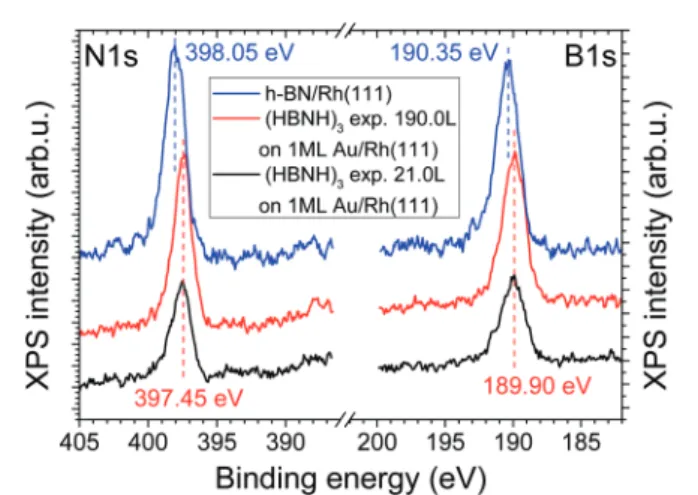
The B 1s and N 1s peaks of the h-BN nanomesh were found to be at 190.35 eV and 398.05 eV, respectively, in accordance with the literature (Fig. 9).19,69The deposition of Au induced a slight downward shift of these peaks at large gold doses (not shown).
STM results of the room temperature growth of Au are collected in Fig. 4. The image (A) of 50 50 nm2 shows the Rh(111) surface covered completely by the h-BN nanomesh,
where the lateral period of the supercell is 3.3 (0.2) nm and the apparentz-corrugation is app. 0.08 nm. These data fit well to the values obtained previously.22Thez-corrugation value is confirmed by a calculated constant-current STM image of h-BN/
Rh(111) based on DFT (not shown), resulting in a 0.084 nm value for the apparentz-corrugation at the same bias voltage.
The appearing contrast of the nanomesh exhibits substantially two different forms: the pore–wire and the ‘‘separated coin’’
structures, in which the position of the coins fits to the position of the pores (insets in Fig. 4A). It is important to note that the alteration between the two structures can be activated by the change of the imaging parameters (current, bias); however, in some cases we also experienced a spontaneous alteration, which can be related to the chemical change of the tip end. In Fig. 4B we present an atomic step region, where the distortion of the nanomesh is clearly perceptible. It is interesting that there is a half period shift at the step line (Fig. 4A and B). The deposition of gold of a very tiny amount (o0.002 ML) at 300 K results in the appearance of nanoparticles at the pore–wire interface, which suggests the most probable nucleation site of gold on the nanomesh (Fig. 4C). AtYAu= 0.13 ML, as shown in Fig. 4D, the average height and diameter of the particles are 0.40 (0.05) nm and 1.8 (0.1) nm. The particle density is around 2.1 1012 cm 2. At YAu= 1.0 ML (Fig. 4E), the size distribution (both the height and the diameter) of the Au nanoparticles is rather wide, where the highest particles consist of 4–5 layers and their diameter is around 4–5 nm. These features suggest a 3D growth mode without a significant change of the particle concentration (around 1.9 1012 cm 2). This tendency continues when increasing the coverage to 3.2 ML (Fig. 4F). In the latter case the largest particles consist of 8–9 atomic layers, their diameter is around 6–7 nm and the particle density decreases slightly down to 1.81012cm 2. The characteristic line profiles taken along the lines indicated in the corresponding STM images are shown in Fig. 4G.
Fig. 3 (A) The Au 4f region of XPS spectra collected during the stepwise deposition of Au on h-BN/Rh(111) at 300 K. (B) The area of the Au 4f doublet of the spectra presented in A, as a function of gold coverage up to 1 ML, without Rh 4s contribution. The initial slope is shown by the straight line fitted to the first three data points. Inset: XPS peak areas up to higher Au coverages. (C) Au 4f XPS region after depositing 0.2 ML of Au on h-BN/Rh(111) at different substrate temperatures with the Rh 4s contribution removed. The corresponding spectra without subtraction of Rh 4s are shown in the inset.
Published on 08 May 2018. Downloaded by UNIVERSITY OF SZEGED on 11/06/2018 10:25:49.
3.3. Thermal effects on Au/h-BN/Rh(111)
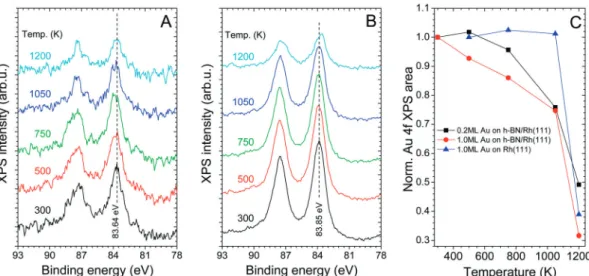
The annealing of Au deposited on the nanomesh at 300 K was investigated at different initial Au coverages with both XPS and LEIS. Au 4f XPS spectra forYAu= 0.2 ML andYAu= 1 ML are shown in Fig. 5A and B, respectively. The peak area of the Au 4f region, calculated after subtraction of the Rh 4s component, decreased moderately (by 25%) up to 1050 K, while a stronger attenuation was observed at 1200 K (in total by B50%), as shown in Fig. 5C. The attenuation can be due to three different
processes: (i) desorption of Au atoms, (ii) agglomeration of Au nanoparticles or (iii) intercalation. Evaporation (without a change in cluster size) from the surface would result in a change proportional to the amount of Au desorbed, while agglomeration and intercalation are expected to induce a much smaller reduction of the gold XPS signal. Based on this measurement, we can give a rough estimation of 25% for the extent of evaporation up to 1050 K forYAu= 0.2 ML andYAu= 1 ML (a more elaborated discussion can be found below). Please note that the desorption of Au from the Rh(111) surface was negligible up to 1050 K (Fig. 5C).
Using the ion scattering technique we investigated the effects of stepwise annealing of Au/h-BN/Rh(111) for different initial gold coverages, up toYAu= 1 ML. Gold was dosed at a substrate temperature of B350 K. Selected LEIS spectra obtained atYAu= 1 ML are shown in Fig. 6A. Au and Rh LEIS intensities as a function of annealing temperature, obtained at the different initial Au coverages, are shown in Fig. 6B. In all cases annealing led to a gradual attenuation of the Au peak, and its (almost) complete disappearance at B1050 K, but Au and Rh peaks reappeared at even higher temperatures. The complete disappearance of the gold peak can only be assigned to the intercalation of Au below the h-BN layer, since XPS revealed that desorption up to 1050 K is limited. While it is often difficult to prove unequivocally the inward diffusion by AES and STM, LEIS provides clear-cut evidence. The reappear- ance of the Au and Rh peaks at the highest temperatures is attributed to the dewetting/decomposition of the boronitrene layer. At 1200 K evaporation of Au from Rh(111) proceeds more rapidly, resulting in the drop of the Au LEIS peak in theYAu= 1 ML measurement (Fig. 6A). While the measurements yielded qualita- tively similar results for all three coverages, slight differences also arose. The intercalation was complete at 1000 K forYAu= 0.08 ML, while a small residual Au peak was also observed in theYAu= 1 ML measurement at 1050 K. Dewetting/decomposition of the h-BN monolayer set in at 1150 K in the absence of gold deposition (inset of Fig. 6B), and also at small gold coverages (0.08 ML and 0.2 ML).
However, the intercalation ofB1 ML of Au below the boronitrene layer induced the dewetting (decomposition) at a somewhat lower temperature (1100 K). At intermediate temperatures below 1050 K, agglomeration, intercalation, and also evaporation may contribute to the gradual decrease in the gold intensity.
As it was noted above, the effects of the annealing on the morphology of the surfaces presented in Fig. 4(D–F) were also followed by STM imaging. Accordingly, first different amounts of gold were deposited on the h-BN covered Rh(111) surface at room temperature. These initial states were used to follow thermally induced morphological changes. In Fig. 7 the left column shows the case ofYAu= 0.13 ML, where the deposition at 300 K resulted mainly in 2D nanoparticles of 1–2 atomic layers (Fig. 4D). The annealing (5 min in all cases) at 500 K led to a significant agglomeration resulting in 2–3 layers thick nanoparticles (a height of 0.6–0.8 nm) and an enhanced diameter of 2–3 nm (Fig. 7A1), accompanied by a decrease in the particle concentration from 2.1 1012 cm 2 down to 1.91012cm 2. The thermal treatment at 700 K led to a slight Fig. 4 STM images recorded before and after the deposition of Au at
room temperature. (A and B) h-BN/Rh(111) surface before Au deposition.
The two images of 2020 nm2inserted in (A) (left bottom) show the
‘‘pore–wire’’ and ‘‘separated coin’’ contrast variants described in the text.
The size of the images (A and B) is 5050 nm2. (C) After the deposition of a very small amount of Au (o0.002 ML) exhibiting a separate Au nano- particle grown above the h-BN mesh. Image size is 2020 nm2. (D–F) STM images taken after the deposition of different amounts of Au at 300 K:
(D) 0.13 ML, (E) 1.0 ML and (F) 3.2 ML. The size of the latter images is 5050 nm2. (G) Height profiles along the lines drawn on the corres- ponding images (D–F).
Published on 08 May 2018. Downloaded by UNIVERSITY OF SZEGED on 11/06/2018 10:25:49.
further agglomeration; however, the particle density decreased significantly byB60% down to 0.81012cm 2(Fig. 7B1). Note that the total amount of gold calculated on the basis of the apparent volume of the nanoparticles also decreased byB30%, which can be attributed either to intercalation of gold or its desorption. After a similar treatment, XPS showed only aB5%
decrease of the gold signal forYAu= 0.2 ML (Fig. 5C). Applying the inelastic mean free path (imfp) obtained by the method of Tanuma, Powell, and Penn (TPP),70a monolayer of h-BN cover layer on gold would reduce the Au 4f signal by 16%. For comparison, the decrease in the Rh 3d area was 14% upon the formation of an h-BN monolayer on clean Rh(111). This estimation implies that intercalation of B30% of the initial
gold content can account for the 5% decrease in the Au 4f doublet, even if the XPS intensity is also slightly modified by the agglomeration of Au clusters remaining outside. Therefore, evaporation of Au is negligible up to 700 K. Annealing at 900 K (Fig. 7C1) results in a dramatic decrease in the particle density (0.3 1012 cm 2), a B50% loss of the original amount estimated from the apparent volume, which is mostly due to intercalation. The STM image inserted in Fig. 7C1 shows the position of a tiny particle (arrow 1) in a pore of the nanomesh and a modified pore structure caused probably by the inter- calated gold (arrow 2). It can be seen that the intercalation of gold releases the pore region due to the weaker bonding of the h-BN film to Au. In harmony with the LEIS results (Fig. 6B), annealing at 1000 K and 1050 K results in a gradual further decrease to close to zero in both the particle density and the amount of gold volume above the nanomesh (Fig. 7D1 and E1).
XPS measurements, however, show only an overall 24% percent attenuation of the initial Au 4f doublet (Fig. 5C) at a similar amount of gold deposited (0.2 ML), implying that evaporation of Au is rather limited, in the range ofB10–15% of the initial quantity. Obviously, in the present case, the amount of gold not desorbed should be intercalated under the nanomesh, which certainly causes the island features in the image of Fig. 7E1. It is worth noting that an extensive evaporation of gold takes place above 1100 K (Fig. 5C) where the decomposition/dewet- ting of the h-BN layers also sets in (Fig. 6B).
The annealing experiments presented above were also per- formed for larger gold coverages of 1.0 ML and 3.2 ML (Fig. 7).
In the case of 1 ML (middle column), the nanoparticle density decreases only slightly relative to the initial value (1.91012cm 2) found at 300 K (Fig. 4E) after annealing at both 500 K and 700 K (1.41012cm 2). There is only a moderate change in the particle morphology (Fig. 7A2 and B2); their average diameter increases from 4–5 nm up to 5–6 nm and their height from 4–5 layers up to 6–7 layers. This fact contradicts slightly the LEIS measurements Fig. 5 The Au 4f XPS region collected after the deposition of (A) 0.2 ML and (B) 1 ML of Au on h-BN/Rh(111) at 300 K, followed by stepwise annealing at elevated temperatures for 5 min; the Rh 4s contribution was subtracted. (C) Areas of the Au 4f doublets presented in (A) and (B), as a function of annealing temperature, without Rh 4s contribution. Areas obtained after gold deposition (1 ML) on Rh(111) at 500 K and subsequent stepwise annealing are also shown.
Fig. 6 (A) LEIS spectra obtained after the deposition of 1 ML of Au on h-BN/Rh(111) atB350 K, followed by stepwise annealing at an elevated temperature for 5 min. (B) Au LEIS intensities as a function of annealing temperature for different initial gold coverages. Gold was dosed at a B350 K substrate temperature. Inset: Rh LEIS intensities, normalized to the intensity of the clean Rh(111) surface, obtained in the same measure- ments, and also during annealing of the gold-free h-BN/Rh(111) surface.
Published on 08 May 2018. Downloaded by UNIVERSITY OF SZEGED on 11/06/2018 10:25:49.
(Fig. 6B), where the intensity loss of the Au signal was more than 50% in this temperature range. The effect of annealing at 900 K and 1000 K on the particle morphology is much more signifi- cant; the particle density decreases to 1.0 1012 cm 2 and 0.21012cm 2, respectively (Fig. 7C2 and D2). After thermal treatment at 1050 K, Au particles almost completely disappear, showing that desorption/intercalation of gold take place (Fig. 7E2).
It is somehow surprising that the nanomesh does not show any significant change; there is no sign of the effect of Au.
The majority of the deposited approximately 1 ML of gold is certainly present under the h-BN layer, because the Au signal detected by XPS is still 75% of its original value (Fig. 5C), while the LEIS signal of Au is close to zero (Fig. 6B). In order to estimate more precisely the amount of Au desorbed up to this point starting fromYAu= 1.0 ML, we have to take into account that upon room temperature deposition 3D clusters form, and
Au atoms located in the subsurface region within metal clusters are screened by other Au atoms above them, leading to a reduced Au 4f XPS signal. This effect is small atYAu= 0.13 ML, where the average cluster height is between 1–2 atomic layers.
However, the extrapolation of the initial slope of the gold uptake curve at 300 K shows that the extent of this screening effect is 37%
atYAu= 1 ML (Fig. 3B). In the present estimation we assume that after intercalation all (non desorbed) Au atoms are located in the topmost atomic layer of the metal surface, under the h-BN monolayer. In this final state the screening effect of h-BN is 16%
based on the TPP imfp values, but Au atoms do not screen each other any more. Consequently the transition from the initial state (3D Au clusters on top of h-BN) to the final state (Au atoms in the topmost metal layer, below h-BN) should lead to an overall 33%increase in the Au 4f area in the absence of Au desorption ((1 0.16)/(1 0.37) = 1.33). The fact that a 25% attenuation of the gold XPS signal was observed implies (0.75/1.33 = 0.56) thatB44%
of the initial Au amount desorbed up to 1050 K, resulting in a final gold coverage ofB0.62 ML. As mentioned above, after deposition ofYAu= 0.2 ML of Au, annealing up to 1050 K leads to desorption ofB15% of the initial amount. This comparison suggests that small gold clusters have a higher tendency for intercalation. It may imply that cycles of Au deposition and annealing may be more efficient in the intercalation of larger amounts of gold below h-BN, instead of depositing much Au in a single dose followed by annealing.
For an initial Au deposition of 3.2 ML a quite similar process can be observed as in the case of 1 ML (Fig. 7A3–E3). The size of the biggest particles is somewhat larger, and it reaches a max- imum after the annealing at 900 K; the diameter is 6–8 nm, while the height is 6–7 atomic layers. An interesting observation at 1050 K on large terraces (Fig. 7E3) is that extra 2D particles appear showing similar nanomesh properties as in the case of the clean Rh(111) surface. Nevertheless, it seems probable that the amount of intercalated Au is significantly less than the deposited 3.2 ML due to the enhanced importance of Au desorption at higher initial gold coverages. Besides, further studies are needed to reveal the location of Au below h-BN.
3.4 Growth of h-BN on bimetallic Au/Rh(111)
We also performed measurements with the reverse sequence, i.e. evaporating gold on Rh(111) and annealing the probe at 1000 K before contacting the surface with borazine. In our previous paper we studied in detail the interaction of Au with Rh(111).48Those STM, XPS and LEIS investigations revealed a layer-by layer growth of gold on Rh(111) at 500 K up toYAu= 0.5 ML;
however, above this coverage a slight deviation from 2D growth was identified, attributed mainly to kinetic and morphological effects.
A continuous cover layer of Au was formed only above 2.5 ML.
Below this coverage, the pseudomorphic character of the Au overlayer was clearly proven by STM, but this feature disappears at around 4 ML coverage. Surface mixing of these bulk immiscible metals was observed at 600 K and above, which can result in random alloying or in structures ordered on the atomic scale. The ordered surface structure consists of (21) domains with a lateral extension of 44 nm2, tentatively assigned to alternating rows of Fig. 7 The effect of thermal annealing on the h-BN/Rh(111) surfaces
exposed to different amounts of Au at room temperature. The initial surfaces can be seen in Fig. 4D–F for Au coverages of 0.13 ML, 1.0 ML and 3.2 ML, respectively. Annealing at 500 K (A1–A3), 700 K (B1–B3), 900 K (C1–C3), 1000 K (D1–D3) and 1050 K (E1–E3) was performed for 5 min in each case. The size of the images is 5050 nm2and that of the inserted images is 2020 nm2.
Published on 08 May 2018. Downloaded by UNIVERSITY OF SZEGED on 11/06/2018 10:25:49.
Au and Rh, approximately in the same outermost atomic plane.48 The structure and mixing properties of bimetallic Au–Rh nano- particles on oxides, including the formation of core–shell and
‘‘ball-cup’’ clusters, were also studied previously.71–75
In the present LEIS measurements, different amounts of Au were dosed onto Rh(111) at 500 K, followed by 5 min annealing at 1000 K. We recall that the evaporation of Au from Rh(111) is negligible up to 1050 K (Fig. 5C). Besides, the 1000 K annealing led to a slight increase in the Au LEIS peak, and a moderate attenuation of the Rh peak, excluding thermally induced diffu- sion of Au into the subsurface of Rh. The observed slight changes in LEIS upon annealing can be rationalized by the larger size of Au atoms. The surface was then exposed to borazine for increasing durations at 1000 K. Fig. 8A displays spectra obtained at YAu = 0.25 ML as a function of borazine exposure (L) (by definition 1 L = 10 6Torr s, 1 Torr = 1.33 mbar).
Peaks originating from both Rh and Au decreased due to borazine decomposition, but the Rh peak attenuated much more rapidly, attributed to a larger reactivity of Rh, and the stronger bonding of h-BN to Rh compared to Au.
In Fig. 8B and C, Rh and Au LEIS intensities are displayed on a logarithmic scale as a function of borazine exposure, after normalization to the intensities obtained after the 1000 K anneal- ing of the (bimetallic) surface, before borazine admission. The attenuation of the Rh peak of the clean Rh(111) surface can be well approximated by a simple exponential decay. The behavior observed at different gold coverages can be summarized as follows:
(i) the attenuation of the Rh signal was always steeper than that of the Au peak; (ii) the decrease in the Rh intensity followed expo- nential decay at each gold coverage. The presence of gold resulted in quicker attenuation of the normalized Rh intensity, compared to the clean Rh(111) surface, and this effect was enhanced at
increasing Au doses (Fig. 8C). This behavior may be rationalized by assuming that a part of the borazine adsorbed on Au diffuses onto the Rh sites. (iii) The normalized Au LEIS intensity decays exponentially only at moderate borazine exposures, up to 30–50 L.
The slope of the decay decreases with increasing gold coverage.
This may imply that some h-BN (or partially decomposed borazine fragments) formed on Rh spills over to Au. The smaller the amount of Rh on the bimetallic surface the less this route can promote coverage of Au by h-BN. (iv) One might expect that at higher exposures, when h-BN formation on Rh is already completed, gold attenuation becomes independent of gold coverage. However, this was not the case. It is possible that migration of h-BN (or its precursors) from Rh to Au goes on, but Rh atoms liberated this way become immediately covered by newly adsorbed borazine mole- cules. We recall that Au forms a continuous layer on Rh(111) at YAu= 4 ML, while this is not the case atYAu= 1 ML.48In a separate measurement the preparation of h-BN on 4 ML Au/Rh(111) was investigated at a somewhat higher pressure, leading to anB80%
decrease of the Au peak up to 530 L (not shown).
Of course, the question arises, how the decrease in the Au and Rh LEIS intensities can be so different, since, according to our previous study, these elements are extensively mixed in the topmost layer of Rh(111), although not necessarily at the atomic level.48 In the case of alloying at the atomic level, separate coverage of Au and Rh during h-BN growth is possible, if precursors with a size of a few Å are located on the Rh atoms, e.g.fragments of one or two borazine molecules. Alternatively, it cannot be excluded that the formation of the boronitrene layer on top of the bimetallic surface induces the rearrange- ment of metal atoms in the atomic layer below h-BN. Regarding the nature of the decomposition products, please note that previous temperature programmed desorption studies revealed
Fig. 8 LEIS results obtained during contact of different bimetallic Au–Rh surfaces to increasing exposures of borazine at 1000 K. The bimetallic surfaces were prepared by depositing the given amount of Au on Rh(111) at 500 K, followed by 5 min annealing at 1000 K, before borazine admission. (A) LEIS spectra obtained atYAu= 0.25 ML. (B) Rh and Au LEIS intensities on a logarithmic scale as a function of borazine exposure for the clean Rh(111) surface and for different coverages of Au on Rh(111). All values are normalized to the intensities obtained after annealing the gold decorated surface to 1000 K, before borazine admission. Empty and filled symbols refer to Rh and Au intensities, respectively. (C) The same as in (B), displaying the small exposure range. In (B) and (C) an exponential decay function (a straight line on the logarithmic scale) was fitted to the Au intensities obtained at smaller borazine exposures, and to Rh intensities.
Published on 08 May 2018. Downloaded by UNIVERSITY OF SZEGED on 11/06/2018 10:25:49.
that the dehydrogenation of borazine on Rh(111) is complete up to 800 K.76Nevertheless, its decomposition may be hindered on Rh atoms surrounded by Au atoms, and even more on pure Au regions.
N 1s and B 1s regions of the XPS spectra of the bimetallic 1 ML Au/Rh(111) surface, obtained after increasing exposure to borazine at 1000 K, are shown in Fig. 9. For comparison, the XPS spectrum of the Rh(111) surface, completely covered by boronitrene, is also shown. Exposure values, chosen for the bimetallic surface, correspond to different periods of h-BN growth; at 21 L practically all Rh atoms are already covered by h-BN, according to LEIS, but the Au ion scattering peak decreased only by 45%. At 190 L the attenuation of the Au peak is also close to being complete (Fig. 8). The binding energies of both the N 1s and B 1s peaks were considerably smaller than the respective values obtained for the gold-free surface. This is in qualitative agreement with literature data, indicating smaller N 1s and B 1s binding energies when h-BN was supported by Au or other coinage metals compared to late transition metals like Ni or Ru.15,38,45
In our case the spectrum collected after an exposure of 190 L is dominated by h-BN bound to gold, but at the smaller borazine exposure (21 L) the relative contribution of h-BN bound to Rh is somewhat larger. Before borazine adsorption the topmost surface area consisted of 89% of Au and 11% of Rh, due to the non perfect 2D growth of Au on Rh(111). After the 21 L exposure, the Rh LEIS peak practically disappeared, implying that h-BN bound to Rh coveredB11% of the surface, assuming no change in the total number of Rh atoms in the topmost metal layer. At the same time, 45% of the gold fraction was covered by h-BN, corresponding to 40% of the total surface area. This estimation suggests that even in this case the h-BN XPS signal is dominated by h-BN bound to gold, but the influence of Rh is somewhat larger. Indeed, the N 1s and B 1s peaks were detected at slightly higher binding energies, by
about 0.05–0.1 eV. The Au 4f peaks decreased only by 8% due to borazine decomposition up to 190 L, proving the lack of Au desorption during h-BN formation (not shown). The small extent of the Au 4f attenuation also indicates the lack of significant migration of Au into the subsurface region of Rh(111).
We present STM images of 30 30 nm2 taken after the nanomesh formation on Rh(111) surfaces alloyed by different amounts of Au (Fig. 10). The clean Rh(111) surface was exposed to gold at 300 K and annealed for 5 min at 1000 K. In each case, the alloyed surface was exposed to borazine of app. 250 L at 1000 K. An interesting observation from these measurements is that the nanomesh structure could be formed up to relatively high gold coverages. It can be seen that in the case of 0.4 ML and 0.7 ML of gold, the h-BN nanomesh was clearly present, but exhibited some distortion from that found on the clean Rh(111) surface (Fig. 10A–C). Although the pore–wire periodi- city (B3.2 nm) was substantially preserved, the pore diameter showed a rather large variety in the range of 1.7–2.5 nm, in contrast to the gold-free case, when it varied between 1.9–2.1 nm. At 0.9 ML the pore centers were observable every- where, but their average size decreased down to approximately 1.7 nm (on Rh(111) the pore diameter was 2.0 nm) and they show a rather wide variation between 1.5 nm and 1.9 nm. The average apparent pore depth did not change significantly with respect to the gold-free case, however, some of them collapsed into a common depressed structure (Fig. 10D arrow). At the higher coverage of 1.2 ML the change of the pore–wire structure is already very significant; there are regions where no pores are observable (E). This behavior is probably the consequence of the weaker bonding between the gold (or the gold-rich regions) and the h-BN layer and suggests that the distribution of gold is not uniform. In the case of 1.5 ML of gold the number of pores decreased radically; most of the surface is flat (F).
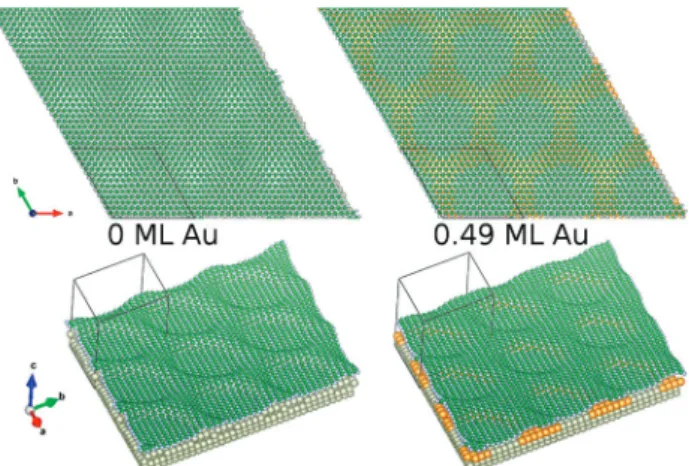
In order to confirm the decreased pore diameter of h-BN upon Au-alloying of the metal overlayer DFT calculations were performed. The optimized atomic structures of h-BN supported by a pure Rh layer (with 0 ML Au) and a Rh–Au ordered surface alloy layer (with 0.49 ML Au) directly below the h-BN are reported in Fig. 11. The decreased h-BN pore diameter for the 0.49 ML Au structure compared to the full Rh is evident, thus the experimental findings were reproduced by DFT. The reason is the strong bonding of the vertical minima of the h-BN nanomesh to the decreased Rh content of the top metal layer.
Furthermore, pore depths with the following geometrical cor- rugation values of the h-BN layer were found: 2.35 Å (0 ML Au) and 2.06 Å (0.49 ML Au). Even though these geometrical corrugations are quite large, simulations of STM images indicate that the apparent corrugation of both structures is considerably smaller (0.084 and 0.085 nm, respectively) at the experimentally employed bias voltage, in good agreement with the findings of the STM measurements. The origin of this effect is most likely the electron states of the Rh contributing to the tunneling current that reduce the apparent corrugation of the h-BN layer. We note that the details of the Rh–Au arrangement below the h-BN need further studies both experimentally and theoretically, which are in progress.
Fig. 9 N 1s and B 1s XPS regions collected after increasing exposure of the 1 ML Au/Rh(111) surface to borazine at 1000 K. The bimetallic surface was prepared by depositing 1 ML of Au on Rh(111) at 500 K, followed by 5 min annealing at 1000 K, before borazine admission. For comparison, the corresponding XPS regions of the Rh(111) surface, completely covered by boronitrene, are also shown.
Published on 08 May 2018. Downloaded by UNIVERSITY OF SZEGED on 11/06/2018 10:25:49.
Summarizing this section, it was observed experimentally that the nanomesh structure characteristic of Rh(111) persists also in the presence of close to 1 ML of Au located in the outermost metallic layer, although with some distortions and with a smaller pore diameter. The h-BN overlayer gradually flattens out at higher coverages. DFT results confirmed the decreased pore diameter upon alloying the topmost Rh layer with 0.49 ML of Au, and revealed large geometrical corrugations of the h-BN layer, which, however, are not observable by STM, and both theory and experiment indicate moderate apparent heights of the STM images in quantitative agreement. In other words, the morphological features of the nanomesh (pore diameter and probably also pore depth) can be fine tuned by changing the gold content. The implications can be wide- spread. For example, 2D materials like graphene and h-BN can act as a template for cluster growth, resulting in a narrow size distribution.43,77–80 This allows for a better characteriza- tion of cluster reactivity, highly relevant for catalysis.44,80,81The cluster dimension/shape will probably be different if the nano- mesh morphology is changed, which could also influence chemical reactivity. As another example for controlling h-BN
morphology, it was demonstrated that the nanomesh on Rh(111) can be flattened out by the intercalation of hydrogen atoms. Hydrogen can be dosed as atomic hydrogen under UHV,82 or even in an electrochemical cell (EC-STM).83 The latter approach was used to correlate adhesion and stiction for a liquid drop at the atomic level.83It is reasonable to assume that adhesion properties can be controlled by tuning nanomesh morphology,e.g.applying alloy substrates like in our case.
4. Conclusion
Here we reported spectroscopy and microscopy results on the growth of Au on the h-BN nanomesh prepared on Rh(111) at room temperature, and thermal effects including the inter- calation, desorption and sintering of gold. As a first in the literature, we also reported in this work on the growth of hexagonal boron nitride on Au/Rh(111) surface alloys of various Au content. In both cases, the h-BN monolayer was synthetized by the high temperature decomposition of borazine.
STM and LEIS measurements confirmed that at small cov- erages up toYAu= 0.1–0.2 ML, nearly two dimensional clusters form on a h-BN/Rh(111) surface, while at higher gold doses a clear 3D growth was found. Au nanoparticles nucleate prefer- entially at the pore–wire interface. Metal deposition at cryo- genic temperatures yielded smaller clusters. Annealing the Au/
h-BN/Rh(111) system to higher temperatures (T Z 700 K) resulted in the intercalation of Au below the h-BN layer, which is complete at 1050 K. Intercalated Au atoms are predominantly located in the topmost atomic plane of the Rh(111) crystal.
Besides, agglomeration and desorption of gold also take place.
Interestingly, the h-BN nanomesh structure can accommodate a significant amount of Au beneath.
In another set of experiments, first a gold–rhodium surface alloy was formed by depositing various amounts of Au on Rh(111) followed by annealing at 1000 K. The h-BN layer on top of the alloy was prepared afterwards by borazine Fig. 10 h-BN layer formation at 1000 K by an exposure of 250 L borazine
to Au–Rh alloy surfaces with different Au content: (A) 0.0 ML, (B) 0.4 ML, (C) 0.7 ML, (D) 0.9 ML, (E) 1.2 ML and (F) 1.5 ML. The alloy surface was prepared by deposition of Au onto the clean Rh(111) surface at room temperature, followed by annealing at 1000 K for 5 min. The size of all cc images is 3030 nm2.
Fig. 11 DFT-optimized structures of h-BN directly in contact with a pure Rh layer (with 0 ML Au) and a Rh–Au ordered surface alloy layer (with 0.49 ML Au) supported by Rh(111). Color coding of the elements: Rh: grey (large), Au: yellow, B: green, N: grey (small).
Published on 08 May 2018. Downloaded by UNIVERSITY OF SZEGED on 11/06/2018 10:25:49.
decomposition at 1000 K. LEIS results proved that Rh atoms get covered at much smaller borazine exposures than Au. Appar- ently, a part of the borazine molecules adsorbed on Au diffuse to Rh enhancing the rate of h-BN formation there. Conversely, boron nitride (or its precursors) formed on Rh can spill over to Au. h-BN formation on pure gold is very slow. The nanomesh structure is essentially observable up to relatively large amounts of gold (0.9 ML). In the presence of Au the nanomesh periodi- city is the same, but the pore diameter is smaller, and there are more defects. At Au coverages in the range of 0–0.9 ML the nanomesh periodicity is the same, but there are more defects, and the pore diameter is decreasing. DFT results confirm the decreased pore diameter upon alloying the top Rh layer with 0.49 ML of Au, and also reveal a slightly decreased pore depth, which is not visible by STM. On increasing the amount of Au, there are flat regions and regions covered by the nanomesh structure, indicating that Au atoms are not homogeneously dispersed on the surface. Therefore, the h-BN cover layer is also an indicator for the bimetallic composition of the metal underneath.
Conflicts of interest
There are no conflicts of interests to declare.
Acknowledgements
The financial support of GINOP-2.3.2-15-2016-00013, GINOP-2.3.6- 15-2015-00001, and NKFIH OTKA K 120115, NKFIH OTKA FK 124100, and SASPRO-1239/02/01 are gratefully acknowledged.
References
1 K. S. Novoselov, A. K. Geim, S. V. Morozov, D. Jiang, Y. Zhang, S. V. Dubonos, I. V. Grigorieva and A. A. Firsov, Science, 2004,306, 666–669.
2 K. S. Novoselov, A. K. Geim, S. V. Morozov, D. Jiang, M. I.
Katsnelson, I. V. Grigorieva, S. V. Dubonos and A. A. Firsov, Nature, 2005,438, 197–200.
3 M. Batzill,Surf. Sci. Rep., 2012,67, 83–115.
4 S. Agnoli and G. Granozzi,Surf. Sci., 2013,609, 1–5.
5 M. Xu, T. Liang, M. Shi and H. Chen,Chem. Rev., 2013,113, 3766–3798.
6 A. Pakdel, Y. Bando and D. Golberg,Chem. Soc. Rev., 2014, 43, 934–959.
7 L. Lindsay and D. A. Broido,Phys. Rev. B: Condens. Matter Mater. Phys., 2011,84, 155421.
8 M. Yankowitz, J. Xue and B. J. LeRoy, J. Phys.: Condens.
Matter, 2014,26, 303201.
9 M. Turner, V. B. Golovko, O. P. H. Vaughan, P. Abdulkin, A. Berenguer-Murcia, M. S. Tikhov, B. F. G. Johnson and R. M. Lambert,Nature, 2008,454, 981–983.
10 J. T. Grant, C. A. Carrero, F. Goeltl, J. Venegas, P. Mueller, S. P. Burt, S. E. Specht, W. P. McDermott, A. Chieregato and I. Hermans,Science, 2016,354, 1570–1573.
11 L. Shi, D. Wang, W. Song, D. Shao, W.-P. Zhang and A.-H. Lu,ChemCatChem, 2017,9, 1720.
12 M. T. Paffett, R. J. Simonson, P. Papin and R. T. Paine,Surf.
Sci., 1990,232, 286–296.
13 A. Nagashima, N. Tejima, Y. Gamou, T. Kawai and C. Oshima, Phys. Rev. B: Condens. Matter Mater. Phys., 1995,51, 4606–4613.
14 M. Corso, W. Auwa¨rter, M. Muntwiler, A. Tamai, T. Greber and J. Osterwalder,Science, 2004,303, 217–220.
15 A. B. Preobrajenski, A. S. Vinogradov and N. Mårtensson, Surf. Sci., 2005,582, 21–30.
16 S. Joshi, D. Ecija, R. Koitz, M. Iannuzzi, A. P. Seitsonen, J. Hutter, H. Sachdev, S. Vijayaraghavan, F. Bischoff, K. Seufert, J. V. Barth and W. Auwa¨rter,Nano Lett., 2012,12, 5821–5828.
17 M. Morscher, M. Corso, T. Greber and J. Osterwalder,Surf.
Sci., 2006,600, 3280–3284.
18 A. Goriachko, Y. He, M. Knapp, H. Over, M. Corso, T. Brugger, S. Berner, J. Osterwalder and T. Greber,Langmuir, 2007,23, 2928–2931.
19 A. B. Preobrajenski, M. A. Nesterov, M. L. Ng, A. S. Vinogradov and N. Mårtensson,Chem. Phys. Lett., 2007,446, 119–123.
20 E. C´avar, R. Westerstro¨m, A. Mikkelsen, E. Lundgren, A. S.
Vinogradov, M. L. Ng, A. B. Preobrajenski, A. A. Zakharov and N. Mårtensson,Surf. Sci., 2008,602, 1722–1726.
21 F. Mu¨ller, S. Hu¨fner, H. Sachdev, R. Laskowski, P. Blaha and K. Schwarz,Phys. Rev. B: Condens. Matter Mater. Phys., 2010, 82, 113406.
22 I. Brihuega, C. H. Michaelis, J. Zhang, S. Bose, V. Sessi, J. Honolka, M. Alexander Schneider, A. Enders and K. Kern, Surf. Sci., 2008,602, L95–L99.
23 G. Dong, E. B. Fourre´, F. C. Tabak and J. W. M. Frenken, Phys. Rev. Lett., 2010,104, 96102.
24 F. Orlando, R. Larciprete, P. Lacovig, I. Boscarato, A. Baraldi and S. Lizzit,J. Phys. Chem. C, 2012,116, 157–164.
25 F. Spa¨th, J. Gebhardt, F. Du¨ll, U. Bauer, P. Bachmann, C. Gleichweit, A. Go¨rling, H.-P. Steinru¨ck and C. Papp,2D Mater., 2017,4, 35026.
26 M. Corso, T. Greber and J. Osterwalder,Surf. Sci., 2005,577, L78–L84.
27 N. A. Vinogradov, A. A. Zakharov, M. L. Ng, A. Mikkelsen, E. Lundgren, N. Mårtensson and A. B. Preobrajenski, Langmuir, 2012,28, 1775–1781.
28 R. Laskowski, P. Blaha and K. Schwarz,Phys. Rev. B: Condens.
Matter Mater. Phys., 2008,78, 45409.
29 J. Go´mez Dı´az, Y. Ding, R. Koitz, A. P. Seitsonen, M. Iannuzzi and J. Hutter,Theor. Chem. Acc., 2013,132, 1350.
30 L. Camilli, E. Sutter and P. Sutter,2D Mater., 2014,1, 25003.
31 E. Rokuta, Y. Hasegawa, K. Suzuki, Y. Gamou, C. Oshima and A. Nagashima,Phys. Rev. Lett., 1997,79, 4609–4612.
32 W. Auwa¨rter, T. J. Kreutz, T. Greber and J. Osterwalder,Surf.
Sci., 1999,429, 229–236.
33 M. Muntwiler, W. Auwa¨rter, F. Baumberger, M. Hoesch, T. Greber and J. Osterwalder,Surf. Sci., 2001,472, 125–132.
34 R. Laskowski and P. Blaha,J. Phys.: Condens. Matter, 2008, 20, 64207.
35 S. Berner, M. Corso, R. Widmer, O. Groening, R. Laskowski, P. Blaha, K. Schwarz, A. Goriachko, H. Over, S. Gsell,
Published on 08 May 2018. Downloaded by UNIVERSITY OF SZEGED on 11/06/2018 10:25:49.
M. Schreck, H. Sachdev, T. Greber and J. Osterwalder, Angew. Chem., Int. Ed., 2007,46, 5115–5119.
36 W. Auwa¨rter, M. Muntwiler, T. Greber and J. Osterwalder, Surf. Sci., 2002,511, 379–386.
37 M. L. Ng, A. B. Preobrajenski, A. S. Vinogradov and N. Mårtensson,Surf. Sci., 2008,602, 1250–1255.
38 A. Goriachko, Y. B. He and H. Over,J. Phys. Chem. C, 2008, 112, 8147–8152.
39 L. Liu, Z. Zhou, Q. Guo, Z. Yan, Y. Yao and D. W. Goodman, Surf. Sci., 2011,605, L47–L50.
40 H. P. Koch, R. Laskowski, P. Blaha and K. Schwarz,Phys.
Rev. B: Condens. Matter Mater. Phys., 2011,84, 245410.
41 H. P. Koch, R. Laskowski, P. Blaha and K. Schwarz,Phys.
Rev. B: Condens. Matter Mater. Phys., 2012,86, 155404.
42 Y. Zhang, Y. Zhang, D. Ma, Q. Ji, W. Fang, J. Shi, T. Gao, M. Liu, Y. Gao, Y. Chen, L. Xu and Z. Liu,Nano Res., 2013,6, 887–896.
43 M. C. Patterson, B. F. Habenicht, R. L. Kurtz, L. Liu, Y. Xu and P. T. Sprunger, Phys. Rev. B: Condens. Matter Mater.
Phys., 2014,89, 205423.
44 W. C. McKee, M. C. Patterson, D. Huang, J. R. Frick, R. L. Kurtz, P. T. Sprunger, L. Liu and Y. Xu,J. Phys. Chem.
C, 2016,120, 10909–10918.
45 D. Usachov, V. K. Adamchuk, D. Haberer, A. Gru¨neis, H. Sachdev, A. B. Preobrajenski, C. Laubschat and D. V. Vyalikh,Phys. Rev. B:
Condens. Matter Mater. Phys., 2010,82, 75415.
46 H. H. Brongersma, M. Draxler, M. de Ridder and P. Bauer, Surf. Sci. Rep., 2007,62, 63–109.
47 J. Cazaux, T. Bardoux, D. Mouze, J. M. Patat, G. Salace, X. Thomas and J. To´th,Surf. Interface Anal., 1992,19, 197–199.
48 L. O´va´ri, A. Berko´, G. Va´ri, R. Gubo´, A. P. Farkas and Z. Ko´nya,Phys. Chem. Chem. Phys., 2016,18, 25230–25240.
49 G. Kresse and J. Furthmu¨ller,Phys. Rev. B: Condens. Matter Mater. Phys., 1996,54, 11169–11186.
50 G. Kresse and J. Furthmu¨ller,Comput. Mater. Sci., 1996,6, 15–50.
51 G. Kresse and D. Joubert, Phys. Rev. B: Condens. Matter Mater. Phys., 1999,59, 1758–1775.
52 J. Klimesˇ, D. R. Bowler and A. Michaelides,J. Phys.: Condens.
Matter, 2010,22, 22201.
53 J. Klimesˇ, D. R. Bowler and A. Michaelides, Phys. Rev. B:
Condens. Matter Mater. Phys., 2011,83, 195131.
54 J. D. Pack and H. J. Monkhorst, Phys. Rev. B: Solid State, 1976,13, 5188.
55 W. Hofer,Prog. Surf. Sci., 2003,71, 147–183.
56 K. Palota´s and W. A. Hofer,J. Phys.: Condens. Matter, 2005, 17, 2705–2713.
57 G. Ma´ndi and K. Palota´s, Phys. Rev. B: Condens. Matter Mater. Phys., 2015,91, 165406.
58 J. Tersoff and D. R. Hamann,Phys. Rev. B: Condens. Matter Mater. Phys., 1985,31, 805–813.
59 G. Va´ri, L. O´va´ri, J. Kiss and Z. Ko´nya, Phys. Chem. Chem.
Phys., 2015,17, 5124–5132.
60 L. O´va´ri, A. Berko´, R. Gubo´, A´. Ra´cz and Z. Ko´nya,J. Phys.
Chem. C, 2014,118, 12340–12352.
61 W. F. Egelhoff,Surf. Sci. Rep., 1987,6, 253–415.
62 C. C. Chusuei, X. Lai, K. Luo and D. W. Goodman, Top.
Catal., 2000,14, 71–83.
63 P. Torelli, L. Giordano, S. Benedetti, P. Luches, E. Annese, S. Valeri and G. Pacchioni, J. Phys. Chem. C, 2009, 113, 19957–19965.
64 J. Kiss, P. Pusztai, L. O´va´ri, K. Baa´n, G. Merza, A. Erdohelyi,+ A. Kukovecz and Z. Ko´nya,e-J. Surf. Sci. Nanotechnol., 2014, 12, 252–258.
65 X. Lin, B. Yang, H.-M. Benia, P. Myrach, M. Yulikov, A. Aumer, M. A. Brown, M. Sterrer, O. Bondarchuk, E. Kieseritzky, J. Rocker, T. Risse, H.-J. Gao, N. Nilius and H.-J. Freund,J. Am. Chem. Soc., 2010,132, 7745–7749.
66 L. O´va´ri and J. Kiss,Appl. Surf. Sci., 2006,252, 8624–8629.
67 E. Lira, J. Ø. Hansen, L. R. Merte, P. T. Sprunger, Z. Li, F. Besenbacher and S. Wendt,Top. Catal., 2013,56, 1460–1476.
68 Y. Kitsudo, A. Iwamoto, H. Matsumoto, K. Mitsuhara, T. Nishimura, M. Takizawa, T. Akita, Y. Maeda and Y. Kido, Surf. Sci., 2009,603, 2108–2114.
69 F. Mu¨ller, S. Hu¨fner and H. Sachdev,Surf. Sci., 2009,603, 425–432.
70 S. Tanuma, C. J. Powell and D. R. Penn,Surf. Interface Anal., 1994,21, 165–176.
71 L. O´va´ri, L. Bugyi, Z. Majzik, A. Berko´ and J. Kiss,J. Phys.
Chem. C, 2008,112, 18011–18016.
72 L. O´va´ri, A. Berko´, N. Bala´zs, Z. Majzik and J. Kiss,Langmuir, 2010,26, 2167–2175.
73 Z. Konuspayeva, P. Afanasiev, T.-S. Nguyen, L. Di Felice, F. Morfin, N.-T. Nguyen, J. Nelayah, C. Ricolleau, Z. Y. Li, J. Yuan, G. Berhault and L. Piccolo,Phys. Chem. Chem. Phys., 2015,17, 28112–28120.
74 L. Piccolo, Z. Y. Li, I. Demiroglu, F. Moyon, Z. Konuspayeva, G. Berhault, P. Afanasiev, W. Lefebvre, J. Yuan and R. L. Johnston,Sci. Rep., 2016,6, 35226.
75 P.-W. Hsu, Z.-H. Liao, T.-C. Hung, H. Lee, Y.-C. Wu, Y.-L. Lai, Y.-J. Hsu, Y. Lin, J.-H. Wang and M.-F. Luo,Phys.
Chem. Chem. Phys., 2017,19, 14566–14579.
76 A. P. Farkas, P. To¨ro¨k, F. Solymosi, J. Kiss and Z. Ko´nya, Appl. Surf. Sci., 2015,354, 367–372.
77 A. T. N’Diaye, T. Gerber, C. Busse, J. Myslivecˇek, J. Coraux and T. Michely,New J. Phys., 2009,11, 103045.
78 D. Franz, S. Runte, C. Busse, S. Schumacher, T. Gerber, T. Michely, M. Mantilla, V. Kilic, J. Zegenhagen and A. Stierle,Phys. Rev. Lett., 2013,110, 65503.
79 S. Billinge,Nature, 2013,495, 453–454.
80 C. Papp,Catal. Lett., 2017,147, 2–19.
81 K. Gotterbarm, F. Spa¨th, U. Bauer, C. Bronnbauer, H.-P.
Steinru¨ck and C. Papp,ACS Catal., 2015,5, 2397–2403.
82 T. Brugger, H. Ma, M. Iannuzzi, S. Berner, A. Winkler, J. Hutter, J. Osterwalder and T. Greber,Angew. Chem., Int.
Ed., 2010,49, 6120–6124.
83 S. F. L. Mertens, A. Hemmi, S. Muff, O. Gro¨ning, S. De Feyter, J. Osterwalder and T. Greber,Nature, 2016,534, 676–679.
Published on 08 May 2018. Downloaded by UNIVERSITY OF SZEGED on 11/06/2018 10:25:49.