Au
–Rh Surface Structures on Rh(111): DFT–Insights to the Formation of an Ordered Surface Alloy
Krisztián Palotás
1,2,3,*, László Óvári
2,4, Gábor Vári
5, Richárd Gubó
4,5, Arnold P. Farkas
2,4, János Kiss
2, András Berkó
2, Zoltán Kónya
2,51 Department of Complex Physical Systems, Institute of Physics, Slovak Academy of Sciences, Dúbravská cesta 9., SK-84511 Bratislava, Slovakia
2 MTA-SZTE Reaction Kinetics and Surface Chemistry Research Group, University of Szeged, Rerrich B. tér 1., H-6720 Szeged, Hungary
3 Department of Theoretical Physics, Budapest University of Technology and Economics, Budafoki út 8., H-1111 Budapest, Hungary
4 ELI-ALPS, ELI-HU Nonprofit Ltd, Dugonics tér 13., H-6720 Szeged, Hungary
5 Department of Applied and Environmental Chemistry, University of Szeged, Rerrich B. tér 1., H-6720 Szeged, Hungary
* Corresponding author: K. Palotás (palotas@phy.bme.hu)
Abstract
Surface alloying is an important technique to change their chemical properties. In this study, by employing density functional theory (DFT) calculations, the atomic arrangements and energetics of an extensive set of Au–Rh structures in a confined (2×1) surface cell on a Rh(111) substrate are investigated.
An ordered surface alloy layer composed of 50% Au and 50% Rh is identified as the energetically favored structure, which corresponds to a configuration proposed previously based on scanning tunneling microscopy (STM) imaging [Óvári et al. PCCP, 2016, 18, 25230]. Comparing this surface alloy with another candidate structure in terms of Rh and Au adsorption characteristics, the bonding preference among Rh and Au species is recovered. DFT-based simulated STM images reveal bias-voltage-dependent contrast differences among selected corrugated surface layer structures at various Au coverages. Furthermore, several new experimental results obtained by STM and low energy ion scattering (LEIS) on the thermally induced formation of the ordered Au–Rh surface alloy are also presented in this work. Our calculation approach and results are expected to contribute to the understanding of the formation of metallic surface alloys of various chemical compositions.
1. Introduction
Alloying is a highly important and special method to tune the chemical properties of metal surfaces and nanoparticles. A very recent example points out substantial changes in the morphology of a single layer hexagonal boron nitride upon alloying its rhodium support by gold1. The composition and structure of the outermost atomic layer in bimetallic systems are often substantially different from the bulk. It was demonstrated in numerous cases that even bulk immiscible metals can form surface alloys like Au with Ni,2-6 Ag with Cu,7-9 as well as Au with Fe.10,11
According to literature data, Au and Rh are also practically immiscible in bulk: the dissolution of Rh in Au, and that of Au in Rh is very limited, below 1% in the temperature range of 300–1200 K.12 The combination of these metals proved to be beneficial in visible-light-induced hydrogen generation from water,13,14 in the electrochemical oxygen evolution reaction,15 in selective hydrogenation of cinnamaldehyde,16 as well as in the hydroconversion of tetralin.17 The mixing and segregation properties of these metals restricted to the nanoscale were previously studied in detail.18-29 In a number of studies Au and Rh were sequentially evaporated by physical vapor deposition (PVD) on oxide single crystalline surfaces.18,19,21,22,28,29 When first Au nanoparticles were prepared on a rutile TiO2(110) surface followed by evaporation of Rh, an efficient place exchange already occurred at room temperature, leading to the incorporation a great part of Rh atoms into the subsurface of Au clusters, while the outermost layer still mostly consisted of gold.18 The driving force for this process is the smaller surface energy of Au compared to that of Rh (1.283 J/m2 for Au(111) and 2.472 J/m2 for Rh(111)).30 When the deposition order was reversed, Au atoms landing on the TiO2(110) surface were efficiently collected by the pre-formed Rh nanoparticles due to the larger diffusion length of Au. The surface of Rh clusters was easily covered by Au forming this way (Rh core)–(Au shell) particles, although not necessarily with an atomically sharp
interface.19 A similar behavior was revealed for Au and Rh on Al2O3/NiAl(100).28,29 Au–Rh bimetallic nanoparticles were also prepared by applying wet chemical methods, in some cases combined with reductive or oxidative gas treatments to obtain catalysts. These investigations revealed a clear tendency for phase separation in accordance with the bulk immiscibility of these metals. However, kinetic limitations (especially at room temperature) and the contact with gases can also play a significant role.
Consequently, the types of structures formed were manifold: alloyed, core–shell, Janus–like, “ball–cup”
bimetallic and separated monometallic nanoparticles.24-26 Among these configurations, the (Rh core)–(Au shell) structure is the most stable one, when no support and gas atmosphere are present, as indicated by density functional theory (DFT) calculations. The comparison was made by using a mixing energy term.
The Rh “ball” Au “cup” and the Janus structures were slightly less stable, while the alloyed, Au “ball” Rh
“cup” and (Au core)–(Rh shell) structures were clearly energetically disfavored. The contact with a TiO2
support changes this order, favoring the Rh “ball” Au “cup” configuration, because the interaction of Rh with TiO2 is stronger than that of Au.26
The complex behavior observed for Au–Rh clusters could be better understood by characterizing the alloying/segregation phenomena on well-defined surfaces. While computational analysis of the interaction of Au with Rh(111) is the subject of the present paper as a continuation of our recent experimental studies,21,31 other relevant surfaces were addressed in previous works.24,28,32-34 Scanning tunneling microscopy (STM) and Auger electron spectroscopy (AES) investigations showed that Rh forms three dimensional (3D) islands on Au(111) at room temperature according to Volmer–Weber growth.
Annealing to 673 K induced the immersion or encapsulation of Rh islands in the topmost atomic layer of the substrate, and the removed Au atoms covered the Rh islands.32 This behavior is basically in agreement with the bulk immiscibility and the lower surface energy of Au, but still implies some mixing.
Deposition of Rh on Au(111) at a substrate temperature of 30 K was accompanied by site exchange
activated by the adsorption heat, leading to alloying of isolated Rh atoms into the topmost gold atomic layer and the formation of alloyed Au–Rh adparticles nearby.33 DFT calculations indicated that the adsorption energy of isolated Rh atoms on Rh(100) and Au(100) is -5.3 eV and -4.3 eV, respectively, while the adsorption energy of Au on Rh(100) and Au(100) is -3.3 eV, and -2.9 eV, respectively.28 This comparison suggests that the binding energy follows the order Rh–Rh > Rh–Au > Au–Au. The segregation energy of a Rh atom from Au(100) was calculated to be positive, while that of a Au atom from Rh(100) is negative, indicating that Rh atoms prefer the location at the subsurface whereas the Au atoms at the surface layers.28 When a small Rh platelet of 13 atoms was placed on Au(100), DFT structure optimization indicated the distortion and buckling of substrate Au atoms, as well as the shrink and partial immersion of the Rh platelet into the topmost gold plane.28 Molecular dynamics simulations at 300 K showed aggregation and sinking Rh atoms into Au(100).28 Other molecular dynamics simulations of Rh growth on Au(111) and Au(100) indicated the formation of 3D rhodium particles on gold up to 500 K without interfacial mixing. When Au adatoms were also added to the simulation at 500 K, their stabilization at the perimeter/on top of Rh clusters were shown.24,34 DFT calculations and molecular dynamics simulations indicated no significant distortion of the Rh(100) substrate atoms, when a small Au platelet consisting of 13 atoms was placed on top forming an ordered adlayer.28
Christensen et al. calculated the first and second derivatives of the surface energy as a function of impurity (added metal) surface molar fraction in the zero-concentration limit, i.e. the initial slope and curvature of the surface energy curves, for all transition- and noble-metal combinations for close-packed surfaces.35 In this linear muffin-tin orbitals (LMTO) calculation using the coherent potential approximation (CPA), pseudomorphic growth was assumed. The first derivative gives the segregation energy, while the second derivative determines whether the two metals will mix in the topmost surface layer or not: If the curvature is positive there will be mixing, but if it is negative the two metals will not
mix in the surface. The results clearly predicted mixing for Au on Ni(111) and for Ag on Cu(111), in accordance with experimental results. For Au on Rh(111) the value for the second derivative is close to zero (0.02 eV/atom). The same authors concluded that relaxation, not included in the LMTO-CPA calculation, leads to a slight increase in the second derivative, suggesting a small energetic driving force for mixing. Moreover, the small entropy gain due to mixing would also point toward the formation of a Au–Rh surface alloy.
From these results it is clear that for the bimetallic Au–Rh system the energetics suggest a competition between the surface covered by gold atoms and certain Au–Rh mixing in the surface layers. Mixing is expected to be inherently enhanced if Rh is deposited on Au. Consequently, the thermodynamic tendency for a possible surface alloy formation can easier be investigated if Au is dosed on Rh. In our previous study31 we characterized the growth and alloying of Au on Rh(111) applying STM, low energy ion scattering spectroscopy (LEIS) and X-ray photoelectron spectroscopy (XPS). It was revealed that the growth mode is two-dimensional at a substrate temperature of 500 K up to a gold coverage of Au=0.5 ML. At higher doses the second layer also started to build, slightly deviating from layer-by-layer growth due to kinetic reasons. STM measurements demonstrated the formation of both random and 2×1 nano- range ordered surface alloys at T≥600 K, and two proposals for the atomic arrangements of the observed 2×1 periodicity were reported31: (i) an ordered p(2×1) surface alloy forming alternate rows of Au and Rh in the surface layer, which is denoted by 2x1 structure in the following, and (ii) rows of Au adatoms in FCC-hollow-Rh positions above the Rh substrate, which is denoted by 2x1_Au structure throughout the paper. These latter findings clearly show that beside the viewpont of energetics, there is also another interesting aspect of this system. The issue is, what is the driving force of the ordering of the surface alloy phases and how frequent is this tendency by looking at the different material systems? Naturally, to the formation of an energetically more stable ordered (instead of a random) phase, it needs the
activation of atomic scale diffusion and exchange processes (kinetic factor)6,7,9,11,35-37. Murdoch et al.
reported a surface alloy ordering in the case of epitaxial growth of Co on Pd(111) and the formation of Co(50%)Pd(50%) surface alloy of p(2×1) registry.36 They detected quite similar STM images at around 600 K annealing as was described for the Au/Rh(111) system in the temperature range of 650-1050K.31 For both cases there are characteristic morphological properties: (i) laterally limited p(2×1) ordered domains of 3-4 nm separated by disordered regions; (ii) 50-50% mixture of the constituting two metals; (iii) confined temperature range and composition of the constituent metals where the ordered phase is detected. The differences in the thermal properties of the two systems mainly originate from the fact that the metal with a lower surface energy is the substrate, as for Co/Pd(111), or it is the admetal, as for Au/Rh(111). Nevertheless, it is clear from the two examples here that quite different immiscible metal- pairs can produce ordered surface alloy domain arrangements with a limited lateral extension.
The scope of the present work is to disclose the energetics underlying the surface alloy formation using DFT. In particular, total energies of an extensive set of relaxed Au–Rh surface structures in a fixed 2×1 periodicity placed on a Rh(111) substrate are compared. Furthermore, the differences of the experimentally proposed31 2x1 (ordered surface alloy) and 2x1_Au (added Au-row) structures are studied in terms of atomic charges, electron work function, and Rh (or Au) adatom adsorption. Based on the DFT results bias-voltage-dependent STM images are calculated for a set of selected corrugated surface layer structures with various Au coverages. Additionally, new experimental results completing our previous work31 are reported on the morphologic characteristics of thermally induced formation of ordered Au–Rh surface alloy.
2. Methods
2.1. Computational details
Twenty-one Au–Rh surface structures in six different compositions were constructed on a Rh(111) substrate, and the lateral dimensions of the supercell were confined to the (2×1) surface cell, which corresponds to the experimentally observed surface reconstruction31. The surfaces were modeled as slabs consisting of three atomic Rh layers, which were fixed at their bulk positions with the in-plane experimental lattice constant of a2D = 2.689 Å, and further layers which were fully relaxed: (i) an additional Rh layer, and (ii) three Au–Rh layers in different compositions to model the surface alloys. A separating vacuum region of minimum 15.4 Å width in the surface normal direction has been used to minimize slab–slab interaction. The outermost three layers can, in principle, be of five types: X ϵ {full_Rh (2,0), full_Au (0,2), 2x1 (1,1), Rh_row (1,0), and Au_row (0,1)}, where the numbers in parentheses correspond to the chemical composition of that particular layer: (nRh,nAu) with nRh and nAu the number of Rh and Au atoms, respectively. Since the "row" structures can be at the surface layer only, altogether, there are 43 combinations of these 5 layer types in 3 layers that contain at least 1 gold atom (3 ×3×5- 2=43). From this set we selected 15 combinations, following earlier indications of the preferred Rh–Au arrangement at surfaces28, and performed geometry optimizations and total energy calculations employing the Vienna Ab–initio Simulation Package (VASP)38,39, see the next paragraph for more details.
The final number of the reported 21 structures result from different stackings considered either for the 2x1/2x1 layer arrangements, or for some "row" structures at the surface layer with respect to the subsurface layer. The total numbers of Rh (NRh) and Au (NAu) atoms in the supercell for the 21 structures are reported in Table 1.
Geometry optimizations of the Au–Rh surfaces were performed using the conjugate gradient method within the generalized gradient approximation (GGA) of DFT implemented in VASP. The exchange–
correlation functional was parametrized by Perdew, Burke and Ernzerhof (PBE).40 A plane–wave basis set for electronic wave function expansion with an energy cut-off of 230 eV and the projector augmented
wave (PAW) method41 for the description of electron–ion interactions were applied. The effect of the energy cut-off on a selected set of relative total energies is reported in the Supporting Information (Table S1). After k-convergence tests, an 11×21×1 Monkhorst–Pack42 k–point grid was selected, which corresponds to a dense sampling of the Brillouin zone of the (2×1) surface cell. The criterion of converged relaxation for the residual force acting on each ion was 0.02 eV/Å.
The total energies of the relaxed twenty-one Au–Rh surfaces are compared with each other to identify the energetic order between them and the energetically preferred structure. From the set of atomic configurations the two experimentally proposed ones (2x1 and 2x1_Au)31 are selected for further analysis. First, their structural properties are reported in detail, and their atomic Bader charges43-45 at the surface and electron work functions are compared. Second, adsorption energetics of Rh and Au adatoms are investigated at different adsorption positions. Third, high-resolution STM simulations are carried out to reveal bias-voltage-dependent STM contrast differences between these surfaces and other selected corrugated surface layer structures at different Au coverages. The BSKAN-implementation46,47 of the revised Chen method48 with a spherical tip orbital is used, which is equivalent to the Tersoff–Hamann model of electron tunneling.49,50
2.2. Experimental methods
Low energy ion scattering (LEIS) measurements were performed applying He+ ions of 800 eV kinetic energy produced by a SPECS IQE 12/38 ion source. The incident and detection angles were 50° off normal, and the scattering angle was 95°. LEIS spectra were collected by a Leybold Heraeus hemispherical analyzer. For the STM investigations a WA-Technology instrument built in an ultra-high vacuum (UHV) chamber was used, where home-prepared tungsten tips were applied for the studies at room temperature. STM images were recorded at constant current (cc) or constant height (ch) modes.
High-purity (99.95%) Au was deposited by an e-beam evaporator (Oxford Applied Research) onto a Rh(111) single crystal polished, oriented and prepared by MATECK Ltd. An Ar+ ion gun served for cleaning the probe installed in a heatable and transportable cartridge. Further experimental details can be found in Ref. 31.
3. Results and discussion
3.1. Morphological characterization of the appearance of an ordered Au–Rh alloy phase
Before the presentation of the results obtained by DFT calculations, first a few experimental STM images are shown in order to visualize the main morphological features of the ordered and the unordered Au–
Rh surface alloy phases formed by deposition of Au on a Rh(111) surface at close to room temperature and annealing at higher temperatures. In our previous works21,31, we have already reported on the formation of a (2×1) ordered Au–Rh surface alloy phase. Recently, a more precise characterization of its structure and appearance conditions were studied, and two important questions arised during these Figure 1. (A, B, C) STM cc-images taken on a Rh(111) surface deposited by 0.75 ML gold at 400 K
followed by annealing at 1000 K in UHV. (D) High-resolution ch-image recorded on the bright stripes presented in (B). Image sizes: (A) 200 × 200 nm2; (B, C) 40 × 20 nm2; (D) 10 × 10 nm2.
investigations: what is the optimal Au coverage, and what is the optimal temperature of the thermal treatment, where the ordered phase formation is the most probable? Concerning the optimal gold coverage, it seems to be experimentally proved that below 0.4–0.5 ML Au coverage there is no indication for any ordered phase, however, in the coverage range of 0.5–1.0 ML it was detected with a high efficiency. The lower coverage limit of the formation is certainly connected to an insufficient local concentration of gold leading to an extended range of an ordered (2×1) phase and to the fact that the thermally induced surface incorporation of Au is laterally rather uniform. It is also obvious that for Au coverages above 1 ML the surplus gold prevents the STM detection of the ordered phase formed immediately at the Rh-Au interface. It was a convincing experience that 0.8 (±0.1) ML is the most appropriate Au coverage where the (2×1) phase is detectable after deposition at 400–500 K followed by annealing at 1000 K in UHV. Concerning the optimal temperature, although the ordered phase was detected between 700 K and 1100 K, the highest formation probability was achieved at around 1000 K annealing (keeping the Au coverage in the range of 0.6–1.0 ML). The STM images in Figure 1 show the characteristic morphology indicating the presence of an ordered surface alloy. In this case 0.75 ML gold was deposited on a clean Rh(111) surface at 400 K, and the sample was annealed at 1000 K for 5 min. In Fig. 1A it can be seen that the full region is uniformly covered by bright stripes with an average height of 0.09 (±0.02) nm and width of 3–4 nm. The low height contrast of the stripes surely excludes that it would belong to an alternate (up and down) atomic step structure, where the step height should be above 0.2 nm. As can be seen, the bright stripes run parallel or form complicated 2D foam structure, as it is discernible in Figs. 1B and 1C, respectively. Note that all images in Figs. 1A-C were recorded in constant- current (cc) mode of STM. In order to observe the (2×1) phase detectable only on the bright stripes, we had to switch to constant-height (ch) STM mode. The high-resolution ch-image is seen in Fig. 1D. The overall feature of this ordered phase is the appearance of small ordered domains of less than 3×3 nm2
regions, where the distance of the parallel rows inside the ordered regions is 0.47 nm corresponding to the double atomic row distance of the close-packed Rh(111) surface (~0.2689×√3 nm). These results reveal that there is a bimodal structure formation on two different lateral scales and shapes: (1) 2 ×1 ordered domains of 3×3 nm2 embedded in an unordered phase; (2) elongated stripes of 3–4 nm width containing the 2×1 ordered domains and separated by surface regions where no ordering can be found.
A possible explanation for the bimodality is given by a schematic model of the alloy formation described as follows.
Let us assume for the time being that the alternating Au and Rh atomic row structure forms flat atomic terraces within the (2×1) ordered domains31. Moreover, we have to take into account that the LEIS measurements performed for the Au coverages between Au=0.2 and Au=0.9 ML exhibit a rather constant intensity (even an indication for a slight increase) of the LEIS signal of Au during the annealing between 500 K and 1000 K (see section 3.3). These statements suggest that, in principle, the optimal Au coverage should be at around
Au=0.5 ML as indicated in Figs. 2A–C. In this schematic model it is also taken into account that in order to preserve the original number of the surface Rh atoms, a second terrace should be formed (terrace splitting, Fig. 2C). Unfortunately, this model is difficult to jugde experimentally because of the statistical distribution of the terraces, however, this construction assures that the visibility of the surplus
Figure 2. Schemes for (A, B, C) 0.5 ML and (D) 0.75 ML additive gold forming surface alloy on a Rh(111) surface.
gold is approximately constant during the thermal treatments. At higher Au coverages, gold gradually fills up the lower terraces in the range of Au=0.5–1 ML forming different regions: a more ordered region (left side) and a more Au-rich unordered region (right side) in Fig. 2D.
The 2×1 ordered structure found in our case is quite similar to the L10 phase of CuAu type structures which was also identified for CoPt, FePt, FePd and CoPd systems by STM and LEED methods36. In these latter cases, however, the ordered phase was also extended to the bulk region, so it was not restricted to the surface layer as we assumed in the above schematic model for the Au–Rh system.
3.2. DFT calculations of different Au–Rh surface structures
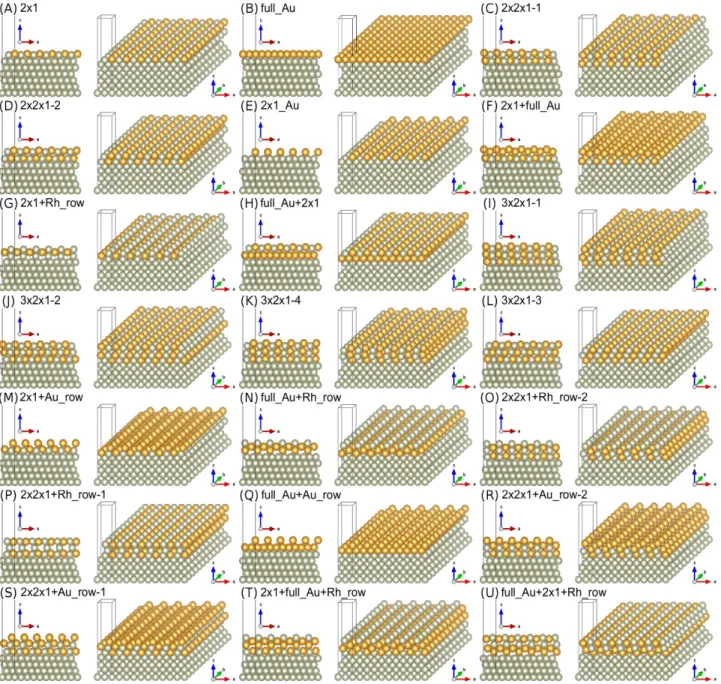
As a main result of the present paper, total energies of an extensive set of relaxed Au–Rh surface structures in a confined 2×1 periodicity placed on a Rh(111) substrate are compared in order to identify energetically favored structures and to understand the bonding order preference among Rh and Au species. The optimized atomic arrangements of twenty-one Au–Rh surfaces are shown in Figure 3, each from two different directions of view. The images show 12×12 atoms in the surface planes together with the supercell used in the calculations, which corresponds to a (2×1) surface cell and a vacuum region above the metallic slab. The labels of the structures correspond to their initial layer-wise configuration, i.e., before performing the geometry optimization. We find that most of the atomic structures preserve their initial layer-wise arrangement (e.g., full_Au, 2x1_Au, full_Au+Au_row), and some of them become slightly corrugated either in the surface layer or in subsurface layers: 2x1, 2x2x1, 3x2x1, 2x1+full_Au, full_Au+2x1, 2x1+Au_row, 2x2x1+Rh_row-2, 2x2x1+Au_row. Another set of surface structures are considerably rearranged: 2x1+Rh_row, full_Au+Rh_row, 2x2x1+Rh_row-1, 2x1+full_Au+Rh_row, full_Au+2x1+Rh_row. Note that the structures labeled by 2x1 and 2x1_Au respectively correspond to the experimentally suggested surface alloy structures shown in Figs. 7(d) and 7(f) in Ref. 30, and they can be
represented by the following stackings of the topmost three layers, 2x1: full_Rh/full_Rh/2x1; 2x1_Au:
full_Rh/full_Rh/Au_row.
Figure 3. Optimized atomic geometries of the considered 21 Au–Rh surface structures by DFT. Gray and yellow colors of the atoms correspond to Rh and Au, respectively.
Table 1. Calculated total energies E(NRh,NAu) of 21 Au–Rh surface structures, and energetic differences
E(NRh,NAu) = E(NRh,NAu) – EMIN(NRh,NAu) of the total energies within the same chemical compositions (NRh,NAu) in the considered supercell, see text for details.
To understand these observations, the energetics of the Au–Rh surfaces are analyzed. Table 1 shows calculated total energies E(NRh,NAu) and energetic differences E(NRh,NAu) = E(NRh,NAu) – EMIN(NRh,NAu) within the same chemical compositions (NRh,NAu) in the considered supercell. The data in Table 1 are grouped according to the (NRh,NAu) compositions. We find that the structures labeled by 2x1 (Fig. 3A), full_Au (Fig. 3B), 2x1_Au (Fig. 3E), 2x1+full_Au (Fig. 3F), 2x1+Au_row (Fig. 3M), full_Au+Au_row (Fig. 3Q) are the energetically favored ones for the different chemical compositions (NRh,NAu) in the supercell, (13,1), (12,2), (12,1), (11,3), (11,2), (10,3), respectively, where E(NRh,NAu) = 0, and the corresponding lines are highlighted by using bold characters in Table 1. The energetic order obtained by the calculations for the different (N ,N ) compositions is evaluated in the following points:
Structure in Fig. 3
(A) 2x1 13 1 -94.680 0
(B) full_Au 12 2 -90.925 0
(C) 2x2x1-1 12 2 -90.239 0.686
(D) 2x2x1-2 12 2 -90.097 0.828
(E) 2x1_Au 12 1 -87.321 0
(G) 2x1+Rh_row 12 1 -86.207 1.114
(F) 2x1+full_Au 11 3 -86.713 0
(H) full_Au+2x1 11 3 -85.984 0.729
(I) 3x2x1-1 11 3 -85.722 0.991
(J) 3x2x1-2 11 3 -85.603 1.110
(K) 3x2x1-4 11 3 -85.591 1.122
(L) 3x2x1-3 11 3 -85.493 1.220
(M) 2x1+Au_row 11 2 -83.169 0
(N) full_Au+Rh_row 11 2 -82.053 1.116
(O) 2x2x1+Rh_row-2 11 2 -81.889 1.280
(P) 2x2x1+Rh_row-1 11 2 -81.801 1.368
(Q) full_Au+Au_row 10 3 -79.143 0
(R) 2x2x1+Au_row-2 10 3 -79.025 0.118
(S) 2x2x1+Au_row-1 10 3 -78.567 0.576
(T) 2x1+full_Au+Rh_row 10 3 -78.058 1.085
(U) full_Au+2x1+Rh_row 10 3 -77.847 1.296
NRh NAu E(NRh,NAu) (eV) DE(NRh,NAu)(eV)
(1) Since the (13,1) composition is represented by the 2×1 ordered surface alloy only, no comparison with other structures with the same chemical composition can be made. However, we expect that the selected full_Rh/full_Rh/2x1 stacking in the top three layers is preferred compared to other cases when the ordered alloy (2x1) is located in a subsurface layer.
(2) For the (12,2) composition, the 1 ML Au-covered Rh(111) (full_Au) is favored compared to the ordered surface alloys in the top two surface layers (2x2x1-1 and 2x2x1-2). Note that while the surface layer of the full_Au structure is atomically flat (Fig. 3B), those of the 2x2x1 structures (Figs. 3C&D) are slightly corrugated.
(3) For the (12,1) composition, a gold row on the Rh substrate (2x1_Au structure) is favored compared to the 2x1+Rh_row configuration, where a Rh row is placed on the ordered alloy layer.
(4) For the (11,3) composition, the 1 ML Au-covered ordered surface alloy (2x1+full_Au) is favored compared to the interchange of these layers, where the full Au layer is in direct contact with the Rh(111) substrate and the ordered 2x1 alloy is on top (full_Au+2x1). Moreover, both of these structures have lower total energy than the ordered surface alloys in the top three surface layers (3x2x1-1, 3x2x1-2, 3x2x1-3 and 3x2x1-4).
(5) For the (11,2) composition, a gold row on an ordered alloy layer (2x1+Au_row) is energetically preferred, followed by a Rh row placed on a monolayer of gold (full_Au+Rh_row) and two stackings of a Rh row on two layers of the ordered Au–Rh 2x1 alloy (2x2x1+Rh_row-2 and 2x2x1+Rh_row-1).
(6) For the (10,3) composition, a gold row on a monolayer of gold (full_Au+Au_row) is favored. This is followed by two stackings of a Au row on two layers of the ordered alloy (2x2x1+Au_row-2 and 2x2x1+Au_row-1). The energetically least favored configurations are Rh rows either on an ordered
alloy/Au layer stacking (2x1+full_Au+Rh_row), or on the reversed stacking (full_Au+2x1+Rh_row), where the latter structure has the highest total energy in the (10,3) composition.
By a closer inspection of the relaxed atomic structures in Fig. 3, one can observe that in all of the above- described cases the Rh and Au clearly prefer phase separation forming surface Au and subsurface Rh structures. Whenever it is not possible, due to space filling (metal-metal bonds are still preferred compared to empty regions in the subsurface layers), ordered alloy layers are formed. The Rh_row structures show the largest reconstructions after geometry optimization. The tendency can be observed that the Rh-Rh bonding is preferred (see 2x1+Rh_row (Fig. 3G) and 2x2x1+Rh_row-2 (Fig. 3O)), followed by Au-Rh bonding (see full_Au+Rh_row (Fig. 3N) and 2x1+full_Au+Rh_row (Fig. 3T)). For the 2x2x1+Rh_row-1 (Fig. 3P) and full_Au+2x1+Rh_row (Fig. 3U) relaxed configurations the vertical position of the Rh row considerably shrinks and the surface layer resembles the 2×1 ordered alloy, where the Rh atoms slightly protrude out of the surface. This is opposite to the single ordered surface alloy layer (2x1), where the Au is protruded outwards the surface layer, and not the Rh. However, the 2x2x1+Rh_row-1 (Fig. 3P) and full_Au+2x1+Rh_row (Fig. 3U) structures are clearly the energetically disfavored ones within their corresponding chemical compositions. This is due to the considerable amount of empty regions in the subsurface layers, as seen toward the lattice vector b-direction in Fig. 3. All findings described in this paragraph are in line with a recent DFT study that reports preference for Au-covered Rh nanoclusters, and a binding energy order of Rh–Rh > Rh–Au > Au–Au.28
Next, the total energies of the investigated twenty-one Au–Rh surfaces are directly compared with each other to identify the energetic order between them and the energetically preferred structure. Due to the different chemical compositions, the calculated total energies need to be transformed in the supercell, which is the same in all considered cases. For this reason, the following method is employed. Given a (N ,N ) composition in the supercell, the calculated total energy is denoted by E(N ,N ), as reported in
Table 1. Two new structures can be constructed within the same supercell, where either a Rh or a Au atom is placed in the middle vertical position of the vacuum layer, resulting in (NRh+1,NAu) and (NRh,NAu+1) compositions that respectively correspond to Rh and Au rows, due to the (2×1) surface cell. These added atomic rows are at least 7.7 Å far from both the fixed bulk Rh(111) side and the surface alloy side, and the optimized surface structures obtained for the (NRh,NAu) composition were not modified, only the total energies were recalculated at (NRh+1,NAu) and (NRh,NAu+1) compositions. This way the obtained total energies E(NRh+1,NAu) and E(NRh,NAu+1) are shifted with respect to E(NRh,NAu) by constant values of ERh and EAu, respectively:
E(NRh+1,NAu) = E(NRh,NAu) – ERh and E(NRh,NAu+1) = E(NRh,NAu) – EAu (1) This hypothesis was tested for all 21 surface structures, and it was found that ERh = 3.389 ± 0.002 eV and EAu = 1.821 ± 0.002 eV are indeed constants, and except a very small error bar of ±0.002 eV they do not depend on the original composition (NRh,NAu). Therefore, the total energies of the 21 Au–Rh structures in 6 different compositions can be transformed to total energy values corresponding to the (13,3) composition, which should provide a direct comparison of the energetics of the considered atomic configurations:
ETR(13,3) = E(NRh,NAu) – (13 - NRh) × ERh – (3 - NAu) × EAu (2) Table 2 shows the energetic preference order of the 21 Au–Rh surfaces by a list of transformed ETR(13,3) total energies. We find that the order reported in Table 1 is preserved, except that the 2x1+full_Au and 2x1+Rh_row structures exchange order. The results indicate that more Rh atoms and, thus, the formation of more Rh–Rh bonds in the system are energetically preferred. For a fixed NRh, more Au atoms in the system also lower the total energy. These findings are in line with a recent DFT study28 that reports a binding energy order preference of Rh–Rh > Rh–Au > Au–Au that is the main driving force for
the surface alloy formation. The energetically favored structure is the ordered surface alloy layer (2x1), which was also proposed as a likely candidate based on experimental STM images.31 Energy differences with respect to the minimum value of the 2x1 structure, ETR(13,3), can reach up to 10.3 eV per supercell. Even larger differences are expected in other Au–Rh surface structures, where the second layer below the surface layer consists of Au only (full_Au/X/X stacking in the topmost three layers), and therefore they were initially excluded from the present study. The validity of the total energy transformation (TR) method is discussed in more detail in the Supporting Information (Table S2).
Table 2. Transformed total energies ETR(13,3) = ETR(NRh=13,NAu=3) (see Eq. (2)) of 21 Au–Rh surface structures in the considered supercell, and their energetic preference order with ETR(13,3) = ETR(13,3) – ETR,MIN(13,3) explicitly reported.
Structure in Fig. 3
(A) 2x1 13 1 -98.322 0
(B) full_Au 12 2 -96.135 2.187
(C) 2x2x1-1 12 2 -95.449 2.873
(D) 2x2x1-2 12 2 -95.307 3.015
(E) 2x1_Au 12 1 -94.351 3.971
(F) 2x1+full_Au 11 3 -93.491 4.831
(G) 2x1+Rh_row 12 1 -93.239 5.083
(H) full_Au+2x1 11 3 -92.762 5.560
(I) 3x2x1-1 11 3 -92.500 5.822
(J) 3x2x1-2 11 3 -92.381 5.941
(K) 3x2x1-4 11 3 -92.369 5.953
(L) 3x2x1-3 11 3 -92.271 6.051
(M) 2x1+Au_row 11 2 -91.767 6.555
(N) full_Au+Rh_row 11 2 -90.652 7.670
(O) 2x2x1+Rh_row-2 11 2 -90.489 7.833
(P) 2x2x1+Rh_row-1 11 2 -90.400 7.922
(Q) full_Au+Au_row 10 3 -89.310 9.012
(R) 2x2x1+Au_row-2 10 3 -89.192 9.130
(S) 2x2x1+Au_row-1 10 3 -88.734 9.588
(T) 2x1+full_Au+Rh_row 10 3 -88.225 10.097 (U) full_Au+2x1+Rh_row 10 3 -88.014 10.308
NRh NAu ETR(13,3) (eV) DETR(13,3) (eV)
In an experiment the amount of the ad-metal dosed on the substrate is typically controlled and known, and the task is to disentangle the energetically most stable structure for that given ad-metal quantity.
Therefore, it is worth to compare the considered structures classified according to their Au gold coverages (0.5 ML, 1 ML, and 1.5 ML). As mentioned above, the calculated total energies (Table 1) are not always directly comparable, because the numbers of metal atoms per supercell in the different structures are not the same. If structures of a given Au coverage are compared, then the number of Au atoms in the supercell is the same, which allows for a type of correction different from that explained in relation to Table 2. Here, it is described for the case of 2x1 and 2x1_Au, where Au=0.5 ML. The number of Rh atoms per supercell is 13 and 12, respectively. Consequently, an additional Rh atom has to be taken into account for the 2x1_Au structure. Since all atoms of the first few layers taking part of the surface structure are considered explicitly in the DFT calculation, the Rh atom missing in the 2x1_Au structure is Rh bulk-like. The energy contribution of a bulk atom to the total binding energy of the lattice can be represented by the cohesion energy, which is 5.75 eV/atom for Rh.51 Correcting the calculated total energies of Table 1 with the cohesion energy in order to “equalize” the number of Rh atoms leads to comparable quantities. For the case of 2x1_Au the corrected total energy is -87.321 eV – 5.75 eV = -93.071 eV, which is higher by 1.609 eV than the -94.680 eV total energy of 2x1 implying that the 2x1 structure is energetically preferred over 2x1_Au. Of course, only structures with the same Au coverage can be compared this way.
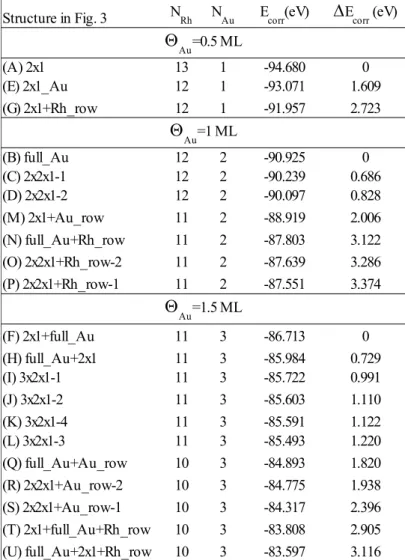
In Table 3 the corrected total energies, and their energetic preference order for each considered Au coverage are shown. The correction was made to reach the highest number of Rh atoms used in the structures of Fig. 3 for the given coverage (NRh=13 for Au=0.5 ML, NRh=12 for Au=1 ML, and NRh=11 for
Au=1.5 ML). Although the energy difference between the various structures is not the same as in Table 2, the energetic order does not depend on the type of correction used. The energetically most favored
structures are the 2x1 for Au=0.5 ML, full_Au for Au=1 ML, and 2x1+full_Au for Au=1.5 ML, keeping in mind that only structures obeying the 2×1 surface periodicity are considered.
Table 3. Total energies corrected with the cohesion energy of Rh for 21 Au–Rh surface structures classified according to the amount of Au, and their energetic preference order for each Au coverage Au
(see also text).
Structure in Fig. 3
(A) 2x1 13 1 -94.680 0
(E) 2x1_Au 12 1 -93.071 1.609
(G) 2x1+Rh_row 12 1 -91.957 2.723
(B) full_Au 12 2 -90.925 0
(C) 2x2x1-1 12 2 -90.239 0.686
(D) 2x2x1-2 12 2 -90.097 0.828
(M) 2x1+Au_row 11 2 -88.919 2.006
(N) full_Au+Rh_row 11 2 -87.803 3.122
(O) 2x2x1+Rh_row-2 11 2 -87.639 3.286
(P) 2x2x1+Rh_row-1 11 2 -87.551 3.374
(F) 2x1+full_Au 11 3 -86.713 0
(H) full_Au+2x1 11 3 -85.984 0.729
(I) 3x2x1-1 11 3 -85.722 0.991
(J) 3x2x1-2 11 3 -85.603 1.110
(K) 3x2x1-4 11 3 -85.591 1.122
(L) 3x2x1-3 11 3 -85.493 1.220
(Q) full_Au+Au_row 10 3 -84.893 1.820
(R) 2x2x1+Au_row-2 10 3 -84.775 1.938
(S) 2x2x1+Au_row-1 10 3 -84.317 2.396
(T) 2x1+full_Au+Rh_row 10 3 -83.808 2.905 (U) full_Au+2x1+Rh_row 10 3 -83.597 3.116
NRh NAu Ecorr(eV) Ecorr (eV)
Au=0.5 ML
Au=1 ML
Au=1.5 ML
3.3. Comparison of ordered surface alloy and added Au-row structures
The two experimentally proposed configurations31, the ordered surface alloy (2x1) and the added Au-row (2x1_Au) structures at Au=0.5 ML Au coverage are selected for a deeper analysis. We recall that the rows of Au adatoms are in FCC-hollow-Rh positions above the Rh substrate in the 2x1_Au configuration, thus the essential difference concerning atomic arrangements is the filled empty rows by Rh in the 2x1 compared to the 2x1_Au structure. Top views of the relaxed structures are shown in Figure 4. The layer relaxations of the subsurface Rh layers with respect to the bulk interlayer distance of Rh–Rh (2.196 Å) starting from the fixed three Rh(111) substrate layers are the following: +1.9% / +1.5% / +0.6% (2x1), -0.4% (2x1_Au). The atoms in the respective topmost surface layer show even larger structural rearrangements. For the 2x1 structure, the Rh–Rh layer-layer distance is 2.21 Å (+0.4%), whereas the Rh–
Au layer-layer distance is 2.54 Å (+15.7%). This corrugation of 0.33 Å of the surface layer is clearly visible in the 2x1 structure in Fig. 3A. For the 2x1_Au structure the Rh–Au layer-layer distance is 2.32 Å (+5.5%), resulting in the added Au rows on the Rh(111) substrate, see Fig. 3E. The two surface structures also exhibit slightly different Bader charges43-45 and electron work functions. The Bader charges of the Rh atoms in direct contact with Au atoms are in the range of 8.96–8.98 electrons (neutral Rh: 9), thus slightly positively charged, and the Au atoms are slightly negatively charged: 11.14 electrons (2x1), 11.10 electrons (2x1_Au), (neutral Au: 11). This means a partial electron transfer from Rh toward Au atoms.
Calculating the local electrostatic potential in the supercell, averaging over the (2×1) surface cell area, and taking into account the Fermi levels, the work functions are: 5.26 eV (2x1) and 5.10 eV (2x1_Au). As expected, the added Au-row (2x1_Au) configuration has a lower work function since the electrons can be easier removed from such an open-row structure than from a closer-packed 2x1 surface alloy layer.
Figure 4. Relaxed atomic arrangements and adatom adsorption positions denoted by numbers 1–12 on the experimentally proposed31 surface alloy structures 2x1 (Fig. 3A) and 2x1_Au (Fig. 3E). The adsorption energetics for Rh and Au adatoms on these two surfaces are reported in Tables 4 and S3.
To obtain more information on the preferred binding between the Rh and Au species, the adsorption of Rh and Au adatom rows on the 2x1 and 2x1_Au surface structures is investigated. Figure 4 shows the considered 12 sites for the adatom adsorptions for both surfaces. Placing the corresponding adatom above the indicated lateral positions into the vacuum, the top four surface layers were freely relaxed in all directions, and the adatom was relaxed perpendicular to the surface plane, confined to the lateral positions. This is a standard procedure to map potential energy landscapes of adatom adsorption above surfaces52,53, or modeling diffusion in other confined directions54,55. Following this, the total energies of the optimized adatom+surface configurations were calculated. Table 4 reports the obtained total energies relative to the corresponding minimum in the given column.
First, let us analyze the Rh adatom adsorption based on the results in Table 4. We find that adsorption position "3" is favored for the Rh adatom on both surfaces, which refers to on-top-Rh and to hollow-Rh in the case of 2x1 and 2x1_Au structures, respectively. These findings reflect the strong Rh–Rh binding in the 2x1, and the importance of space filling in the 2x1_Au case. On the 2x1 structure, the energetic
preference of the Rh adsorption sites follow the order: "3" (on-top-Rh), "9" (bridge-Rh), "8" and "2" (Rh- Au-bridge, energetically degenerate), "6" and "11" (Rh-Rh-Au-hollow, energetically degenerate), "5" and
"12" (Au-Au-Rh-hollow, energetically degenerate), "4" and "10" (Rh-Au-bridge, energetically degenerate), "7" (bridge-Au), and finally "1" (on-top-Au). On the 2x1_Au structure, the energetic preference of the Rh adsorption sites follow the order: "3" (hollow-Rh, or empty-sphere),
"2"-"4"-"8"-"10" (Au-empty-sphere-bridge, energetically degenerate), "6", "9", "11", "12", "7", "5", and
"1" (on-top-Au). For both surfaces the Rh adsorption on top of Au is the least favored energetically.
These findings confirm the binding energy order preference of Rh–Rh > Rh–Au reported in Ref. 28.
Let us now focus on the Au adatom adsorption based on the results in Table 4. We find that adsorption position "9" (bridge-Rh) is favored for the Au adatom on the 2x1 structure, which is clearly better than site "3" (on-top-Rh), previously found for the Rh adatom. On the 2x1 structure, the energetic preference of the Au adsorption sites follow the order: "9" (bridge-Rh), "6" and "11" (Rh-Rh-Au-hollow, energetically degenerate), "3" (on-top-Rh), "4" and "10" (Rh-Au-bridge, energetically degenerate), "12" and "5" (Au- Au-Rh-hollow, energetically degenerate), "7" (bridge-Au), and finally "1" (on-top-Au), "2" and "8" (Rh-Au- bridge, energetically degenerate). On the 2x1_Au structure, the energetic preference of the Au adsorption sites follow the order: "3" (hollow-Rh, or empty-sphere), "2"-"4"-"8"-"10" (Au-empty-sphere- bridge, energetically degenerate), "9", "6", "7", "12", "5", "11", and "1" (on-top-Au). For both surfaces the Au adsorption on top of Au is the least favored energetically. These findings reflect the preference of Au forming bonds with as much as possible Rh atoms in the 2x1, and the importance of space filling in the 2x1_Au case, and confirm the binding energy order preference of Au–Rh > Au–Au reported in Ref.
28. Combining the results for Rh and Au adatom adsorptions on the 2x1 and 2x1_Au surfaces, the overall tendency for the binding energy order preference of Rh–Rh > Rh–Au > Au–Au28 is reproduced. The total
energy results following an unconfined (free 3D) relaxation approach of the adatoms are given in the Supporting Information (Table S3), which do not affect our previous conclusion.
Table 4. Modeling adsorption of a Rh atom and a Au atom on Au–Rh surface alloys following a confined relaxation (see text): Total energies relative to the corresponding minimum (ERh and EAu) at specific adsorption positions (see Fig. 4) on the experimentally proposed31 surface alloy structures 2x1 (Fig. 3A) and 2x1_Au (Fig. 3E).
The DFT calculations in section 3.2 predict that for Au=0.5 ML the most stable arrangement is the 2x1, and Au atoms in this structure are slightly protruded outwards (by 0.33 Å). This is in harmony with LEIS results as described below. In our previous paper it was shown that the growth of Au on Rh(111) is strictly 2D up to Au~0.5 ML at a substrate temperature of 500 K, while there is a slight deviation from layer-by-layer growth at higher doses.31 Gold atoms form islands on Rh terraces at submonolayer coverages. Annealing to higher temperatures leads to the formation of random or ordered surface alloy.
In Figure 5A LEIS spectra obtained after gold deposition at 500 K, and those collected after subsequent 5 minutes annealing at 1000 K, are shown for increasing amounts of Au. Please note that X-ray
Adsorption position
(see Fig. 4) 2x1 2x1_Au 2x1 2x1_Au
1 1.345 2.553 0.668 0.792
2 0.104 0.272 0.678 0.179
3 0 0 0.186 0
4 0.447 0.272 0.223 0.179
5 0.413 2.304 0.293 0.615
6 0.151 1.599 0.075 0.582
7 0.637 2.276 0.516 0.588
8 0.102 0.272 0.687 0.178
9 0.046 1.678 0 0.489
10 0.447 0.276 0.223 0.179
11 0.162 1.911 0.090 0.639
12 0.413 2.268 0.277 0.594
ERh (eV) EAu (eV)
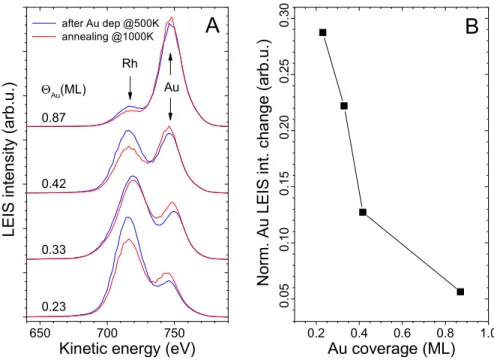
photoelectron spectroscopy (XPS) results indicate no desorption of Au at these temperatures (not shown). It is apparent from Fig. 5 that the surface alloy formation induces an increase in the Au LEIS intensity, accompanied by an attenuation of the Rh peak. This observation can be rationalized by considering that Au atoms in gold islands at 500 K are all at the same height. In the surface alloy, however, Au atoms are slightly protruded outwards compared to neighboring Rh atoms as demonstrated by the above calculations for the 2x1 structure, leading to the observed changes in LEIS intensities.
Presumably, the protrusion of gold atoms also occurs in a random arrangement of Au and Rh atoms in a disordered surface alloy. At Au=0.87 ML, where the growth of Au is not perfectly 2D at 500 K, annealing can also improve the wetting of Rh substrate by Au, contributing to the LEIS intensity changes. Please note that the percentual increase in Au LEIS intensity is smaller at this Au dose (Fig. 5B).
650 700 750
LEIS intensity (arb.u.)
Kinetic energy (eV)
after Au dep @500K annealing @1000K
0.87
0.23 0.33 0.42
Au(ML)
Rh Au
A
0.2 0.4 0.6 0.8 1.0
0.050.100.150.200.250.30Norm. Au LEIS int. change (arb.u.)
Au coverage (ML)
B
Figure 5. (A) LEIS spectra obtained after the deposition of increasing amounts of Au on Rh(111) at 500 K (blue), followed by 5 min. annealing at 1000 K (red). Each gold dose was evaporated on clean Rh(111). (B) Normalized Au LEIS intensity change depending on the Au coverage.
Our DFT calculations predict that the positioning of Rh atoms on top of Au layers/atoms is energetically disfavored (cf. e.g. full_Au and full_Au+Rh_row at Au=1 ML in Table 3 for a full Au layer, or see Table 4 for on-top-Au ("1") adsorption position of Rh). This is in harmony with our previous LEIS results: when Rh was dosed on a Rh(111) surface partially covered by Au islands, practically no Rh atoms were stabilized on top of gold islands, but Rh atoms were located either on gold-free Rh(111) areas or below Au islands31.
3.4. Calculated STM images of selected corrugated Au–Rh structures
Finally, bias-voltage-dependent STM imaging of selected corrugated surface structures is performed by STM simulations based on the calculated electronic states in DFT. We are seeking for STM contrast differences in the simulated images that could be used as fingerprints for the experimental STM identification of possible Au–Rh surface terminations resulting in similar atomic row-wise contrast31. Following the previous section, the 2x1 and the 2x1_Au structures are selected at Au=0.5 ML Au coverage. In addition, the energetically favored corrugated structures 2x2x1-1 and 2x1+full_Au, respectively at Au=1 ML and 1.5 ML, are taken from Table 3. Although the full_Au structure is the energetically preferred one at Au=1 ML, it is excluded from this STM study since the surface Au layer is atomically flat and not corrugated, therefore no atomic row-wise STM contrast is expected for this structure. At this point we recall the reported differences in the atomic arrangements of the two surfaces studied in section 3.3: a geometrical corrugation of 0.33 Å of the ordered surface alloy layer in the 2x1 structure is found, whereas for the 2x1_Au structure the added Au row corresponds to a Rh–Au layer-layer distance of 2.32 Å. Due to this large difference, we expect that the STM contrast is dominated by electronic effects resulting in a clear bias-voltage-dependence in the 2x1 case at low apparent
corrugation values of cc-STM images, and a quite stable contrast is forecast for the 2x1_Au case at much larger apparent corrugation values. For the 2x2x1-1 and the 2x1+full_Au structures the atomic corrugation of the surface layer is 0.58 Å (Au–Rh, Au is protruded outwards) and 0.76 Å (Au–Au), respectively. Here, we expect more stable STM contrasts for the 2x1+full_Au structure due to the pure Au composition of the surface layer compared to the 2x2x1-1 structure, where the Rh–Au bilayer alloy composition is expected to provide more bias-voltage-dependent changes of the STM contrast at lower apparent corrugation values.
Figure 6 shows a series of calculated cc-STM images at the bias voltages of ±1.5 V and ±0.5 V. Note that +1.5 V bias voltage was used in Ref. 31, and the best-resolved images were obtained in the constant- height mode, see also Fig. 1D. The calculated STM images in Fig. 6 indeed validate our expectations, and the extent of the contrast change by varying the bias voltage closely follows the geometrical (and the apparent) corrugation of the particular surface layer in an anticorrelated way: the 2x1 structure with the lowest geometrical corrugation (0.33 Å) shows the largest contrast variation and the lowest apparent corrugations, followed by the 2x2x1-1 (0.58 Å) and the 2x1+full_Au (0.76 Å) structures, and the STM contrast of the 2x1_Au structure with the added Au-row (2.32 Å) is the least sensitive to the bias voltage with the largest apparent corrugation values. The largest contrast difference among the considered structures is found at +0.5 V, however, it might be difficult to resolve in STM experiments, therefore clear fingerprints cannot be established. As a final note, it is well known that the STM contrast crucially depends on the (electron orbital-dependent) electronic structure and the apex geometry of the STM tip,48,56-62 which are neglected in the Tersoff-Hamann model employing a spherical s-type tip with a flat electronic structure. Therefore, subtle effects on the STM contrast based on diverse tip parameters in realistic tip models can be investigated in the future.
Figure 6. Calculated bias-voltage-dependent high-resolution cc-STM images of corrugated Au–Rh surface alloy structures at various Au coverages (Au): 2x1 (Fig. 3A, Au=0.5 ML), 2x1_Au (Fig. 3E, Au=0.5 ML), 2x2x1-1 (Fig. 3C, Au=1 ML), and 2x1+full_Au (Fig. 3F, Au=1.5 ML). Orange frames show the (2×1) surface unit cell. The apparent corrugation values (in pm units) of the contours at 10-5 bohr-3 are explicitly shown in the bottom right part of each image.
4. Summary and conclusions
Employing density functional theory (DFT) calculations, the atomic arrangements and energetics of an extensive set of Au–Rh structures in a confined (2×1) surface cell on a Rh(111) substrate were investigated. The energetic preference order of the structures was evaluated with a total energy transformation method accounting for the different chemical compositions of the atoms in the supercell.
Among the studied surface structures an ordered 2x1 surface alloy layer composed of 50% Au and 50%
Rh was identified as the energetically favored structure, which corresponds to an experimentally proposed configuration based on scanning tunneling microscopy (STM) imaging31. The topmost layer of this structure consists of alternating Au and Rh rows, approximately in the same atomic plane, although
Au atoms are slightly protruded. We compared this surface alloy with another candidate structure from STM experiment, an added-Au-row configuration. We characterized the optimized geometries of these two surfaces, and found a slightly lower electron work function for the close-packed alloy surface compared to that of the added-Au-row structure. Bader charge analysis did not reveal significant differences in the atomic charges of surface atoms in the two structures, and in both cases a partial electron transfer from Rh toward Au atoms is observed. By studying Rh and Au adsorption properties, it is found that the preferred adsorption site for the Rh is on-top-Rh on the 2x1 surface alloy, and hollow- Rh on the added-Au-row configuration. For the adsorption of Au the hollow-Rh site is also favored on the added-Au-row structure, and the bridge-Rh site is preferred on the 2x1 surface alloy. Based on the analysis of the adsorption properties the bonding order preference among Rh and Au species is identified as Rh–Rh > Rh–Au > Au–Au. We arrived at the same conclusion by taking transformed total energies of the set of Au–Rh structures in different ways, and concomitantly analyzing the geometrical arrangements and bonding of the atoms.
Among the structures corresponding to a gold dose of Au=1 ML, the most stable structure is a pseudomorphic single Au layer on top of Rh(111), which is not corrugated. At a gold amount of Au=1.5 ML, the most stable structure is essentially the same found for Au=0.5 ML (alternating Au and Rh rows), but covered with a somewhat corrugated atomic layer of Au.
DFT-based simulated STM images revealed bias-voltage-dependent contrast differences among selected corrugated surface layer structures at various Au coverages, which, however, are difficult to resolve in STM experiments due to the theoretically predicted low apparent corrugations. Experimental results obtained by STM and low energy ion scattering (LEIS) on the thermally induced formation of the ordered Au–Rh surface alloy complement our theoretical study. The presented methods and results are expected
to contribute to the understanding of the formation of metallic surface alloys in various chemical compositions.
Acknowledgments
Financial support of the Slovak Academy of Sciences via the SASPRO fellowship (project No. 1239/02/01), the National Research Development and Innovation Office of Hungary under projects No. K120115, FK124100, GINOP-2.3.2-15-2016-00013, and the BME-Nanotechnology FIKP grant of EMMI (BME FIKP- NAT) are gratefully acknowledged. This work was also supported by the Collegium Talentum 2017 Programme of Hungary.
References
(1) Gubó, R.; Vári, G.; Kiss, J.; Farkas, A. P.; Palotás, K; Óvári, L.; Berkó, A.; Kónya, Z. Tailoring the Hexagonal Boron Nitride Nanomesh on Rh(111) with Gold. Phys. Chem. Chem. Phys. 2018, 20, 15473–15485.
(2) Jacobsen, J.; Pleth Nielsen, L.; Besenbacher, F.; Stensgaard, I.; Lægsgaard, E.; Rasmussen, T.;
Jacobsen, K. W.; Nørskov, J. K. Atomic-Scale Determination of Misfit Dislocation Loops at Metal- Metal Interfaces. Phys. Rev. Lett. 1995, 75, 489–492.
(3) Besenbacher, F.; Chorkendorff, I.; Clausen, B. S.; Hammer, B.; Molenbroek, A. M.; Nørskov, J. K.;
Stensgaard, I. Design of a Surface Alloy Catalyst for Steam Reforming. Science 1998, 279, 1913–
1915.
(4) Pleth Nielsen, L.; Besenbacher, F.; Stensgaard, I.; Lægsgaard, E.; Engdahl, C.; Stoltze, P.; Jacobsen, K. W.; Nørskov, J. K. Initial Growth of Au on Ni(110): Surface Alloying of Immiscible Metals. Phys.
Rev. Lett. 1993, 71, 754–757.
(5) Pleth Nielsen, L.; Besenbacher, F.; Stensgaard, I.; Lægsgaard, E.; Engdahl, C.; Stoltze, P.; Nørskov, J. K. “Dealloying” Phase Separation during Growth of Au on Ni (110). Phys. Rev. Lett. 1995, 74, 1159–1162.
(6) Hugenschmidt, M. B.; Hitzke, A.; Behm, R. J. Island Assisted Surface Alloying Observed after Ni Deposition on Au(110)-(1x2). Phys. Rev. Lett. 1996, 76, 2535–2538.
(7) Sprunger, P. T.; Lægsgaard, E.; Besenbacher, F. Growth of Ag on Cu(100) Studied by STM: From Surface Alloying to Ag Superstructures. Phys. Rev. B 1996, 54, 8163–8171.
(8) Umezawa, K.; Nakanishi, S.; Yoshimura, M.; Ojima, K.; Ueda, K.; Gibson, W. M. Ag/Cu(111) Surface Structure and Metal Epitaxy by Impact-Collision Ion-Scattering Spectroscopy and Scanning Tunneling Microscopy. Phys. Rev. B 2000, 63, 035402.
(9) Kizilkaya, O.; Hite, D. A.; Zhao, W.; Sprunger, P. T.; Lægsgaard, E.; Besenbacher, F. Dimensionality in the Alloy–de-Alloy Phase Transition of Ag/Cu(110). Surf. Sci. 2005, 596, 242–252.
(10) Bischoff, M. M. J.; Yamada, T.; Quinn, A. J.; van der Kraan, R. G. P.; van Kempen, H. Direct Observation of Surface Alloying and Interface Roughening: Growth of Au on Fe(001). Phys. Rev.
Lett. 2001, 87, 246102.
(11) Bischoff, M. M. J.; Yamada, T. K.; Kempen, H. van. Analysis of the Short-Range Order of the Au/Fe(001) Surface Alloy. Phys. Rev. B 2003, 67, 165403.
(12) Okamoto, H.; Massalski, T. B. The Au-Rh (Gold-Rhodium) System. Bull. Alloy Phase Diagrams 1984,
5, 384–387.
(13) Toshima, N. Core/Shell-Structured Bimetallic Nanocluster Catalysts for Visible-Light-Induced Electron Transfer. Pure Appl. Chem. 2000, 72, 317–325.
(14) Toshima, N.; Hirakawa, K. Polymer-Protected Bimetallic Nanocluster Catalysts Having Core/Shell Structure for Accelerated Electron Transfer in Visible-Light-Induced Hydrogen Generation. Polym.
J. 1999, 31, 1127–1132.
(15) Casella, I. G.; Contursi, M. Rhodium-Modified Gold Polycrystalline Surface as Anode Material in Alkaline Medium: An Electrochemical and XPS Investigation. J. Electroanal. Chem. 2007, 606, 24–
32.
(16) Lin, X.; Yang, B.; Benia, H.-M.; Myrach, P.; Yulikov, M.; Aumer, A.; Brown, M. A.; Sterrer, M.;
Bondarchuk, O.; Kieseritzky, E.; et al. Charge-Mediated Adsorption Behavior of CO on MgO- Supported Au Clusters. J. Am. Chem. Soc. 2010, 132, 7745–7749.
(17) Konuspayeva, Z.; Berhault, G.; Afanasiev, P.; Nguyen, T.-S.; Auyezov, A.; Burkitbayev, M.; Piccolo, L. Au-Rh and Au-Pd Nanoalloys Supported on Well-Defined Rutile Titania Nanorods for Aromatics Hydrogenation Applications. In MRS Proceedings - Symposium AA – Catalytic Nanomaterials for Energy and Environment; MRS Online Proceedings Library; 2014; Vol. 1641.
(18) Óvári, L.; Bugyi, L.; Majzik, Z.; Berkó, A.; Kiss, J. Surface Structure and Composition of Au−Rh Bimetallic Nanoclusters on TiO2(110): A LEIS and STM Study. J. Phys. Chem. C 2008, 112, 18011–
18016.
(19) Óvári, L.; Berkó, A.; Balázs, N.; Majzik, Z.; Kiss, J. Formation of Rh-Au Core-Shell Nanoparticles on TiO2(110) Surface Studied by STM and LEIS. Langmuir 2010, 26, 2167–2175.