Contents lists available atScienceDirect
Journal of Physics and Chemistry of Solids
journal homepage:www.elsevier.com/locate/jpcs
In-situ transmission electron microscopy study of thermal stability and carbide formation in amorphous Cu-Mn/C fi lms for interconnect
applications
K.H. Nagy
∗, F. Misják
Centre for Energy Research, Hungarian Academy of Sciences, 1525 Budapest, P.O. Box 49, Hungary
A R T I C L E I N F O
Keywords:
Amorphous metal Cu-Mn alloy Diffusion barrier
In-situ transmission electron microscopy Solid phase transition
A B S T R A C T
In this study, the thermal stability and Mn carbide formation were investigated in amorphous Cu-Mn/Cfilms with potential applications as interconnect layers. Amorphous Cu-Mnfilms (with 50 and 70 at% Mn content) were deposited by direct current (DC) magnetron sputtering at room temperature. Evaporated carbon foils were used as substrates to model low-κcarbon doped oxides in their reaction with Cu-Mnfilms. In-situ transmission electron microscopy indicated that the amorphous state was stable below 300 °C, where thefilms crystallized into Cu(Mn) andα-Mn based solid solutions. The Mn carbide phases appeared at 400 °C where it was accom- panied by the disappearance of theα-Mn phase and a decrease in the Mn content of the Cu(Mn) phase. The Mn23C6and Mn5C2carbide phases were present from 400 °C to 500 °C, and Mn5C2and Mn7C3carbides in the temperature range of 500–600 °C. The Mn5C2carbides exhibited significant grain growth in the temperature range of 400–600 °C. The activation energies for Mn5C2growth were 101 ± 20 and 88 ± 22 kJ/mol in the films containing 50 and 70 at% Mn, respectively, thereby indicating that growth was facilitated by a higher Mn content. In addition to carbide formation, surface oxidation occurred in the system. Thermodynamic con- siderations indicate that Mn carbide formation can only occur in the Cu-Mn-C-O system when the Mn is not fully oxidized and free metallic Mn atoms remain.
1. Introduction
Due to the continued downscaling of ultra-large scale integrated circuits, the use of conventional barriers in Cu metallization has become challenging, and thus self-forming barriers (SFB) have been proposed as a potential solution. The basic idea of SFBs involves the formation of a barrier from the material undergoing metallization while it interacts with the dielectric. In particular, Cu metallization involves alloying with a strong oxide-forming element, which is selected because it tends to migrate to the alloy/dielectric interface and reacts with the di- electric. The segregation and reaction of the alloying element with the dielectric can be achieved by annealing during technological processes.
Among the various alloying candidates, Mn has been investigated widely and it forms a reliable uniform barrier layer on SiO2surfaces [1–4].
Barrier formation in low Mn content Cu-Mnfilms has been studied extensively [2,5,6] but other compositions also merit investigation. In our previous study, the morphology and electrical properties of the Cu- Mn thinfilm system were mapped as a function of the composition, and an amorphous phase-state was observed in the 40–70 at% Mn interval
[7]. It is considered that an amorphous structure can have several ad- vantages in SFB processes because its structural homogeneity and lack of grain boundaries may help to prevent Cu diffusion. However, amorphous Cu-Mn structures are metastable, so they may crystallize during annealing or due to other thermal effects that occur in techno- logical processes. Therefore, the thermal stability of Cu-Mn amorphous structures should be examined in order to ensure their adaptability for SFB processes.
Another important issue in the development of ultra-large scale integrated circuits is the optimization of low dielectric constant (κ) insulating materials, which have recently been investigated extensively [8–14]. Among the commercially available low-κdielectrics, carbon doped oxides (CDOs) are considered to be most compatible with modern device fabrication. CDOs are SiO2-based materials, which are formed by replacing some of the Si-O bonds with less polar Si-CHx
bonds. However, Si-CHxbonds are considerably weaker than Si-O bonds and a wide range of device fabrication steps, including barrier forma- tion, can deplete carbon from CDOs and increase theκvalue. The re- leased carbon can interfere with the uniform formation of a barrier at the interconnect/CDO interface by forming carbide phases that are
https://doi.org/10.1016/j.jpcs.2018.05.036
Received 10 January 2018; Received in revised form 23 May 2018; Accepted 24 May 2018
∗Corresponding author.
E-mail address:nagy.klara@energia.mta.hu(K.H. Nagy).
Available online 25 May 2018
0022-3697/ © 2018 The Authors. Published by Elsevier Ltd. This is an open access article under the CC BY-NC-ND license (http://creativecommons.org/licenses/BY-NC-ND/4.0/).
T
incorporated into the barrier. Some studies of Cu(Mn)-based barrier formation on CDO substrates also investigated how to prevent carbide formation [10,12–14]. These studies modeled barrier formation by depositing a∼1 nm thick Mn layer on CDO substrates with different experimental parameters.
Many studies have investigated the effects of Mn oxidation on Mn carbide formation (e.g., the Mn layer was deposited in an O2atmo- sphere) [10,12,13]. Limited carbide formation was found when the Mn was partially oxidized [12,13], whereas carbide formation was sup- pressed at full oxidation, even after annealing [10]. However, fully oxidizing the Mn is undesirable because the presence of metallic Mn is important for controlling the thickness of the barrier layer [3]. Other studies aimed to modify the surface of the CDO substrate before Mn deposition. If carbon is removed from the CDO surface by atomic oxygen treatment, a SiO2-like surface sublayer forms [14]. This sub- layer effectively prevents the formation of Mn-C bonds on a non-porous substrate, even after annealing, but it is ineffective on a porous sub- strate. Furthermore, atomic oxygen treatment may negatively impact the formation of a discrete barrier with porous substrates [14]. Thus, these previous studies indicate that processes for preventing carbide formation may be detrimental for the dielectric constant (e.g., low carbon content and porosity of CDOs) and/or the SFB process (e.g., fully oxidizing the Mn).
In this study, to facilitate the design of SFBs, we studied the reaction between a promising SFB material and carbon. In particular, we in- vestigated the thermal stability of amorphous Cu-Mn films and Mn carbide formation during annealing using in-situ transmission electron microscopy (TEM) analysis. Evaporated carbon foils were used as sub- strates to model the CDO surfaces in their reaction with Cu-Mnfilms.
Improving our fundamental understanding of Mn carbide formation may assist its prevention, so we characterized the formation of the carbide phases and their grain growth.
2. Experimental
Amorphous Cu-Mn alloy thin films were co-deposited in a high- vacuum direct current (DC) magnetron sputtering system. Films with a thickness of 50 nm were grown at room temperature on evaporated carbon foils. The carbon foils were prepared by thermal sublimation of a graphite rod on collodionfilm substrates supported by Ni grids at a pressure of Pa. The collodionfilms were then removed by annealing the grids at 400 °C for 90 min. The resulting carbon foils had an amorphous structure and a thickness of 10–20 nm. The Cu and Mn targets (99.99%
and 99.95% purity, respectively) were mounted 25° toward the vertical and the rotating substrate holder was positioned 12 cm away from them. Before deposition, the sputtering chamber was evacuated to a base pressure of5×10−6Pa and the substrates were annealed at 150 °C for 60 min to remove any mobile hydrocarbons. Ar (99.999% purity) was then introduced at a pressure of2×10−1Pa. The targets were pre- sputtered before deposition with the shutters closed for 5–10 min. The desired compositions (50 and 70 at% Mn) were obtained by adjusting the magnetrons' power [7]. The deposition rate of the layers was 0.4 nm/s.
Thefilms were annealed in-situ and examined with a Philips CM-20 transmission electron microscope, which operated at 200 keV. The temperature range for in-situ annealing was 20–600 °C and the heat treatment program is shown inFig. 1. Energy dispersive X-ray spec- troscopy (EDS) analysis was performed to verify the compositions of the samples using a Ge detector (NORAN EDS system) attached to the CM- 20 microscope.
The phase compositions of thefilms were evaluated based on the selected area electron diffraction (SAED) patterns using the Process Diffraction program [15]. The size of the area that contributed to the SAED patterns measured 5μm in diameter. During the evaluation of each SAED pattern, the camera constant was specified by calibrating based on MnO markers. For each temperature step, the MnO lattice
parameter was calculated using Eq.(1):
aT=aT=20°C(1+αΔT), (1)
whereaT is the lattice parameter at a given temperature,α T( )is the thermal expansion coefficient, andT is the temperature. The thermal expansion coefficient for MnO was taken from a previous study [16].
3. Results
Figs. 2 and 3show the changes in the microstructure during an- nealing based on brightfield images and the electron diffraction in- tensity distributions. The as-depositedfilms subjected to in-situ heat treatment were amorphous with both compositions [7]. Mn oxidizes readily, even in ultra-high vacuum environments [13], so the presence of MnO nanoparticles caused a slight diffraction contrast (Fig. 2a and e). During annealing, the films with Mn contents of 50 and 70 at%
exhibited similar behavior, and only slight differences were observed.
As the temperature increased, bothfilms remained amorphous below 300 °C. At 300 °C, bothfilms crystallized into Cu-based andα-Mn-based solid solutions. The typical electron diffraction patterns for these phases are shown inFig. 4. The grain size in the solid solutions was around 10–40 nm (Fig. 2b and f). The Cu-based solid solution remained stable until the end of annealing, but the Mn-based phases underwent changes. Theα-Mn-based solid solution disappeared at 400 °C in the 50 at% Mn film and at 450 °C in the 70 at% Mn contentfilm. New phases appeared at 400 °C (marked by arrows inFig. 3). In addition, strong oxidation occurred above 400 °C and substantial grain growth was also observed (Fig. 2d and h).
The diffraction maxima determined for the Cu-based and α-Mn- based solid solutions exhibited continuous shifts in bothfilms (Fig. 3), thereby indicating changes in the lattice parameters. The lattice para- meters measured for both solid solutions at each temperature are listed inTable 1. In general, two mechanisms can contribute to changes in the lattice parameter: thermal expansion and changes in the solute con- centration. Thermal expansion can be calculated based on the lattice parameter for pure components at room temperature (aCu=3,6149Å [17] and aα Mn− =8,9125Å [18]) and their thermal expansion coeffi- cients (αCu=1.65×10 1/−5 K[17] andαMn=2.17×10 1/−5 K[18]) using Eq.(1). The dissolution limits of each component should be considered when determining changes in the solute concentration.α-Mn can dis- solve up to∼10 at% Cu under non-equilibrium conditions [7],∼5 at%
C in the temperature range of 0–400 °C [19], and a negligible amount of O [20]. Thus, theα-Mn solid solution could comprise several elements:
Fig. 1.Annealing cycle used in the in-situ experiments. The vacuum conditions during annealing were6×10−5Pa at 20 °C, which increased to1×10−3Pa at 600 °C.
K.H. Nagy, F. Misják Journal of Physics and Chemistry of Solids 121 (2018) 312–318
Mn, Cu, and C atoms. By contrast, Cu dissolves∼20–45 at% Mn in the temperature range of 300–600 °C [21] and negligible amounts of C and O [22,23]. Thus, Cu forms a simple Cu(Mn) solid solution and its composition can be calculated from the lattice parameter. Czigány et al.
measured the dependence of the Cu(Mn) lattice parameter based on the composition in sputtered Cu-Mn thin films at room temperature as:
a=aCu+0.322c, wherecis the Mn concentration in the Cu(Mn) solid solution in at% [24]. We modified this equation to consider thermal expansion:
aT=aCuT+0.322 ,c (2)
whereaCuTis calculated at each temperature using Eq.(1).
Fig. 5shows the compositions of the Cu(Mn) phase calculated (using Eq.(2)) in the temperature range of 300–600 °C. There were significant declines in the Mn contents in bothfilms. After crystallization, the Cu (Mn) phase dissolved 31 and 23 at% Mn in thefilms with Mn contents of 50 and 70 at%, respectively, and the Mn content increased slightly in bothfilms as the temperature increased. The Mn content decreased to 18 at% at 400 °C and then decreased further to 6 at% at 450 °C in the film containing 50 at% Mn. In thefilm containing 70 at% Mn, the Mn content increased at 400 °C but decreased to 9 at% at 450 °C. Above
450 °C, the Mn content varied between 7 and 11 at% in bothfilms.
Fig. 6shows enlargements of the diffraction intensity distributions for thefilms with Mn contents of 50 (a) and 70 at% (b) to highlight the formation of the new phases. At 400 °C, two Mn carbide phases could be identified in bothfilms: Mn23C6and Mn5C2. In addition, Mn5C2was present up to 600 °C, but Mn23C6disappeared at 500 °C and 550 °C in thefilms with Mn contents of 50 and 70 at%, respectively. At 500 °C, a new carbide, Mn7C3, formed in bothfilms and remained stable up to 600 °C. The appearance and disappearance of the crystalline phases are shown inTable 2.
To interpret the carbide formation process, we next provide a comprehensive summary of all the processes that occurred in the multicomponent system. At 400 °C, three processes started simulta- neously: theα-Mn phase disappeared (i), the Mn content of the Cu(Mn) phase decreased (ii), and Mn carbides formed (iii). All three processes could be derived from a solid state reaction between thefilm and the carbon substrate layer. Carbon atoms diffused into thefilm where they could react with the metallic Mn present in theα-Mn and Cu(Mn) solid solutions to form Mn carbide phases. A slight difference was found between thefilms containing 50 and 70 at% Mn. In thefilm containing 70 at% Mn, theα-Mn phase disappeared and the Mn content of the Cu Fig. 2.Changes in the microstructure of thefilms with Mn contents of 50 at% (a–d) and 70 at% (e–h) during annealing in brightfield TEM images (a, e: 20 °C; b, f:
300 °C; c, g: 450 °C; d, h: 600 °C).
Fig. 3.Electron diffraction intensity distributions for thefilms with Mn contents of 50 (a) and 70 at% (b) at different temperatures during in-situ heat treatment.
(Mn) phase decreased at a higher temperature (450 °C), whereas car- bides were formed at the same temperature (400 °C) as in the film containing 50 at% Mn. If we assume that carbon diffusion was similar in the twofilms, the transformation of metallic Mn into carbide must have been prolonged in thefilm with a Mn content of 70 at% due to its higher Mn content.
Mn can form various carbide phases and three were identified in
bothfilms: Mn23C6, Mn5C2, and Mn7C3. Although we obtained a mul- ticomponent system, the Mn-C phase diagram (shown inFig. 7) may help to interpret the changes in the carbide phases. In terms of carbides, below 500 °C, the system was in the phase range denoted by I inFig. 7 where Mn23C6and Mn5C2carbides were present. As the temperature increased, more carbon diffused into thefilm and the compound with a lower C:Mn ratio (Mn23C6) disappeared, and a new phase with a higher C:Mn ratio then appeared, i.e., Mn7C3. Thus, above 500 °C, the system was in the phase range denoted by II where Mn5C2and Mn7C3carbides were present.
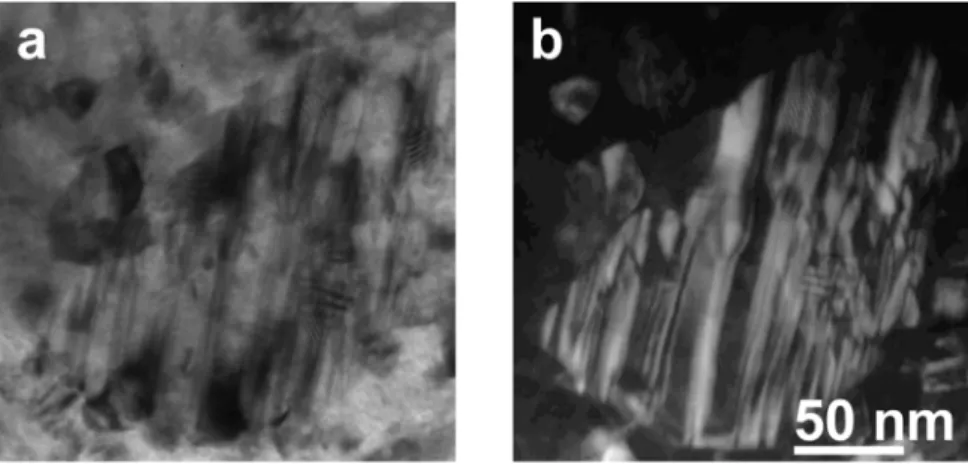
To investigate the microstructure of the carbides, darkfield images were recorded using the reflections located between the two dashed lines in Fig. 6. The carbide grains (shown inFig. 8) had a lamellar structure and they exhibited significant grain growth in the tempera- ture range of 400–600 °C (also shown inFig. 2c and d, 2g–h). We fol- lowed the growth offive carbide grains in darkfield images taken at different temperatures within an area of1.7×1.5μm2. The grains had a somewhat elongated shape so two perpendicular axes,x and y, were measured on each grain and the grain size d was calculated as:
d=(x+y)/2. The only carbide phase present throughout the tem- perature range of 400–600 °C was the Mn5C2phase, so we can conclude that we measured these grains.
Fig. 9a shows the dependence of the grain size measured for the Mn5C2phase as a function of the annealing temperature. The location of the points suggests Arrhenius-type grain growth. The characteristic activation energy for the Arrhenius-type growth process can be esti- mated according to the following equation [25]:
d d At Q
exp RT ,
gm m n gg
0 ⎜ ⎟
= + ⎛
⎝
− ⎞
⎠ (3)
wheredg is the average carbide grain size at a given annealing step nm
( ),d0is the average carbide grain size at the start of each annealing step(nm),tis the time( ),s Qggis the activation energy of carbide grain growth( /J mol), R is the gas constant ( /J mol K),T is the absolute temperature( )K , andm A, , andnare constants, wherem=2 applies when the growth rate is limited by interfacial reactions (ideal grain growth) andm=3 applies for a system limited by the diffusion of atoms in the solid or liquid phases [26]. In ourfilms, carbide growth was presumably limited by the diffusion of Mn and C atoms, so we used m=3. According to the implementation of the experiment,tcould be regarded as constant so Eq.(3)can be simplified as follows.
d d A Q
exp RT
gm m gg
0 ⎜ ⎟
= + ′ ⎛
⎝
− ⎞
⎠ (4)
Fig. 4.Selected area electron diffraction patterns obtained for the 50 at% Mnfilm at 250 °C (a) and 300 °C (b). The structure of thefilm was amorphous below 300 °C (a). At 300 °C, thefilm crystallized into Cu-based andα-Mn-based solid solutions (b).
Table 1
Lattice parameters measured for Cu-based and Mn-based solid solutions. The error in the lattice parameter measurements was 0.5%.
T [°C] 50 at% Mn 70 at% Mn
aCu[ ]Å aα Mn− [ ]Å aCu[ ]Å aα Mn− [ ]Å
300 3.731 9.015 3.705 9.015
350 3.736 9.015 3.714 9.015
400 3.694 – 3.725 8.986
450 3.659 – 3.668 –
500 3.666 – 3.668 –
550 3.671 – 3.671 –
600 3.686 – 3.679 –
Fig. 5.Dependence on temperature of the Mn concentration in the Cu(Mn) solid solution forfilms with Mn contents of 50 and 70 at%.
K.H. Nagy, F. Misják Journal of Physics and Chemistry of Solids 121 (2018) 312–318
By calculating the logarithm of Eq.(4), we obtain:
d d lnA Q
ln( gm− 0m)= ′ + ⎛⎜ RTgg⎟.
⎝
− ⎞
⎠ (5)
By taking the partial derivative of Eq.(5)with respect to1/T , the activation energy can be calculated as follows.
d d
T
Q R
(ln( ))
(1/ )
gm m
gg
∂ − 0
∂ = −
(6) By plotting Eq. (5) (see Fig. 9b), the relationship between
d d
ln( gm m)
− 0 and1/T is linear whenm=3. Thus, in agreement with our assumption, the grain growth was an Arrhenius-type process, and it was limited by diffusion and the slopes of the linearfits were equal to Qgg/R (Eq.(6)). Thus, the activation energies for Mn5C2grain growth were 101 ± 20 and 88 ± 22 kJ/mol in thefilms containing 50 and 70 at% Mn, respectively. Therefore, carbide growth was facilitated by higher Mn contents.
In addition to carbide formation, surface oxidation occurred in the system. MnO was present at the top of the as-deposited films but the intensity of the MnO diffraction peaks (Fig. 2) increased significantly during annealing above 300 °C. To compare the probability of oxide and carbide formation, the standard free energy (ΔG0) was determined for each of the two processes in the annealing temperature range. The carbon line [27] divides all oxides into two classes. The oxides with more negative standard free energy than the carbon line cannot be reduced by carbon. The carbon line was at a constant value of
−395 kJ/mol in the temperature range of 20–600 °C [27], and the MnO curve varied in a linear manner from −729 kJ/mol to−640 kJ/mol
[28]. The standard free energy curve for MnO was below the carbon line, so the carbon could not reduce MnO. Therefore, Mn carbide for- mation could only occur in this multicomponent system when free metallic Mn atoms were present.
This thermodynamic restriction explains the results of previous studies that investigated the effects of Mn oxidation on Mn carbide formation [10,12,13]. Bogan et al. and McCoy et al. [12,13] found that the partial oxidation of Mn resulted in limited Mn carbide formation. In addition, Casey et al. [10] showed that the full oxidation of Mn effec- tively inhibited Mn carbide formation, although it increased the thickness of the barrier layer. In a later study, Bogan et al. [14] in- vestigated another method for preventing Mn carbide formation, where they modified the surface of the CDO substrate and created an SiO2-like surface sublayer, which avoided Mn carbide formation on a non-porous CDO. However, limited carbide formation was found on a porous sub- strate and the surface treatment had detrimental effects on the forma- tion of a discrete barrier layer.
Based on the experimental results and thermodynamic arguments, we provide suggestions regarding the requirements in terms of the optimal method for inhibiting carbide formation. First, in the en- vironment of the Cu(Mn)/CDO interface, there must be sufficient oxygen for the full oxidation of Mn. Second, the diffusion of Mn into the CDO must be prevented.
4. Summary
Amorphous Cu-Mn thinfilms (with Mn contents of 50 and 70 at%) were deposited by DC magnetron sputtering on evaporated carbon Fig. 6.Electron diffraction intensity distributions determined for thefilms with Mn contents of 50 at% (a) and 70 at% (b), highlighting carbide formation. The dashed lines denote the angular intervals of the reflections used for darkfield TEM images (an example is shown inFig. 8b).
Table 2
Phases of thefilms with Mn contents of 50 and 70 at% in the temperature range of 300–600 °C (plus signs indicate that a given phase exists at a given temperature).
T [°C] Cu α-Mn Mn23C6 Mn5C2 Mn7C3 MnO
50% 70% 50% 70% 50% 70% 50% 70% 50% 70% 50% 70%
300 + + + + + +
350 + + + + + +
400 + + + + + + + + +
450 + + + + + + + +
500 + + + + + + + + +
550 + + + + + + + +
600 + + + + + + + +
substrates at room temperature. Thefilms were annealed in-situ in the TEM to investigate the thermal stability of the amorphous Cu-Mnfilms and Mn carbide formation. Both compositions exhibited similar beha- vior during annealing. The amorphous state was stable below 300 °C, where thefilms crystallized into Cu(Mn) andα-Mn-based solid solu- tions. The Cu-based solid solution remained stable up to 600 °C but the Mn-based phases underwent changes. The Mn carbide phases appeared at 400 °C, which were accompanied by the disappearance of theα-Mn phase and a decrease in the Mn content of the Cu(Mn) phase. In the temperature range of 400–500 °C, the Mn23C6 and Mn5C2 carbide phases were present. As the temperature increased, more carbon dif- fused into the film. Hence, the compound with a lower C:Mn ratio (Mn23C6) disappeared and a new phase with a higher C:Mn ratio ap- peared, i.e., Mn7C3. The Mn5C2carbides had a lamellar structure and they exhibited Arrhenius-type grain growth in the temperature range of
400–600 °C. The activation energies for Mn5C2growth were 101 ± 20 and 88 ± 22 kJ/mol in thefilms containing 50 and 70 at% Mn, re- spectively, thereby indicating that carbide growth was facilitated by higher Mn contents. In addition to carbide formation, surface oxidation also occurred in the system. Our results suggest that a thin, uniform barrier layer without carbide formation can be formed on the surfaces of CDOs when sufficient oxygen is available for the full oxidation of Mn within the diffusion distance of the Cu(Mn)/CDO interface and when the diffusion of Mn into the CDO is prevented.
Prime novelty statement
In the submitted manuscript, we report in-situ TEM results obtained on thermal stability and solid phase reaction between amorphous Cu- Mnfilms and carbon substrates. Carbon substrates are used to model Fig. 7.Mn-C equilibrium phase diagram in the temperature range of 0–650 °C based on Ref. [19].
Fig. 8.Brightfield (a) and darkfield (b) image of a Mn5C2carbide grain in the 50 at% Mn sample annealed at 600 °C.
Fig. 9.Mn5C2grain growth during annealing. Dependence of the grain size as the function of the annealing temperature (a). Dependence of the logarithm of grain growth(dgm dm)
− 0 as a function of1/Twhenm=3(Eq.(6)) (b).
K.H. Nagy, F. Misják Journal of Physics and Chemistry of Solids 121 (2018) 312–318
low-κcarbon doped dielectric surfaces in their reaction with Cu-Mn films. The goal is to describe the mechanism of Mn carbide formation and the forming carbide phases. The possibility of suppressing carbide formation is discussed.
Acknowledgments
The authors thank Prof. György Radnóczi for valuable discussions.
This study was supported by the Hungarian Academy of Sciences (Grant Nos. NN OTKA 112156 and OTKA 81808).
References
[1] J. Koike, M. Wada, Self-forming diffusion barrier layer in Cu–Mn alloy metalliza- tion, Appl. Phys. Lett. 87 (2005) 41911https://dx.doi.org/10.1063/1.1993759.
[2] M. Haneda, J. Iijima, J. Koike, Growth behavior of self-formed barrier at Cu–Mn∕SiO2 interface at 250–450°C, Appl. Phys. Lett. 90 (2007) 252107https://
dx.doi.org/10.1063/1.2750402.
[3] P. Casey, J. Bogan, J.G. Lozano, P.D. Nellist, G. Hughes, Chemical and structural investigation of the role of both Mn and Mn oxide in the formation of manganese silicate barrier layers on SiO2, J. Appl. Phys. 110 (2011) 54507https://doi.org/10.
1063/1.3630123.
[4] C. Byrne, B. Brennan, A.P. McCoy, J. Bogan, A. Brady, G. Hughes, In situ XPS chemical analysis of MnSiO3copper diffusion barrier layer formation and si- multaneous fabrication of metal oxide semiconductor electrical test MOS structures, ACS Appl. Mater. Interfaces 8 (2016) 2470–2477,http://dx.doi.org/10.1021/
acsami.5b08044.
[5] J.G. Lozano, J. Bogan, P. Casey, A.P. McCoy, G. Hughes, P.D. Nellist, Scanning transmission electron microscopy investigations of self-forming diffusion barrier formation in Cu(Mn) alloys on SiO2, Apl. Mater. 1 (2013) 42105https://dx.doi.
org/10.1063/1.4822441.
[6] M.P. Nguyen, Y. Sutou, J. Koike, Diffusion barrier property of MnSixOy layer formed by chemical vapor deposition for Cu advanced interconnect application, Thin Solid Films 580 (2015) 56–60https://doi.org/10.1016/j.tsf.2015.03.007.
[7] F. Misják, K.H. Nagy, P. Lobotka, G. Radnóczi, Electron scattering mechanisms in Cu-Mnfilms for interconnect applications, J. Appl. Phys. 116 (2014) 83507https://
dx.doi.org/10.1063/1.4893718.
[8] J.M. Ablett, J.C. Woicik, Z. Tőkei, S. List, E. Dimasi, Phase identification of self- forming Cu–Mn based diffusion barriers on p-SiOC: H and SiO2 dielectrics using x- ray absorptionfine structure, Appl. Phys. Lett. 94 (2009) 42112https://dx.doi.org/
10.1063/1.3068500.
[9] C.J. Wilson, H. Volders, K. Croes, M. Pantouvaki, G.P. Beyer, A.B. Horsfall, A.G. O'Neill, Z. Tőkei, In situ X-ray diffraction study of self-forming barriers from a Cu–Mn alloy in 100 nm Cu/low-k damascene interconnects using synchrotron ra- diation, Microelectron. Eng. 87 (2010) 398–401https://dx.doi.org/10.1016/j.mee.
2009.06.023.
[10] P. Casey, J. Bogan, G. Hughes, Photoemission study of carbon depletion from ul- tralow-κcarbon doped oxide surfaces during the growth of Mn silicate barrier layers, J. Appl. Phys. 110 (2011) 124512https://dx.doi.org/10.1063/1.3669998.
[11] T.K. Indukuri, R.N. Akolkar, J.S. Clarke, A. Genc, F. Gstrein, M.C. Harmes, B. Miner, F. Xia, D.J. Zierath, S. Balakrishnan, Electrical and reliability characterization of CuMn self forming barrier interconnects on low-k CDO dielectrics, Microelectron.
Eng. 92 (2012) 49–52https://dx.doi.org/10.1016/j.mee.2011.04.043.
[12] J. Bogan, A.P. McCoy, R. O'Connor, P. Casey, C. Byrne, G. Hughes, Photoemission study of the identification of Mn silicate barrier formation on carbon containing low-κdielectrics, Microelectron. Eng. 130 (2014) 46–51https://doi.org/10.1016/j.
mee.2014.09.012.
[13] A.P. McCoy, J. Bogan, L. Walsh, C. Byrne, R. O'Connor, J.C. Woicik, G. Hughes, The impact of porosity on the formation of manganese based copper diffusion barrier layers on low-κdielectric materials, J. Phys. D Appl. Phys. 48 (2015) 325102 https://doi.org/10.1088/0022-3727/48/32/325102.
[14] J. Bogan, R. Lundy, A.P. McCoy, R. O'Connor, C. Byrne, L. Walsh, P. Casey, G. Hughes, In-situ surface and interface study of atomic oxygen modified carbon containing porous low-κdielectricfilms for barrier layer applications, J. Appl. Phys.
120 (2016) 105305https://doi.org/10.1063/1.4962371.
[15] J.L. Lábár, Consistent indexing of a (set of) single crystal SAED pattern(s) with the Process Diffraction program, Ultramicroscopy 103 (2005) 237–249https://dx.doi.
org/10.1016/j.ultramic.2004.12.004.
[16] I. Suzuki, S. Okajima, K. Seya, Thermal expansion of single-crystal manganosite, J.
Phys. Earth 27 (1979) 63–69https://doi.org/10.4294/jpe1952.27.63.
[17] Technical data for Cu, (2017).http://periodictable.com/Elements/029/data.html (accessed September 20, 2017).
[18] Technical data for Mn, (2017).http://periodictable.com/Elements/025/data.html (accessed September 20, 2017).
[19] M.-K. Paek, J.-J. Pak, Y.-B. Kang, Phase equilibria and thermodynamics of Mn–C, Mn–Si, Si–C binary systems and Mn–Si–C ternary system by critical evaluation, combined with experiment and thermodynamic modeling, Calphad 46 (2014) 92–102https://doi.org/10.1016/j.calphad.2014.02.007.
[20] A.N. Grundy, B. Hallstedt, L.J. Gauckler, Assessment of the Mn-O system, J. Phase Equil. 24 (2003) 21–39https://doi.org/10.1007/s11669-003-0004-6.
[21] C.P. Wang, X.J. Liu, I. Ohnuma, R. Kainuma, K. Ishida, Thermodynamic assessments of the Cu–Mn–X (X: Fe, Co) systems, J. Alloy. Comp. 438 (2007) 129–141https://
dx.doi.org/10.1016/j.jallcom.2006.08.018.
[22] C-Cu phase diagram, (2017).http://www.crct.polymtl.ca/fact/phase_diagram.php?
file=C-Cu.jpg&dir=SGTE2014(accessed September 20, 2017).
[23] L. Schramm, G. Behr, W. Löser, K. Wetzig, Thermodynamic reassessment of the Cu- O phase diagram, J. Phase Equilibria Diffusion 26 (2005) 605–612https://doi.org/
10.1007/s11669-005-0005-8.
[24] Z. Czigány, F. Misják, O. Geszti, G. Radnóczi, Structure and phase formation in Cu–Mn alloy thinfilms deposited at room temperature, Acta Mater. 60 (2012) 7226–7231https://doi.org/10.1016/j.actamat.2012.09.034.
[25] L. Wang, D. Qian, J. Guo, Y. Pan, Austenite grain growth behavior of AISI 4140 alloy steel, Adv. Mech. Eng. 5 (2013),https://doi.org/10.1155/2013/762890.
[26] C. Wagner, Theorie der Alterung von Niederschlägen durch Umlösen, Electrochemistry 65 (1961) 581–591,http://dx.doi.org/10.1002/bbpc.
19610650704.
[27] G.R. Gaskell, Metallurgical thermodynamics, in: R.W. Cahn, P. Haasen (Eds.), Phys.
Metall. North-Holland, 1996, pp. 432–433.
[28] K.T. Jacob, A. Kumar, Y. Waseda, Gibbs Energy of formation of MnO: measurement and assessment, J. Phase Equilibria Diffusion 29 (2008) 222–230https://doi.org/
10.1007/s11669-008-9280-5.