The Chemical Compositions of Accreted and in situ
Galactic Globular Clusters According to SDSS/APOGEE
Danny Horta
1,
?Ricardo P. Schiavon
1, J. Ted Mackereth
1,2, Timothy C. Beers
3, Jos´ e G. Fern´ andez-Trincado
4, Peter M. Frinchaboy
5, D. A. Garc´ıa-Hern´ andez
6,7, Doug Geisler
8,9, Sten Hasselquist
10,11, Henrik J¨ onsson
12,13, Richard R. Lane
14,15, Steven R. Majewski
16, Szabolcs M´ esz´ aros
17,18, Christian Moni Bidin
19,
David M. Nataf
20, Alexandre Roman-Lopes
21, Christian Nitschelm,
22J. Vargas-Gonz´ alez
23, Gail Zasowski
111Astrophysics Research Institute, Liverpool John Moores University, 146 Brownlow Hill, Liverpool L3 5RF, UK 2School of Astronomy and Astrophysics, University of Birmingham, Edgbaston, Birmimgham B15 2TT, UK
3Department of Physics and JINA Center for the Evolution of the Elements, University of Notre Dame, Notre Dame, IN 46556, USA 4Instituto de Astronom´ıa y Ciencias Planetarias, Universidad de Atacama, Copayapu 485, Copiap´o, Chile
5Department of Physics&Astronomy, Texas Christian University, Fort Worth, TX 76129, USA 6Instituto de Astrof´ısica de Canarias (IAC), E-38205 La Laguna, Tenerife, Spain
7Universidad de La Laguna (ULL), Departamento de Astrof´ısica, E-38206 La Laguna, Tenerife, Spain 8Departamento de Astronom´ıa, Universidad de Concepci´on, Casilla 160-C, Concepci´on, Chile
9Departamento de Astronom´ıa, Facultad de Ciencias, Universidad de La Serena. Av. Juan Cisternas 1200, La Serena, Chile 10New Mexico State University, Las Cruces, NM 88003, USA
11Department of Physics&Astronomy, University of Utah, Salt Lake City, UT 84112, USA 12Materials Science and Applied Mathematics, Malm¨o University, SE-205 06 Malm¨o, Sweden
13Lund Observatory, Department of Astronomy and Theoretical Physics, Lund University, Box 43, SE-22100 Lund, Sweden 14Instituto de Astronom´ıa y Ciencias Planetarias, Universidad de Atacama, Copayapu 485, Copiap´o, Chile
15Instituto de Astrof´ısica, Pontificia Universidad Cat´olica de Chile, Av. Vicuna Mackenna 4860, 782-0436 Macul, Santiago, Chile 16Dept. of Astronomy, University of Virginia, Charlottesville, VA 22904-4325, USA
17ELTE E¨otv¨os Lor´and University, Gothard Astrophysical Observatory, 9700 Szombathely, Szent Imre H. st. 112, Hungary 18MTA-ELTE Exoplanet Research Group, 9700 Szombathely, Szent Imre h. st. 112, Hungary
19Instituto de Astronom´ıa, Universidad Cat´olica del Norte, Av. Angamos 0610, Antofagasta, Chile 20Department of Physics&Astronomy, The Johns Hopkins University, Baltimore, MD 21218, USA
21Departamento de F´ısica, Facultad de Ciencias, Universidad de La Serena, Cisternas 1200, La Serena, Chile 22Centro de Astronom´ıa (CITEVA), Universidad de Antofagasta, Avenida Angamos 601, Antofagasta 1270300, Chile
23Centre for Astrophysics Research, School of Physics, Astronomy and Mathematics, University of Hertfordshire, College Lane, Hatfield AL10 9AB, UK
Accepted XXX. Received YYY; in original form ZZZ
ABSTRACT
Studies of the kinematics and chemical compositions of Galactic globular clusters (GCs) enable the reconstruction of the history of star formation, chemical evolu- tion, and mass assembly of the Galaxy. Using the latest data release (DR16) of the SDSS/APOGEE survey, we identify 3,090 stars associated with 46 GCs. Using a pre- viously defined kinematic association, we break the sample down into eight separate groups and examine how the kinematics-based classification maps into chemical com- position space, considering only α (mostly Si and Mg) elements and Fe. Our results show that: (i) The loci of bothin situand accreted subgroups in chemical space match those of their field counterparts; (ii) GCs from different individual accreted subgroups occupy the same locus in chemical space. This could either mean that they share a sim- ilar origin or that they are associated with distinct satellites which underwent similar chemical enrichment histories; (iii) The chemical compositions of the GCs associated with the low orbital energy subgroup defined by Massari and collaborators is broadly consistent with an in situ origin. However, at the low metallicity end, the distinc- tion between accreted and in situ populations is blurred; (iv) Regarding the status of GCs whose origin is ambiguous, we conclude the following: the position in Si-Fe plane suggests anin situ origin for Liller 1 and a likely accreted origin for NGC 5904 and NGC 6388. The case of NGC 288 is unclear, as its orbital properties suggest an accretion origin, its chemical composition suggests it may have formedin situ.
Key words: Galaxy: Globular Cluster —- Galaxy: Formation —- Galaxy: Milky Way
©2019 The Authors
arXiv:2001.03177v4 [astro-ph.GA] 14 Feb 2020
1 INTRODUCTION
In a ΛCDM cosmology, galaxies grow in mass due to the process of hierarchical assembly, whereby low-mass struc- tures merge together to form the galaxies we observe in the local universe. The signature of this process can be identified in the Milky Way, in the form of halo stellar streams ( e.g.,Helmi et al. 1999;Belokurov et al. 2006;Ibata et al. 2016), substructure in phase space, such as the Gaia- Enceladus/Sausage system (GE/S, Belokurov et al. 2018;
Haywood et al. 2018; Helmi et al. 2018; Mackereth et al.
2019), and ongoing accretion, such as the Sagittarius dwarf spheroidal (Sgr dSph,Ibata et al. 1994).
The satellites involved in such merger events naturally brought with them a cohort of globular clusters (GCs) ( e.g., Pe˜narrubia et al. 2009), which survived the tidal interaction with the central halo and today are an integral part of the Galactic GC system. For decades, this has been the focus of various studies (e.g.,Searle & Zinn 1978;Fall & Rees 1985;
Ashman & Zepf 1992;Brodie & Strader 2006), aiming at us- ing age, chemical composition, and phase-space information in order to, on one hand, understand the origin of the Galac- tic GC system, and on the other constrain the early history of mass assembly of the Milky Way. Key to that enterprise is to discern which of the Galactic GCs were formedin situ and which were accreted. In the last decade, the availabil- ity of precise ages (Mar´ın-Franch et al. 2009;VandenBerg et al. 2013) has led to the discovery of the bifurcation in the age-metallicity relation of Galactic GCs (Mar´ın-Franch et al. 2009; Forbes & Bridges 2010; Leaman et al. 2013), which, combined with results from high-resolution hydrody- namical cosmological simulations of Milky Way analogues, has further constrained the origin the Galactic GC system (Kruijssen et al. 2019; Myeong et al. 2019). Furthermore, the advent of the Gaia survey (Gaia Collaboration et al.
2018), and the resulting precise 6D phase-space information have made possible a much better characterization of the properties of the Galactic GC system.
Along those lines, a recent study byMassari et al.(2019) presented a new classification of the Galactic GC system in terms of the kinematic properties of its members. By study- ing their distribution in integral of motions (hereafter, IOM) space, Massari et al. (2019) established an association of each GC to one of the following main groups: Main Disk (MD), Main Bulge (MB), Gaia Enceladus (GE), Sagittar- ius (Sag), Helmi Streams (H99), Sequoia (Seq), Low Energy (LE) and High Energy (HE).
The 16th data release of the Sloan Digital Sky Survey (DR16 Ahumada et al. 2019) includes data for over 450k stars from the APOGEE survey (Majewski et al. 2017), placing us in an advantageous position to obtain detailed chemical-abundance information for stars that are members of a significant fraction of the total Galactic GC population (M´esz´aros et al. 2015;Schiavon et al. 2017b;M´esz´aros et al.
2018; Masseron et al. 2019; Nataf et al. 2019). Such data will substantially further our understanding of the origin of the Galactic GC system, and in the process will help con- strain the assembly history of the Milky Way. In this paper, we present an examination of the chemical properties of the GC groups identified byMassari et al.(2019). Our goal is to check whether subgroups that are defined purely on the basis of orbital properties can also be distinguished in terms
of their chemical properties. In the process it is also possible to verify whether the chemical compositions are consistent with the star formation and chemical enrichment histories expected from the systems they are associated with.
This paper is structured as follows. In Section 2, we briefly describe our data. In Section3, we describe the sam- ple used and the criteria adopted to define GC membership, and in Section4, we present the results obtained from the examination of the chemical properties of the kinematically defined GC groups. Section5 summarizes our results and conclusions.
2 DATA
We use data from the sixteenth data release of SDSS- IV (Ahumada et al. 2019), which contains refined elemen- tal abundances (J¨onsson et al. 2019, submitted.) from the APOGEE-2 survey (Majewski et al. 2017), which is one of four SDSS-IV (Blanton et al. 2017) experiments. APOGEE- 2 is a near-infrared high-signal-to-noise ratio (S/N > 100 pixel−1), high-resolution (R ∼22,500) spectroscopic survey of over 450,000 Milky Way stars in the near-infrared H Band (1.5–1.7 µm). Observations were based on two twin NIR spectrographs (Wilson et al. 2019) attached to the 2.5 m telescopes at Apache Point (Gunn et al. 2006), and Las Campanas Observatories. Targets were selected in gen- eral from the 2MASS point-source catalogue, employing a dereddened (J−K s) ≥ 0.3 colour cut in up to three ap- parent H magnitude bins. Reddening corrections were de- termined using the Rayleigh-Jeans Colour Excess method (RJCE; Majewski et al. 2011), based on NIR photometry from the 2MASS point source catalogue (Skrutskie et al.
2006), and mid-IR data from the Spitzer-IRAC GLIMPSE- I,-II, and -3D (Churchwell et al. 2009) when available from WISE (Wright et al. 2010). A more in-depth description of the APOGEE survey, target selection, raw data, data re- duction and spectral analysis pipelines can be found inMa- jewski et al.(2017),Holtzman et al.(2015), Nidever et al.
(2015),Garc´ıa P´erez et al.(2016),J¨onsson et al.(2018),Za- sowski et al. (2017), respectively. All the APOGEE data products used in this paper are those output by the stan- dard data reduction and analysis pipeline. The data are first processed (Nidever et al. (2015) & J¨onsson et al, in prep.) before being fed into the APOGEE Stellar Param- eters and chemical-abundances Pipeline (ASPCAP;Garc´ıa P´erez et al. 2016, J¨onsson et al in prep). ASPCAP makes use of a specifically computed spectral library (Zamora et al.
2015;Holtzman et al. 2018, and J¨onsson et al, in prep), cal- culated using a customisedH-band line-list (Shetrone et al.
2015, Cunha et al., in prep.), from which the outputs are analysed, calibrated, and tabulated (Holtzman et al. 2018).
3 GLOBULAR CLUSTER SAMPLE AND MEMBERSHIP
3.1 Main sample
In this subsection, we describe the method employed for de- termining the GC sample in APOGEE DR16. We build on previous work that has derived a GC sample in earlier data releases of APOGEE (M´esz´aros et al. 2015;Schiavon et al.
2017b; Nataf et al. 2019) and use the GC catalogues from Harris (1996),Baumgardt & Hilker(2018) andBaumgardt et al. (2019) in order to establish GC membership of stars in the DR16 sample. The methodology employed for identi- fying GC members is two-fold: the first step comprises the determination of an initial sample based on the values from the aforementioned catalogues. For this, we make use of data on GC positions (Galactic latitude and longitude), radial ve- locities, the radial velocity dispersions, tidal radii and mean metallicity values.
We use these values, and the values provided by APOGEE DR16 catalogue, to associate any star to be a member of a GC if:
i)
[Fe/H]?− h[Fe/H]GCi ≤0.5 ii)
rv?− hrvGCi
≤ 2σGC iii) dpr o j ≤ 2rvir
where [Fe/H] is the iron abundance, rv? is the stellar he- liocentric radial velocity,σGCis the cluster’s radial velocity dispersion,dpr o j is the projected distance between the star and the GC centre, and rvir is the cluster’s tidal radius.
For GCs which are known to present a spead in metallicity (namely, NGC 6715, Terzan 5 and ω Cen), criterion i) was ommitted.
The GC iron abundances and centre coordinates were extracted from the 2010 edition of the Harris catalogue (Harris 1996), whereas the GC radial velocities, velocity dispersions, and tidal radii were obtained from the latest versions of the Baumgardt & Hilker catalogue1,2 (Baum- gardt & Hilker 2018; Baumgardt et al. 2019). The stellar data come from APOGEE.
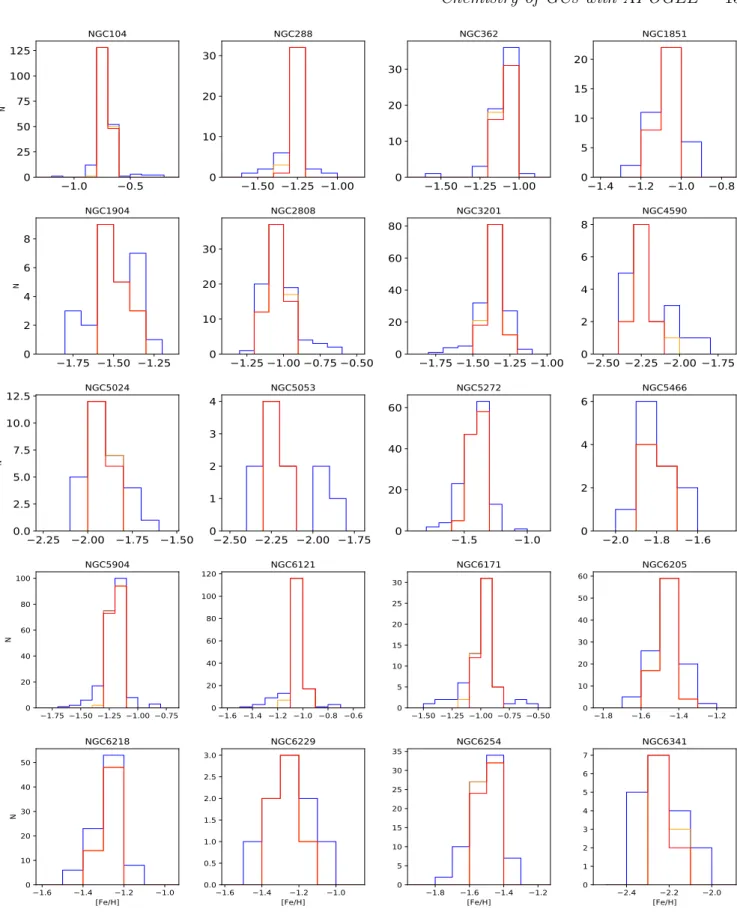
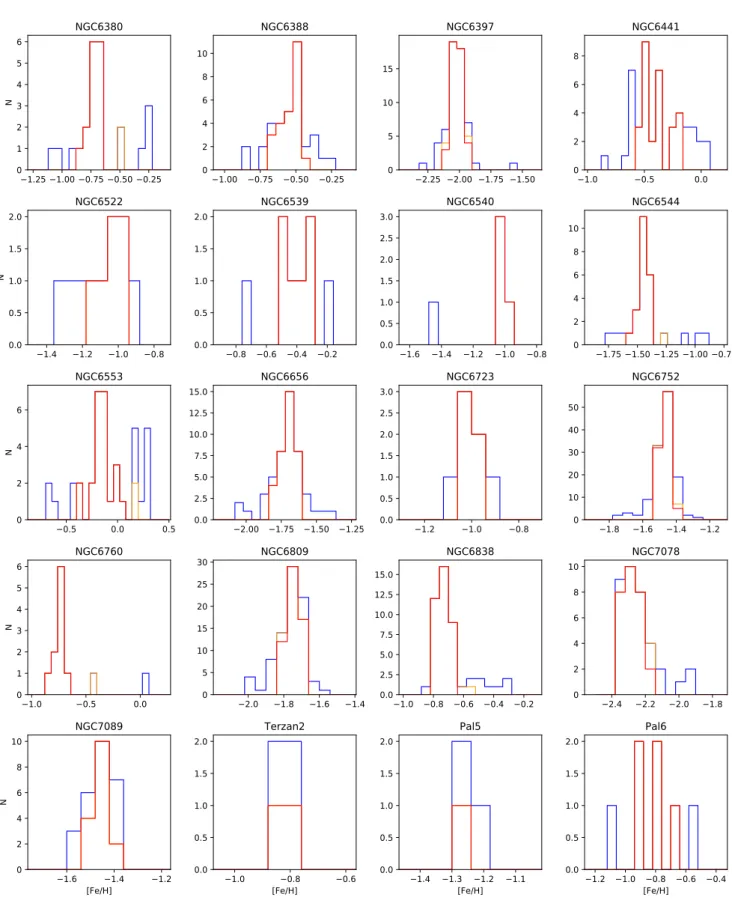
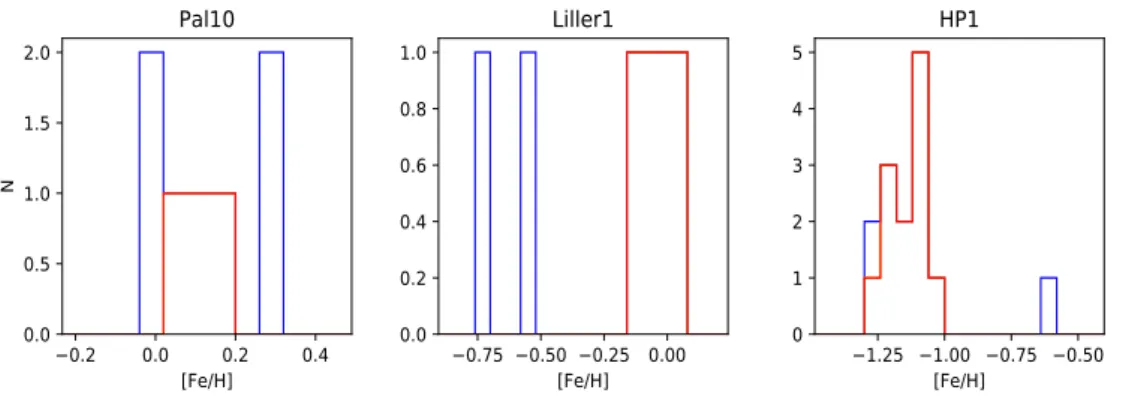
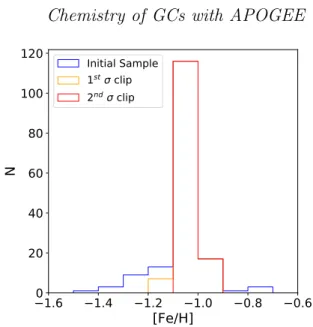
The first step of the procedure consisted of the applica- tion of criteria(i)to(iii)above, which yielded a preliminary sample of ∼3,650 stars. Having obtained this preliminary sample, the second step involved examining the metallicity distribution functions (MDFs) of the candidates selected in the first pass, which adopted a very broad [Fe/H] search in- terval. If the MDF peaked at a value within 0.3 dex from the Harris catalogue value, and the distribution did not present tails of more than 0.3 dex away from the mean [Fe/H] value, all candidates were deemed GC members. For those cases in which the MDF peaked within 0.3 dex of the Harris cata- logue value, but presented a broader, less peaked, distribu- tion, the sample was further cleaned throughσ-clipping, as follows. We computed the mean and standard deviation of the [Fe/H] values, and then conducted the σ-clipping pro- cedure by removing any member candidates that presented [Fe/H] abundances 1 σ away from the mean. However, for most GCs the resulting clipped MDF still presented tails in the distribution, so we had to perform a secondσclipping, removing stars that deviated from the mean [Fe/H] value by more than 2 times the newly computedσ value. Figure 1 illustrates theσ-clipping method employed and how success- fully it works in defining GC candidate members from our
1 http://physwww.mcmaster.ca/~harris/mwgc.dat
2 https://people.smp.uq.edu.au/HolgerBaumgardt/globular/
1.6 1.4 1.2 1.0 0.8 0.6
[Fe/H]
0 20 40 60 80 100 120
N
Initial Sample 1
stclip 2
ndclip
Figure 1. Example of theσ-clipping method employed to deter- mine GC candidate members from our initial sample. The mean metallicity value from the Harris catalogue for NGC 6121 is [Fe/H]
= –1.16, which lies very close to the peak of the distribution of our sample.
initial sample, removing any false positives. For a full visual- ization of all the MDF cuts performed on the 43 GCs in our final main GC sample and the resulting radial velocity distri- bution, see Appendix A. We found that, by conducting this methodology, we were able to minimise false positives and obtain a reliable sample of GC members in APOGEE DR16.
For 11 GCs from our original sample, fewer than 3 star mem- bers could be identified, so these GCs were removed from consideration. The final sample contained 3,090 stars, asso- ciated with 46 GCs. Our selection procedure is quite conser- vative and likely excludes GC members. However, sample purity is more important for our goals than completeness.
The mean elemental abundances,rv values, and associated standard deviations for the member stars for each GC are listed in Table1. For GCs with large [Fe/H] spreads (namely, ωCen, NGC 6715 and Terzan 5), mean abundances are not entirely meaningful. Moreover, in such cases the mean abun- dance ratios do not necessarily reflect those of the environ- ments the GCs were born. Therefore, we removed these clus- ters from consideration. With this additional cut, our final working sample contains 1728 stars associated with 43 GCs.
Recently, M´esz´aros et al. (2019) performed a careful GC membership analysis, obtaining a sample that is very similar to ours. They proceeded to study star-to-star inter- nal abundance variations in GCs, with data based on the BACCHUS (Masseron et al. 2016) abundance pipeline. We have repeated our entire analysis adopting both (M´esz´aros et al. 2019) member sample and abundances and obtained the same results as presented in this paper.
3.2 Globular cluster groups
In this subsection we briefly discuss how the GCs in our sample are distributed across the kinematic groups defined byMassari et al.(2019) (see Fig 2). From our main sam- ple of 43 GCs, we find that 9 can be associated to the MD group, 10 to the MB, 9 to the GE dwarf spheroidal, 5 to the
Name <[Fe/H]> <[Si/Fe]> <Vl o s> Name <[Fe/H]> <[Si/Fe]> <Vl o s>
NGC 104 – 0.72±0.04
0.23±0.04 –18.8±7.3 NGC 6397 – 2.02±0.04
0.3±0.06 19.5±2.8
NGC 288 – 1.26±0.04
0.29±0.03 –44.5±2.2 NGC 6441 – 0.39±0.12
0.13±0.13 10.8±15.3
NGC 362 – 1.09±0.04
0.13±0.04 223.6±5.3 NGC 6522 – 1.04±0.06
0.22±0.10 –12.8±7.6
NGC 1851 – 1.07±0.04
0.14±0.05 320.7±5.9 NGC 6539 – 0.39±0.09
0.2±0.07 33.8±4.4
NGC 1904 –1.5±0.07 0.15±0.04 207.4±2.6 NGC 6540 – 1.01±0.03
0.21±0.04 –14.4±1.1
NGC 2808 – 1.04±0.06
0.15±0.06 103.4±8.4 NGC 6544 – 1.44±0.05
0.22±0.04 –38.6±4.6
NGC 3201 – 1.35±0.05
0.16±0.04 495.4±3.3 NGC 6553 –0.16±0.1 0.09±0.07 0.2±9.5
NGC 4590 – 2.24±0.07
0.33±0.05 –94.0±3.2 NGC 6656 – 1.69±0.05
0.29±0.11 – 146.6±5.6 NGC 5024 –
1.92±0.04
0.25±0.08 –60.8±3.4 NGC 6715 — — —
NGC 5053 – 2.15±0.15
0.38±0.09 42.9±1.3 NGC 6723 –1.0±0.06 0.25±0.03 –93.5±3.4
ωCen — — — NGC 6752 –
1.47±0.03
0.25±0.05 –26.3±4.7
NGC 5272 –1.4±0.06 0.17±0.07 – 146.2±4.1
NGC 6760 –0.71±0.1 0.19±0.05 –1.5±5.8
NGC 5466 – 1.78±0.06
0.19±0.12 108.1±1.0 NGC 6809 – 1.75±0.04
0.23±0.05 176.1±3.6
NGC 5904 – 1.19±0.05
0.18±0.05 53.8±4.9 NGC 6838 – 0.73±0.04
0.22±0.03 –22.7±2.1
NGC 6121 – 1.04±0.03
0.34±0.04 70.9±3.4 NGC 7078 – 2.28±0.05
0.31±0.07 – 104.3±5.2 NGC 6171 –
0.97±0.06
0.32±0.08 –33.8±3.1 NGC 7089 – 1.46±0.06
0.19±0.07 –3.6±5.5
NGC 6205 – 1.46±0.04
0.21±0.07 – 246.3±5.2
Terzan 2 – 0.82±0.05
0.26±0.02 133.2±1.4
NGC 6218 – 1.26±0.03
0.26±0.05 –40.7±3.1 Terzan 5 — — —
NGC 6229 – 1.25±0.05
0.19±0.06 – 137.8±2.7
Pal 5 –
1.24±0.02
0.11±0.04 –58.9±0.5
NGC 6254 – 1.49±0.04
0.27±0.05 75.8±3.9 Pal 6 –
0.81±0.09
0.28±0.07 172.9±2.3
NGC 6341 – 2.22±0.03
0.31±0.07 – 118.2±6.7
Pal 10 0.09±0.06 0.0±0.01 –32.7±4.9
NGC 6380 – 0.72±0.05
0.21±0.02 –1.8±7.8 Liller 1 – 0.03±0.05
0.01±0.05 61.8±3.5
NGC 6388 – 0.54±0.06
– 0.03±0.1
80.1±10.5 HP 1 –
1.14±0.07
0.22±0.06 40.9±4.8
Table 1.From left to right, GC name, mean [Fe/H], mean [Si/Fe], and mean radial velocity obtained for the final list of GCs in the main GC sample from APOGEE DR16.
Name E LZ Name E LZ [km2/s2] [103 kpc *
km/s]
[km2/s2] [103 kpc * km/s]
NGC 104 –50892+74−94 0.62+0.01−0.01 NGC 6397 –66705+193−190 0.33+0.01−0.01 NGC 288 –41116+−9471125 –0.34+−0.030.03 NGC 6441 –93869+−34792812 0.21+−0.030.03 NGC 362 –41406+−13911436 –0.07+−0.010.01 NGC 6522 –
129873+−7371043
0.01+−0.010.01
NGC 1851 –21934+537−521 –0.22+0.02−0.04 NGC 6539 –88145+1367−1378 –0.18+0.00−0.00 NGC 1904 –26641+−650655 –0.17+−0.040.05 NGC 6540 –
108006+1814−2001
0.18+−0.010.01
NGC 2808 –39859+−690541 0.13+−0.010.01 NGC 6544 –85401+−386474 –0.07+−0.020.02 NGC 3201 6964+−14021307 –1.65+−0.020.02 NGC 6553 –
101735+−18832577
0.25+−0.020.02
NGC 4590 –1010+1311−801 1.27+0.02−0.01 NGC 6656 –49027+204−294 0.47+0.01−0.01 NGC 5024 –14407+851−861 0.33+0.01−0.02 NGC 6715 22391+3784−3525 0.79+0.01−0.01 NGC 5053 –18934+−645925 0.29+−0.020.02 NGC 6723 –85738+−1010958 –0.02+−0.010.01 ωCen –66584+413−271 –0.35+0.01−0.01 NGC 6752 –69155+484−522 0.41+0.01−0.01 NGC 5272 –26985+−549454 0.42+−0.010.01 NGC 6760 –78723+−265322 0.34+−0.010.01 NGC 5466 18295+−31702946 –0.54+0.04−0.04 NGC 6809 –69856+220−212 0.09+0.01−0.01 NGC 5904 –4945+2821−2685 0.16+0.01−0.01 NGC 6838 –56897+99−92 0.67+0.00−0.00 NGC 6121 –78561+−377289 –0.07+−0.020.02 NGC 7078 –44942+−912811 0.55+−0.020.02 NGC 6171 –93415+−259343 0.06+−0.010.01 NGC 7089 –24793+−16451316 –0.15+−0.030.04 NGC 6205 –55754+314−363 –0.2+0.01−0.01 Terzan 2 –
142240+1564−1992
–0.04+0.00−0.00
NGC 6218 –9536+−819878 0.06+−0.130.11 Terzan 5 –
139676+2229−2447
–0.02+−0.010.01
NGC 6229 –77618+−442518 0.24+−0.010.01 Pal 5 –9666+−27223131 0.88+−0.080.08 NGC 6254 –76969+−537692 0.25+−0.010.01 Pal 6 –96285+−17441413 –0.01+−0.010.00 NGC 6341 –49372+809−728 –0.05+0.01−0.01 Pal 10 –59725+733−648 0.60.01−0.01 NGC 6380 –
105529+3090−2754
–0.02+−0.010.01 Liller 1 – –
NGC 6388 –
101561+−14861853
–0.13+−0.010.01 HP 1 –
114308+−30125219
–0.01+−0.010.01
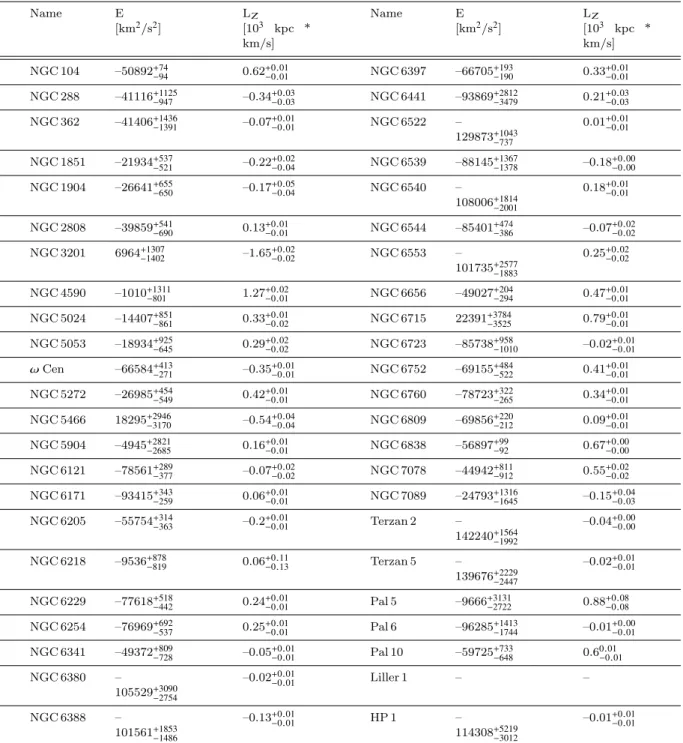
Table 2.From left to right, GC name, mean orbital energy, and mean angular momentum obtained for the final list of GCs in the main GC sample from APOGEE DR16 using theMWPotential2014(Bovy 2015). There is no 6D phase-space information for Liller 1 provided inVasiliev 2019, thus we are unable to obtain IOM for this GC.
H99, 6 to the LE group and 1 to the Seq dwarf spheroidal.
An additional 5 GCs from our sample could not be un- ambigously associated to a single group by Massari et al.
(2019). The GC NGC 3201 could be associated to either of the GE or Seq group, NGC 5904 could belong to either GE or H99, and Liller 1 is listed as unclassified. Similarly, NGC 6388 is originally classified as a MB GC by (Massari et al. 2019). However, recent work has shown that NGC 6388 can be associated to the Sequoia accretion event based on its eccentric-retrograde orbit (Myeong et al. 2019). For this work, we initially follow theMassari et al.(2019) classifica-
tion and include NGC 6388 in the MB subgroup, and study its chemical-abundances in order to discern if this GC is fromin situ or accreted origin. Along the same lines, since it has recently been shown that NGC 3201 could be associ- ated kinematically to the Sequoia dwarf remnant (Myeong et al. 2019), we choose to include these GCs in the Seq group.
The remaining two GCs for whichMassari et al.(2019) do not find a clear subgroup association (namely, NGC 5904 and Liller 1) are initially marked as unclassified and are dis- cussed in Section4.3. For the final list of the GCs obtained
1.5 1.0 0.5 0.0 0.5 1.0
LZ [103 kpc * km/s]
150000 125000 100000 75000 50000 25000 0 25000
E [km2/s2]
MBMD GESEQ H99LE SAGNGC6388 NGC288 Pal10 NGC5904
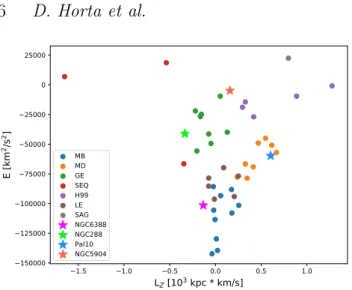
Figure 2. Orbital energy and vertical action as a function of orbital azimuthal action for the 46 GCs obtained in our initial main sample, divided into the kinematic associations identified byMassari et al.(2019).
in the main sample and the kinematic group association see Table3.
3.3 Elemental abundances and orbital parameters In this paper, we report an examination of the APOGEE DR16 chemical-compositions for GCs from various sub- groups. Specifically, we focus on studying trends in α- element abundances as a function of [Fe/H] to gain insights into the nature of the subgroups. Our goal is to examine how the kinematic classification by Massari et al. (2019) maps into chemical composition space. In so doing we ex- pect to constrain the nature of the progenitors of the various sub-systems making up the Galactic halo, given the relation between chemical compositions stellar populations and their histories of star formation and chemical enrichment. This also makes possible a more clear distinction between GCs formedin situfrom those belonging to accreted systems
We focus on calibrated abundances (J¨onsson et al.
2018), which have been compared in detail with independent determinations by other groups. Of relevance to this work, J¨onsson et al. (2018) show that Si abundances, although differing from those of some of the other groups by statisti- cally significant zero-point shifts, show no trends with stellar parameters. Since our results depend fundamentally on rel- ative differences between abundances from a homogeneous set, such small zero-point effects are not important. Theα- element of choice for this study is silicon. We use the [Si/Fe]
abundances, as silicon has been shown in previous data re- leases to be one of the most reliableα-abundance measure- ments in APOGEE (J¨onsson et al. 2018). Magnesium is another α-element for which APOGEE provides exquisite abundances, however it is affected by internal GC evolution (e.g., Bastian & Lardo 2018), so we remove it from con- sideration when using the main sample. In order to verify that our choice ofα-element does not affect our conclusions, we performed the analysis adopting [Mg/Fe] from first pop- ulation stars and found that our results are unchanged. In addition, we compared our mean [Si/Fe] with those from the
compilation byPritzl et al.(2005), finding our values to be slightly lower, of the order of∼0.1 dex. Again, such a small zero-point difference has no impact on our results.
Orbital parameters were estimated for our sample of GCs as follows. We calculated the action integrals for each of the 46 GCs using the potential defined by Bovy (2015, MWPotential2014), using the publicly available codegalpy
3 (Bovy 2015;Mackereth & Bovy 2018). In order to obtain reliable kinematic measurements, we draw 100 samples for each of the 6-D phase-space parameters given by the GC table inVasiliev(2019), and obtain 100 estimates of the or- bital parameters for each cluster, for which we then take the median and standard deviation as our value and associ- ated uncertainty. Fig.2displays the energy (E) values ob- tained using this method as a function of the azimuthal ac- tion (LZ) for all the GCs in our main sample, colour-coded by subgroup association. Highlighted as star symbols are GCs which display peculiar [Si/Fe] when compared to the re- maining GCs in the same subgroup. We find that our orbital energy values differ from those ofMassari et al.(2019). Such differences can be traced back to the adoption of different Galactic potentials with different total masses—whileMas- sari et al.(2019) adopted a McMillan potential (McMillan 2017), the one adopted in this work was MWPotential2014 (Bovy 2015). We assessed the impact of Galactic potential choice on our results by re-running the calculations using the McMillan potential, and found that the GC associations to the various subgroups were unchanged, and are consistent with those found inMassari et al.(2019).
4 RESULTS
4.1 Disc, Bulge and Low Energy GCs
In Fig.3we show the mean [Si/Fe] chemical-abundance mea- surements as a function of [Fe/H] for the MD (blue symbols), MB (orange symbols) and LE (red symbols) kinematically identified subgroups. Also plotted are the data for the GC Liller 1 (yellow dot), which is discussed in Section4.3. At first glance the three subgroups occupy roughly the same locus in [Si/Fe] space, resembling the region of abundance space occupied by field stars from the disc and bulge compo- nents of the Milky Way (e.g.,Hayden et al. 2015). Within the errors, the MD population displays a low-metallicity [Si/Fe]
plateau until reaching [Fe/H] abundance values of approx- imately [Fe/H] ' −0.6, for which according to the Milky Way’s Disc field population, we would expect a knee towards lower [Si/Fe] values (Alves-Brito et al. 2010). When consid- ered in aggregate, the three subgroups display a clear knee at about [Fe/H]∼–0.8, with a plateau at [Si/Fe]∼+0.25 at lower metallicities and a trend of decreasing [Si/Fe] for increas- ing [Fe/H] at [Fe/H]>∼–0.8, which mimics the behaviour of field stars. One GC deviates clearly from this trend, namely NGC 6388, with very low [Si/Fe]∼0.0 at [Fe/H]∼– 0.5. We discuss this interesting GC separately in Section4.4.
When the three subgroups are considered separately, however, the relatively small number of GCs in our sample prevents the unequivocal identification of a “knee” in the Si- Fe plane for any of the subgroups in Figure3. In the case
3 http://github.com/jobovy/galpy
Kinematic Group Associated GCs
Main-Disc NGC 7078(30), NGC 6760(11), NGC 6838(37),
NGC 6218(62), NGC 6397(46), NGC 6752(97), NGC 104(176), NGC 6656(35), Pal 10(3)
Main-Bulge NGC 6539(6), NGC 6171(51), Terzan 2(4), NGC 6553(23),
NGC 6380(15), NGC 6522(6), NGC 6388(24), NGC 6540(4), NGC 6723(7), HP 1(12)
Gaia-Enceladus NGC 1904(17), NGC 2808(66), NGC 6205(80),
NGC 6229(6), NGC 6341(10), NGC 362(49), NGC 7089(26), NGC 1851(30), NGC 288(35), NGC 5904(167)
Sequoia NGC 5466(7), NGC 3201(114),NGC 6388(24)
Sagittarius —
Helmi streams NGC 5024(18), NGC 5053(11), NGC 4590(13),
NGC 5272(110), Pal 5(3),NGC 5904(167)
Low-Energy NGC 6809(60), Pal 6(5), NGC 6441(28), NGC 6121(140),
NGC 6254(59), NGC 6544(21)
High-Energy –
XXX Liller 1(4)
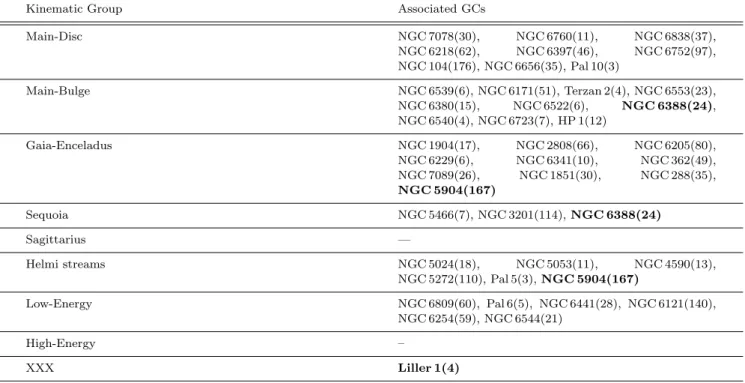
Table 3.GCs obtained in APOGEE DR16 associated to the kinematic subgroups as defined inMassari et al.(2019), after removing GCs with less than 3 star members. The GCs highlighted in bold are associations that are uncertain. The number of APOGEE member stars associated to each GC are given in parentheses.
of the MB subgroup, the sample does not contain enough GCs at [Fe/H]<∼– 0.8 to firmly establish the existence of a low metallicity [Si/Fe] plateau. The LE subgroup straddles properly both [Fe/H] sides of the “knee” and the GCs seem to follow the same trend as the field population, but the sample is too small for a solid conclusion. The sample for the MD subgroup covers a wide range in [Fe/H] towards the metal- poor side of the knee, but contains only one GC on the metal- rich end, whose position on the Si-Fe is consistent with the existence of a knee in that subgroup. Again, the sample is not large enough at [Fe/H]>∼– 0.8 for a robust conclusion. The GC on the metal-rich end of the MD subgroup is Pal 10. We checked to see whether the orbital properties of this cluster match those of the MD GC population. In Fig 2 we show that Pal 10 does follow a disc-like orbit, displaying energy values of E∼–6000 km2/s2 and following a prograde orbit (i.e. LZ ∼0.7 103 kpc km/s), therefore it is likely to belong to the MD subgroup. All in all, the MB and MD subgroups follow the trend defined by the field population, thus we conclude that these subgroups share anin situorigin.
Since the origin of the LE subgroup is contentious, the locus of GCs from that subgroup merits some attention. Our results show that the GCs from this subgroup occupy the same locus in [Si/Fe] vs [Fe/H] space as the MD/MB GCs.
This result is in line with the similarity of these subgroups in E-LZ space, (see Fig.2of this paper and Fig. 3 ofMassari et al. 2019) We note, however, that at [Fe/H] <∼ −1.5 it is almost impossible to distinguish between accreted and in situ GCs in the Si-Fe plane, so that an accreted origin for the three most metal-poor GCs in the LE group (namely, NGC 6254, NGC 6544 and NGC 6809) cannot be ruled out.
In summary, from the point of view of kinematics, the low energy defining this subgroup makes it hard to distin-
guish it from the MD/MB subgroups (Fig.2). On the ba- sis of the chemistry, while the metal-rich GCs NGC 6441, Pal 6 and NGC 6121 are clearly associated with the the MD/MB subgroups, the association of the more metal-poor GCs NGC 6254, NGC 6544 and NGC 6809 is more uncer- tain, given that accreted andin situGCs occupy the same locus in the Si-Fe plane for those metallicities. We conclude that, while the overal trend on the Si-Fe plane of the LE GCs in our sample suggests anin situorigin, the position of that subgroup in IOM space does not preclude some of the members of that category having an accreted origin.
Finally, we highlight the case of NGC 6388. Although that GC is classified byMassari et al.(2019) as belonging to the MB subgroup, it is characterized by very low [Si/Fe]
(∼–0.03), departing by∼2σ from the mean [Si/Fe] of that subgroup at [Fe/H]∼–0.5. We discuss this GC in more detail in Section4.4.
4.2 Accreted subgroups
In this subsection, we examine the distribution of GCs of accreted origin in the Si-Fe plane. Our analysis focuses on the following subgroups: H99, GE, and Seq.
The data for these GCs are displayed in Fig 4. We first focus on a comparison between the positions occupied by the accreted andin situclusters. Our results show that the GCs associated with the three putative accreted systems all fall on the same locus in the [Si/Fe] plane, positioned on average at lower [Si/Fe] values than the MD and MB popu- lation (illustrated in Fig 4as grey points). This is commonly interpreted as the result of a history of star formation and chemical enrichment typical of low-mass galaxies, which dif-
2.5 2.0 1.5 1.0 0.5 0.0 [Fe/H]
0.2 0.1 0.0 0.1 0.2 0.3 0.4 0.5 0.6
[Si/Fe]
LE GCs MD GCs MB GCs Liller1
100 101 102
log
10(N )
Figure 3.Mean [Si/Fe] vs [Fe/H] chemical-abundances for the Low Energy (red), Main Bulge (orange) and Main Disc (blue) GC subgroups, illustrated alongside Liller 1 (yellow), with the 1σspread represented in black error bars. In grey we show the Galactic disc and bulge field populations defined kinematically according toMassari et al.(2019). From these abundance plots, by accounting for the 1σspread uncertainties, we find that the more [Fe/H] rich LE GCs, namely NGC 6121, NGC 6441 and Pal 6 can be categorized to be fromin situorigin. The other three LE GCs still occupy the same locus as the MD/MB subgroups, how- ever due to their low [Fe/H] abundances and position in the IOM space (Fig 2), it is possible that these more metal-poor GCs could be from an accreted origin. Furthermore, we find that Liller 1 oc- cupies the same locus as thein situGCs, which coupled with its high [Fe/H] value can be classified as a MB GC.
fers from that of the Milky Way (e.g.,Tolstoy et al. 2009).
The accreted origin of the GCs that are kinematically as- sociated with GE, H99 and Seq is further confirmed by the fact that their position in the [Si/Fe] plane mimics that of field populations linked with past accretion events (Hayes et al. 2018;Mackereth et al. 2019). We calculate the mean [Si/Fe] abundace given by GCs in the –1.5<[Fe/H] <–1 regime for both our accreted and in situ populations, and find that the accreted groups display on average [Si/Fe] = +0.17±0.05, whereas thein situsubgroups display a higher average abundance [Si/Fe] = +0.25±0.03. This means that the two distributions differ at the∼91.5% level.
Having established that the accreted subgroups occupy a locus of lower [Si/Fe] than that ofin situpopulations, we now turn to a discussion of the relative positions of the GCs from the three accreted subgroups in the Si-Fe space. As pointed out above, the GCs associated with the GE, H99, and Seq subgroups occupy the same locus on the abundance plane, within the errors. Such similarity in chemical space can be understood in two possible ways. On one hand, the different accreted subgroups may be associated to three sep- arate similar-mass satellites. Alternatively, some, or perhaps all of them, could be part of the same accreted satellite.
Consideration of the kinematic properties of the three sys- tems may help distinguish between these scenarios. The GE system is strongly bound and mildly retrograde, whereas the other two groups are slightly less bound, with Seq be- ing strongly retrograde and H99 strongly prograde.Massari
et al.(2019) argue that two of the GCs associated with the Sequoia system (namely, NGC 3201 andω Cen) have a rel- atively high probability of belonging to GE. Moreover, they point out that the Sequoia system’s position in IOM space coincides with that of debris thatHelmi et al.(2018) ascribe to Gaia-Enceladus.
Along the same lines,Massari et al.(2019) analysed the Helmi stream GCs employing the methodology described in Koppelman et al. (2019b), and found that, when ac- counting for the age uncertainties, H99 occupies a locus in age-metallicity space that is consistent with the Gaia- Enceladus and Sequoia GC subgroups. Moreover, it has been shown that the field populations of theGaia-Enceladus, Se- quoia, and Helmi Stream occupy the same locus in [Mg/Fe]
vs [Fe/H] and [Al/Fe] vs [Fe/H] planes (Koppelman et al.
2019a), and that the Helmi Stream displays an MDF which peaks at a value of [Fe/H]∼–1.5 (Koppelman et al. 2019b), similar to value at which the Gaia-Enceladus MDF peaks (Helmi et al. 2018;Mackereth et al. 2019).
We conclude that the combined evidence from GC subgroup chemistry and kinematics is suggestive of either a common origin for the Sequoia, Helmi Stream and Gaia-Enceladus stellar systems, or that these subgroups are associated with satellites which underwent similar chemical enrichment histories.
In closing this subsection we comment on the interest- ing case of NGC 288. On the basis of kinematics, Massari et al.(2019) assign it unambiguously to the GE subgroup, with a retrograde orbit and high orbital energy (see Fig2).
However, its elemental abundances place it squarely on the in situbranch,∼2σoff the mean of the GE subgroup at the same [Fe/H]. We checked to see if this result survives when other α-elements are considered, and find that NGC 288 also displays [Mg/Fe] and [Ca/Fe] values∼2σ away from the mean of the GE subgroup, with the GE subgroup pre- senting mean values of h[Mg/Fe]iGE = +0.17 ±0.07 and h[Ca/Fe]iGE = +0.19±0.04, respectively, and NGC 288 dis- playing [Mg/Fe]N GC288= +0.31±0.04 and [Ca/Fe]N GC288
= +0.26±0.09, for the same [Fe/H]. It is difficult to recon- cile the orbital and chemical properties of NGC 288, so we suggest that NGC 288 is likely an accreted GC with a pecu- liar chemical composition.
4.3 NGC 5904 and Liller 1
The study byMassari et al. (2019) did not assign Liller 1 to any particular kinematic subgroup, and concluded that NGC 5904 could be associated with either the GE or H99 subgroup. In this subsection we examine these GCs’ posi- tions in chemical space to see whether that information can help clarify whether they have an accreted orin situorigin.
We first compare the [Si/Fe] vs [Fe/H] abundance measurements obtained for Liller 1 with the other identified subgroups (see Fig. 3). Our results show that within the uncertainties, Liller 1 occupies the same locus in the [Si/Fe]
vs [Fe/H] abundance plane as the in situ population, and therefore belongs to either the MD or MB subgroup.
Unfortunately, there is no 6D phase-space information for Liller 1 (seeVasiliev 2019, for details), and therefore we are unable to place kinematic constrains on the origin of this GC. Furthermore, Liller 1 is quite metal rich, with a mean
2.5 2.0 1.5 1.0 0.5 0.0 [Fe/H]
0.2 0.1 0.0 0.1 0.2 0.3 0.4 0.5 0.6
[Si/Fe]
SEQ GCs MB/MD GCs Helmi Streams GCs
GE GCs NGC5904 NGC6388
Figure 4.Mean [Si/Fe] vs [Fe/H] for the GE (cyan), Seq (green), H99 (purple) and MD/MB (grey) GC subgroups, illustrated alongside NGC 5904 (red) and NGC 6388 (magenta), with the 1 σspread represented in black error bars. In grey we show the halo field population defined as inMassari et al.(2019). The GE, Seq and H99 accreted dwarf spheroidal subgroups occupy the same locus, displaying lower mean [Si/Fe] values to the GCs from the MD and MB populations at the same metallicity range –1.5 <
[Fe/H]<–1. According to galaxy chemical-evolution models, this suggests that either: both accreted dwarf spheroidals must have had a similar chemical-evolution history and therefore have been of similar mass, or that some, possibly all, originate from the same accretion event. Below [Fe/H]<–1.5, thein situ and ac- creted groups are indistinguishable in the Si-Fe plane. NGC 288 displays higher [Si/Fe] values than the rest of the GE subgroup GCs (∼0.15 dex greater) of similar metallicity, however displays a clear accreted-like orbit (see Fig 2). NGC 5904 clearly occu- pies the same locus as the accreted population of GCs. However, due to the uncertainties in the measurements, it is impossible to suggest to which accreted subgroup NGC 5904 belongs to. Along the same lines, NGC 6388 occupies the same locus as the [Fe/H]- rich halo field population, which coupled with its retrograde orbit hints that this GC belongs to an accreted subgroup.
value of <[Fe/H]>Liller1 ' –0.03±–0.05, which is much higher than the metallicities of the accreted GCs. Thus, our results suggest that Liller 1 has an in situ origin, agreeing with previous studies (e.g.Bica et al. 2016).
In the case of NGC 5904, our results show that the mean abundances place it on the same locus as the GCs associ- ated to the accreted subgroups. Therefore, within the uncer- tainties our results suggest that NGC 5904 has an accreted origin (agreeing with the suggestion byMassari et al. 2019).
However, since it is impossible to distinguish the accreted groups in Si-Fe space, we cannot establish an association of NGC 5904 to any particular accreted subgroup.
4.4 NGC 6388
As pointed out in Section 4.1, NGC 6388 displays a very low [Si/Fe] abundance ratio, departing significantly from the locus of the MB subgroup, to which it was associated byMassari et al.(2019). Its position on the Si-Fe plane is consistent with an extrapolation towards high metallicity of
the trend established by the accreted subgroups at [Fe/H]
<∼ –1. It also falls on top of the accreted field population in Fig. 4. The mean abundances for NGC 6388 are based on values for 24 members, which we consider to be statis- tically robust. Specifically, the mean silicon abundance of NGC 6388 members (<[Si/Fe]>= –0.03±0.1) deviates from that of the highαsequence at same [Fe/H] (<[Si/Fe]>highα
= +0.17±0.05) by∼2 σ. It is also lower than that of the low α sequence (<[Si/Fe]>lowα = +0.02±0.04) by ∼1 σ.
We note, however, that Carretta & Bragaglia (2018) ob- tained abundances for a comparable sample of NGC 6388 members, obtaining∼0.4 dex higher mean [Si/Fe]. Waller- stein et al. (2007) also obtained a ∼0.3 dex higher mean [Si/Fe], although their mean abundances of Ti and Ca were around solar or lower (∼+0.06 and –0.05, respectively), de- pending on theloggadopted. On the other hand,M´esz´aros et al.(2019) analysed the APOGEE spectra using a different pipeline, obtaining similar results to those presented in this paper.
In order to check whether our result is due to system- atics in the [Si/Fe] abundance ratios of NGC 6388 stars, we examined the abundances of otherα-elements, such as Mg and Ca. For the latter element we foundh[Ca/Fe]i= +0.09
±0.11, which is lower than the values for the MB population at the same [Fe/H] ([Ca/Fe] = +0.19±0.02), deviating at the∼1σlevel. Before estimating mean [Mg/Fe], one needs to select GC members that are not affected by the multiple population phenomenon. In order to isolate NGC 6388 stars belonging to the so-called “first population”, we proceeded as follows. We use [N/Fe] in order to identify first popula- tion stars, since this abundance ratio is strongly enhanced in their second population counterparts (see, e.g.Renzini et al.
2015;Schiavon et al. 2017a,b;Bastian & Lardo 2018). We de- fine as first population stars those located within the bottom quartile of the [N/Fe] distribution of NGC 6388 members.
By proceeding in this way, we are confident that we managed to isolate a subsample of first population GC stars, whose Mg abundances are not affected by the multiple populations phenomenon. For this subsample, we obtainedh[Mg/Fe]i= +0.07±0.11, which again is lower than the mean value for the MB population (h[Mg/Fe]i= +0.27±0.06) by∼2σ.
It is worth noticing that the relative position of NGC 6388 inα-Fe space is not the same according to differentα- elements. When Si is considered, NGC 6388 falls below the low-α sequence at the 1 σ level. On the other hand, the cluster falls on top of the low-α sequence when Mg or Ca are considered.
Due to NGC 6388 being a bulge GC, positioned in a crowded and dense field, it is likely that our sample is con- taminated by field stars, mainly in the GC foreground. To ensure our previous findings are robust, we minimise field contamination by considering only N-rich stars, which be- long to the ”second-population” GC population stars. To obtain a clean sample of ”second population” stars, we select only stars located at the top quartile of the [N/Fe] distribu- tion. For second-population NGC 6388 stars defined in that manner, we find an average of h [Si/Fe] i = –0.07 ±0.08, which places NGC 6388 even further away from thein situ population. This solidifies our initial findings, and confirms that NGC 6388 displays lower [Si/Fe] abundances than those of other MB GCs of similar metallicity.
Myeong et al. (2019) studied the properties of
NGC 6388 in detail, showing that, on one hand, it is consis- tent with an accreted origin on account of its kinematic prop- erties, but on the other its combination of age and metal- licity places it on top of the relation defined by the in situ GC population for those two parameters (see alsoKruijssen et al. 2019). We determined the orbital energy and azimuthal action of NGC 6388 (see Fig 2), finding its orbit to be retro- grade, in agreement withMyeong et al.(2019), but cannot distinguish between a possible association to the MB, LE, or the Seq subgroups. Furthermore,Milone et al.(2019) classi- fied NGC 6388 as a Type II GC, based on the ratio of first- population to second-population stars. They also obtain the IOM of this GC, and conclude that NGC 6388 is likely from an accreted origin.
We summarise our results for NGC 6388 as follows: 1) the [Si/Fe] abundance for this GC differs from that of the MB/MD population at the 2σlevel; 2) it differs from that of the low-αat the 1σlevel; 3) Figure4shows that NGC 6388 falls on top of the accretedfieldhalo populations in the Si-Fe plane; 4) its position in the IOM does not provide a unique distinction between an accreted orin situorigin. In view of these results, it is fair to conclude that the data suggest a possible accreted origin for NGC 6388.
5 CONCLUSIONS
In this work, we have employed the sixteenth data release from the SDSS/APOGEE survey in order to map the kine- matic properties of Galactic GCs into their positions in the chemical compositions space. We contrast positions, and APOGEE abundances and radial velocities with information gathered from the 2010 edition of the Harris GC catalogue (Harris 1996) and the Baumgardt & Hilker GC catalogue (Baumgardt & Hilker 2018; Baumgardt et al. 2019) to ob- tain a primary GC sample in APOGEE, which we refine to obtain an accurate GC membership list. We obtain a final main GC sample of 3090 stars, associated with 46 GCs, from which thenωCen, Terzan 5 and NGC 6715 are removed for reasons detailed in Section3.1, leaving us with a sample of 1,728 stars associated with 43 GCs. We assign membership to various kinematic subgroups according to the classifica- tion byMassari et al.(2019). We then examine the distribu- tions of the various GC subgroups in chemical space, more specifically the plane defined by αand Fe abundances. Af- ter excluding GCs with fewer than three member stars, we identify in our sample 9 GCs associated to the MD group, 10 to the MB, 9 to the GE dwarf spheroidal, 5 to the H99, 6 to the LE group, 2 to the Seq dwarf spheroidal and 0 to the Sag dwarf spheroidal. Furthermore, we find 2 GCs (namely, Liller 1 and NGC 5904) for which there remains an uncertain association.
We make use of Si abundance measurements in APOGEE as our tracer of α-elements abundance, and plot them as a function of [Fe/H] with the goal of gaining in- sight into the nature of the different kinematic subgroups.
In this comparison, we search for any possible plateau or knees that may present themselves in an [α/Fe] vs [Fe/H]
plane. Our results and conclusions are unchanged by adop- tion of the sample and abundances presented by M´esz´aros et al.(2019). Our conclusions can be summarised as follows:
(i) When considered together the in situ GC subgroups
(Main Disk and Main Bulge, MD and MB) and the low- energy group (LE) follow the overall trend of the in situ populations (MB and MD) in chemical space, with a [Si/Fe]∼+0.25 plateau at low metallicity and a change of slope (so-called “knee”) at [Fe/H]∼–0.8.
(ii) GCs from accreted subgroups, namely Gaia- Enceladus (GE), Helmi streams (H99), and Sequoia (Seq) fall on the same area of chemical space as accreted field populations. This locus is characterized by [Si/Fe]<∼+ 0.2 at –1.5<∼[Fe/H]<∼–1.0, going down to solar or near sub-solar [Si/Fe] for [Fe/H]∼ –0.5. At [Fe/H]<∼ –1.5, GCs from the accreted andin situ subgroups are indistinguishable in the Si-Fe plane.
(iii) When examined separately, the MD, MB, and LE subgroups track the field population, however due to the relatively small sample size these subgroups do not sample the metallicity space densely enough to define the trend sep- arately from the other subgroups. Three out of six of the LE GCs (namely, NGC 6121, NGC 6441 and Pal 6) fall on the high-metallicity side of the knee and follow the trend of the field populations, leading to the conclusion that they have an in situorigin. The three metal-poor GCs from the LE sub- group (namely, NGC 6254, NGC 6544 and NGC 6809) fall in the region of Si-Fe where accreted andin situ GCs are in- distinguishable, so their origin is less certain. We conclude that the chemical properties of the LE subgroup as a whole are consistent with anin situorigin, but given its borderline position in IOM space, individual clusters belonging to this subgroup could have an accreted origin.
(iv) GCs from the accreted H99 and GE subgroups oc- cupy the same position in chemical space. That is also the case for the GCs in the Seq group, but since our sample contains only two Seq GCs, the result for that subgroup is not as firm. This result suggests that GCs from these sub- groups are associated to accreted satellites of similar masses, or possibly originating from one common progenitor. Based on its position on the IOM space, it is possible that the GCs from the Seq and GE subgroups actually once belonged to the same system, as suggested by other groups (e.g.,Massari et al. 2019).
(v) NGC 6388 is found to present Si, Mg, and Ca abun- dances that are considerably lower than those of other GCs in the main bulge subgroup and similar [Fe/H]. The evi- dence from other studies in the literature is not conclusive, so more studies exploring other spectral regions and differ- entα-elements are required to ascertain the low-αnature of this GC. Considering the orbital characteristics, a confirma- tion of this result will lend strong support to the notion that NGC 6388 was in fact accreted to the Milky Way, as also suggested by other groups (e.g.Milone et al. 2019;Myeong et al. 2019).
(vi) NGC 288 is found to present Si, Ca and Mg abun- dances that are considerably higher than those of other ac- creted GCs of similar [Fe/H]. It is characterized by a highly unbound retrograde orbit. We conclude that NGC 288 is an unusual GC where the kinematic properties suggest an ac- creted origin which is not fully compatible with the its chem- istry. More work is needed to clarify the origin of this object.
(vii) Comparison of the mean [Si/Fe] vs [Fe/H] chemi- cal compositions of Liller 1 and NGC 5904 with those of the different kinematic subgroups suggests that Liller 1 possibly associated with thein situ subgroups and that NGC 5904
![Table 1. From left to right, GC name, mean [Fe/H], mean [Si/Fe], and mean radial velocity obtained for the final list of GCs in the main GC sample from APOGEE DR16.](https://thumb-eu.123doks.com/thumbv2/9dokorg/790295.36968/4.892.71.877.163.1102/table-right-radial-velocity-obtained-final-sample-apogee.webp)
![Figure 3. Mean [Si/Fe] vs [Fe/H] chemical-abundances for the Low Energy (red), Main Bulge (orange) and Main Disc (blue) GC subgroups, illustrated alongside Liller 1 (yellow), with the 1 σ spread represented in black error bars](https://thumb-eu.123doks.com/thumbv2/9dokorg/790295.36968/8.892.65.417.111.420/figure-chemical-abundances-energy-subgroups-illustrated-alongside-represented.webp)
![Figure 4. Mean [Si/Fe] vs [Fe/H] for the GE (cyan), Seq (green), H99 (purple) and MD/MB (grey) GC subgroups, illustrated alongside NGC 5904 (red) and NGC 6388 (magenta), with the 1 σ spread represented in black error bars](https://thumb-eu.123doks.com/thumbv2/9dokorg/790295.36968/9.892.66.419.152.420/figure-purple-subgroups-illustrated-alongside-magenta-spread-represented.webp)