Multispectral MR Image Data Using Ensemble Learning Methods
Agnes Gy˝´ orfi1,2, Levente Kov´acs2, and L´aszl´o Szil´agyi1,2(B)
1 Computational Intelligence Research Group,
Sapientia - Hungarian University of Transylvania, Tˆırgu Mure¸s, Romania {gyorfiagnes,lalo}@ms.sapientia.ro
2 University Research, Innovation and Service Center (EKIK), Obuda University, Budapest, Hungary´
{kovacs.levente,szilagyi.laszlo}@nik.uni-obuda.hu
Abstract. The number of medical imaging devices is quickly and steadily rising, generating an increasing amount of image records day by day. The number of qualified human experts able to handle this data cannot follow this trend, so there is a strong need to develop reliable auto- matic segmentation and decision support algorithms. The Brain Tumor Segmentation Challenge (BraTS), first organized seven years ago, pro- voked a strong intensification of the development of brain tumor detec- tion and segmentation algorithms. Beside many others, several ensem- ble learning solutions have been proposed lately to the above mentioned problem. This study presents an evaluation framework developed to eval- uate the accuracy and efficiency of these algorithms deployed in brain tumor segmentation, based on the BraTS 2016 train data set. All eval- uated algorithms proved suitable to provide acceptable accuracy in seg- mentation, but random forest was found the best, both in terms of pre- cision and efficiency.
Keywords: Magnetic resonance imaging
·
Image segmentation·
Tumor detection
·
Brain tumor·
Ensemble learning1 Introduction
Multi-spectral MRI is the usual imaging modality used to detect, localize and grade brain tumors [1]. Huge effort has been invested lately in the development of automatic MRI data processing techniques [2,3]. A wide range of algorithms were developed that cover the whole arsenal of decision making algorithms. Most This project was supported by the Sapientia Foundation – Institute for Scientific Research. The work of L. Kov´acs was supported by the European Research Council (ERC) under the European Union’s Horizon 2020 research and innovation programme (grant agreement No. 679681). The work of L. Szil´agyi was supported by the Hungarian Academy of Sciences through the J´anos Bolyai Fellowship program.
c Springer Nature Switzerland AG 2019
I. Nystr¨om et al. (Eds.): CIARP 2019, LNCS 11896, pp. 326–335, 2019.
https://doi.org/10.1007/978-3-030-33904-3_30
Statistical evaluation
Morphological post−processing
Prediction by ensemble Preprocessing :
histogram normalization feature extraction
Train data sampling for ensemble learning
Training the selected ensemble
- -
-
? MRI
data
scoresDice
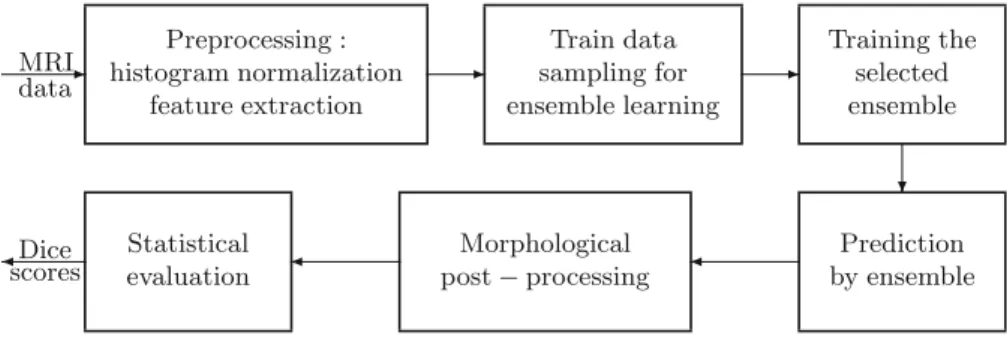
Fig. 1.Block diagram of the evaluation framework.
solutions rely on supervised and semi-supervised machine learning techniques supported by advanced image segmentation methods like: random forest ensem- bles [4–7], discrete and real AdaBoost [8], extremely random trees [9], support vector machines [10], convolutional neural network [11,12], deep neural networks [13–15], Gaussian mixture models [16,17], fuzzy c-means clustering in semi- supervised context [18,19], tumor growth model [20], cellular automata com- bined with level sets [21], active contour models combined with texture features [22], and graph cut based segmentation [23]. Earlier brain tumor segmentation solutions were remarkably summarized by Gordillo et al. in [24].
In this study we built an evaluation framework to evaluate ensemble learn- ing algorithms in segmenting brain tumors from volumetric MRI data. We com- pare the accuracy and efficiency achieved by various decision making techniques, employed within the same scenario to work with the very same pre-processed data originating from the BraTS 2016 database. The rest of the paper is struc- tured as follows: Sect.2presents provides the technical details of the framework and the algorithms included in the evaluation. Section3 analyses and discusses the obtained results. Section4concludes the investigation.
2 Materials and Methods
2.1 Framework
Data. This study is based on the whole set of 220 high-grade (HG) tumor records of the BraTS 2016 train dataset [2]. Each record contains four data channels (T1, T2, T1C, FLAIR). All channels are registered to the T1 channel.
Volumes consist of 155×240×240 isovolumetric voxels. Each voxels reflects one cubic millimeter of brain tissues. An average volume contains approximately 1.5 million brain voxels. The human expert made annotations provided by BraTS is used as ground truth within this study.
Processing Steps. The main steps of this application are presented in Fig.1.
Data records need a preprocessing to provide uniform histograms and to gener- ate further features for the classification. Data originating from train records are
sampled for the training of ensembles. Trained ensembles are evaluated using the whole test volumes. Post-processing is applied to the prediction result provided by the ensembles, to regularize the shape of the tumor and improve the seg- mentation quality. Finally, the precision of the segmentation is evaluated using statistical tools.
Pre-processing. There are three main pre-processing problems to handle when working with MRI data: (1) the intensity non-uniformity [25–27]; (2) the great variety of MR image histograms; (3) generating further features. The HG tumor volumes of the BraTS dataset contains no relevant inhomogeneity [2], so its compensation can be omitted. Uniform histograms are provided for each data channel of each MR record, using a context dependent linear transform, which assigns the 25 and 75 percentile to intensity levels 600 and 800, respectively, and forces all transformed intensities to be situated in the predefined range of 200 to 1200. Details of this transform are presented in our previous paper [28].
Beside the 4 observed data channels, 100 further features are generated using morphological, gradient, Gabor wavelet based techniques [28,29].
Decision Making. The 220 HG tumor records were randomly divided into two equal groups, which served as train and test data during the two-round cross val- idation. Thus we obtain segmentation accuracy benchmark for each MRI record using ensembles trained with data from the complementary group. Ensemble units were trained using the feature vectors of 10,000 randomly selected vox- els from the train records that contained 93% negatives and 7% positives, as described in our previous study [28]. All ensembles were trained to separate two classes: normal tissues and whole tumor lesions.
Post-processing. Our post-processing step relabels each pixel based on the rate of predicted positives situated within a 11×11×11 cubic neighborhood.
The threshold was set empirically at 35%.
Evaluation Criteria. The accuracy indicators involved in this study are based on the amount of true positives (TP), true negatives (TN), false positives (FP), and false negatives (FN). The main accuracy indicators derived from these num- bers, namely the Dice score (DS), sensitivity (true positive rate, TPR), specificity (true negative rate, TNR), and accuracy (ACC), are presented in Table1. These indicators are established for each individual HG tumor record, and then aver- age and median values are computed to characterize the overall accuracy. The evaluation criterion of algorithm efficiency is the average runtime of the whole processing of individual MR records.
Table 1.Criteria to evaluate segmentation quality
Indicator Values
Name Formula Possible Ideal
Dice score DS = 2×TP+FP+FN2×TP 0≤DS≤1 1 Sensitivity TPR = TP+FNTP 0≤TPR≤1 1 Specificity TNR = TN+FPTN 0≤TNR≤1 1 Accuracy ACC = TP+FP+TN+FNTP+TN 0≤ACC≤1 1
2.2 Algorithms
Ensemble learning methods achieve high accuracy in classification from the majority voting of several weak classifiers. In this study we investigate the fol- lowing algorithms:
– Random forest (RF) classifier, as implemented in OpenCV ver. 3.4.0. RF is an ensemble of binary decision trees. The main parameters are the number of trees and the maximum tree depth. Train data sets of 10,000 items were best learned using maximum depth set to seven.
– Ensemble of real Adaboost classifiers, as implemented in OpenCV ver. 3.4.0.
– Ensemble of perceptron networks (ANN), as implemented in OpenCV ver.
3.4.0., using four layers of sizes 104, 15, 7, and 1, respectively.
– Ensemble of binary decision trees (BDT), using an own implementation [28].
BDTs can be trained to perfectly separate negative from positive samples unless there exist coincident feature vectors with different ground truth. The maximum depth of BDTs was 20.6±3.4 (AVG±SD), but decisions were made at average depth of 7.71±2.89.
3 Results and Discussion
The above listed machine ensemble learning techniques were tested using the 220 high-grade tumor records of the BraTS 2016 database. Four ensembles sizes ranging from 5 to 255 were evaluated. Quality indicators shown in Table1 were extracted for each algorithm and each MRI record separately, together with the average and median value for each indicator for overall accuracy evaluation.
Comparisons in group involving all algorithms, and one-against-one tests were carried out, using individual data records and the whole HG data set as well.
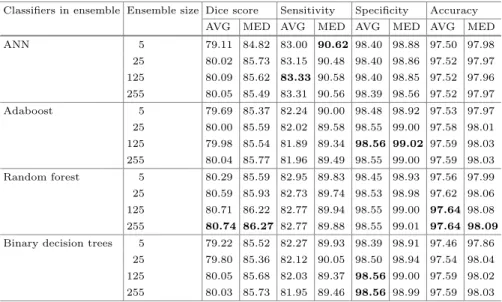
Overall average and median values of the four main quality indicators are exhibited in Table2, for all evaluated ensemble learning algorithms and various ensemble sizes. Median values were found greater than the average, for all indi- cators and scenarios, because there are a few records of reduced or damaged quality that are likely to be segmented considerably worse than all others. High- est values highlighted in each column of the table indicate that the random forest
achieved slightly better results than any other evaluated technique. The accu- racy of segmentation rises together with the ensemble size up to 125 units, above which it seems to stabilize or fall slightly. Highest achieved average Dices scores approached 81%, while median values surpass 86%. The accuracy of all evalu- ated ensemble learning techniques is around 98%, meaning that approximately one pixel out of 50 is misclassified.
Table 2.Various statistical accuracy indicator values achieved by tested techniques and ensemble sizes, expressed in percentage (%). Best performance is highlighted in all columns. AVG stands for average, MED stands for median.
Classifiers in ensemble Ensemble size Dice score Sensitivity Specificity Accuracy
AVG MED AVG MED AVG MED AVG MED
ANN 5 79.11 84.82 83.00 90.62 98.40 98.88 97.50 97.98
25 80.02 85.73 83.15 90.48 98.40 98.86 97.52 97.97 125 80.09 85.62 83.33 90.58 98.40 98.85 97.52 97.96 255 80.05 85.49 83.31 90.56 98.39 98.56 97.52 97.97 Adaboost 5 79.69 85.37 82.24 90.00 98.48 98.92 97.53 97.97 25 80.00 85.59 82.02 89.58 98.55 99.00 97.58 98.01 125 79.98 85.54 81.89 89.34 98.56 99.02 97.59 98.03 255 80.04 85.77 81.96 89.49 98.55 99.00 97.59 98.03 Random forest 5 80.29 85.59 82.95 89.83 98.45 98.93 97.56 97.99 25 80.59 85.93 82.73 89.74 98.53 98.98 97.62 98.06 125 80.71 86.22 82.77 89.94 98.55 99.00 97.64 98.08 255 80.74 86.27 82.77 89.88 98.55 99.01 97.64 98.09 Binary decision trees 5 79.22 85.52 82.27 89.93 98.39 98.91 97.46 97.86
25 79.80 85.36 82.12 90.05 98.50 98.94 97.54 98.04 125 80.05 85.68 82.03 89.37 98.56 99.00 97.59 98.02 255 80.03 85.73 81.95 89.46 98.56 98.99 97.59 98.03
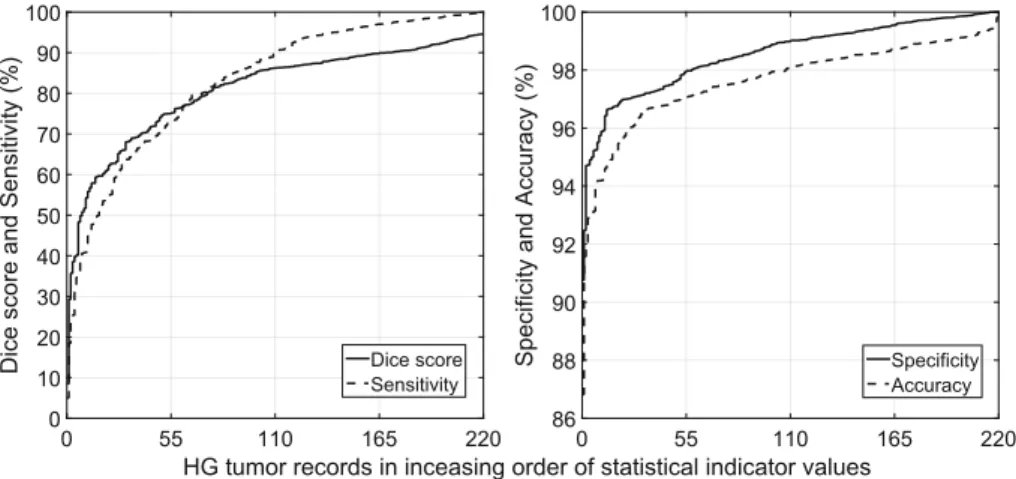
Figure2exhibits the Dice score and Sensitivity in the left panel, respectively the Specificity and Accuracy in the right panel, indicator values obtained by the random forest using ensemble of 125, which was identified as the most accu- rately performing algorithm. Approximately 10% of the records lead to mediocre result. In these cases the classification methods failed to capture the main spe- cific characteristics of the data, probably because the recorded images were of low quality.
Table3 shows for each test scenario (algorithm and ensemble size) the num- ber of successfully segmented records, where the Dice score exceeded predefined threshold values ranging from 50% to 92%. Highest values highlighted for each threshold value indicate again that random forest achieved the best segmentation quality.
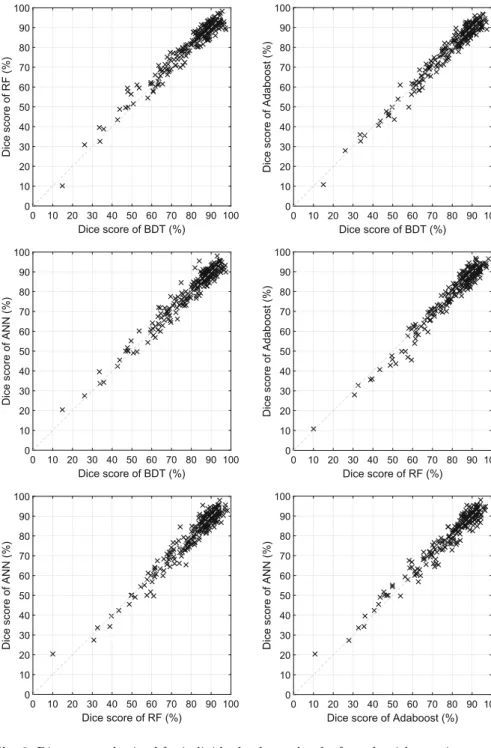
Figure3 presents the outcome of one-against-one comparison of the tested algorithms, each using ensembles of 125 units. Dice scores shown here were obtained on each individual HG tumor records. Each cross (×) in the graph shows the Dice score achieved by the two ensemble learning techniques on the
HG tumor records in inceasing order of statistical indicator values
0 55 110 165 220
Dice score and Sensitivity (%)
0 10 20 30 40 50 60 70 80 90 100
Dice score Sensitivity
0 55 110 165 220
Specificity and Accuracy (%)
86 88 90 92 94 96 98 100
Specificity Accuracy
Fig. 2.Main quality indicator values obtained for individual HG tumor volumes, using the random forest method in ensemble of 125, sorted in increasing order.
Table 3.Comparison of the tested ensemble learning techniques using the DS obtained for the 220 individual HG tumor records. Bests scores were identified and highlighted in each row of the table.
Classifier BDT Random forest Adaboost ANN
Ensemble size 5 25 125 255 5 25 125 255 5 25 125 255 5 25 125 255 DS>50% 208 208 209 209 213 212 212 212 208 208 208 209 210 210 210 210 DS>60% 194 198 200 201 197 200 201 201 198 200 200 201 195 201 202 201 DS>70% 173 174 175 175 177 180 181 181 173 175 175 175 173 175 174 174 DS>75% 160 163 164 163 164 168 166 166 161 163 164 164 159 164 164 164 DS>80% 138 140 143 143 142 144 146 146 141 143 143 143 135 143 145 141 DS>85% 114 111 117 116 117 119 120 120 112 116 116 116 109 114 114 114 DS>88% 70 76 75 76 75 82 81 82 76 76 76 78 67 74 74 74 DS>90% 38 47 52 51 47 49 51 50 46 51 51 53 38 44 44 42 DS>92% 21 26 25 25 23 24 27 26 25 26 26 25 18 23 24 23
very same data. Most crosses are situated in the proximity of the diagonal, indi- cating that both algorithms obtained pretty much the same accuracy. There are also crosses apart from the diagonal, representing scenarios where one of the methods led to significantly better segmentation quality.
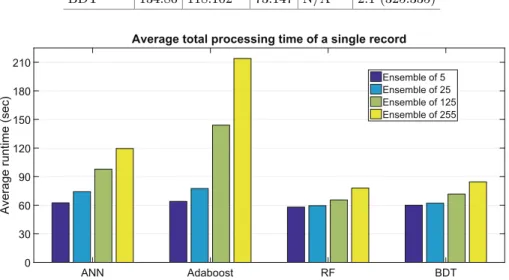
Table4 exhibits the same results as Fig.3, but here the one-against-one out- come of tests is organized in a tournament format. The tournament was won by the random forest algorithm, followed by BDT, Adaboost, and ANN. Figure4 compares the efficiency of the four evaluated algorithms. Total runtimes exhib- ited here include the duration of histogram normalization and feature generation, segmentation and post-processing of an average sized never seen MR data vol- ume. All tests were performed on a notebook computer, using a single core of a quad-core i7 processor that runs at 3.4 GHz. AdaBoost and ANN proved to be significantly less efficient than RF and BDT.
Dice score of BDT (%)
0 10 20 30 40 50 60 70 80 90 100
Dice score of RF (%)
0 10 20 30 40 50 60 70 80 90 100
Dice score of BDT (%)
0 10 20 30 40 50 60 70 80 90 100
Dice score of Adaboost (%)
0 10 20 30 40 50 60 70 80 90 100
Dice score of BDT (%)
0 10 20 30 40 50 60 70 80 90 100
Dice score of ANN (%)
0 10 20 30 40 50 60 70 80 90 100
Dice score of RF (%)
0 10 20 30 40 50 60 70 80 90 100
Dice score of Adaboost (%)
0 10 20 30 40 50 60 70 80 90 100
Dice score of RF (%)
0 10 20 30 40 50 60 70 80 90 100
Dice score of ANN (%)
0 10 20 30 40 50 60 70 80 90 100
Dice score of Adaboost (%) 0 10 20 30 40 50 60 70 80 90 100
Dice score of ANN (%)
0 10 20 30 40 50 60 70 80 90 100
Fig. 3.Dice scores obtained for individual volumes by the four algorithms using ensem- bles of size 125, plotted one algorithms vs. another, in all possible six combinations.
Table 4. Dice score tournament using the 54 LG volumes: algorithms against each other, each using ensembles of size 125. Here ANN proved to be the weakest.
Algorithm ANN Adaboost RF BDT Won:Lost ANN N/A 89:131 57:163 86:134 0:3 (232:428) Adaboost 131:89 N/A 71:149 102:118 1:2 (304:356) RF 163:57 149:71 N/A 147:73 3:0 (459:201) BDT 134:86 118:102 73:147 N/A 2:1 (325:335)
ANN Adaboost RF BDT
Average runtime (sec)
0 30 60 90 120 150 180 210
Average total processing time of a single record
Ensemble of 5 Ensemble of 25 Ensemble of 125 Ensemble of 255
Fig. 4.Runtime benchmarks of the four classification algorithms: the average value of the total processing time in a single record testing problem.
4 Conclusions
This study attempted to compare the accuracy and efficiency of various ensemble learning algorithms involved in a brain tumor segmentation based on multispec- tral magnetic resonance image data. The performed investigation indicates that publicly available implementations of ensemble learning methods are all capable to detect and segment the tumor with an acceptable accuracy. The small differ- ences in terms of accuracy, and larger ones in terms of efficiency together revealed that random forest is the best decision making algorithm from the investigated ones. Further works will aim at involving more data sets and more machine learning algorithms into the comparative study.
References
1. Mohan, G., Subashini, M.M.: MRI based medical image analysis: survey on brain tumor grade classification. Biomed. Signal Process. Control39, 139–161 (2018)
2. Menze, B.H., Jakab, A., Bauer, S., Kalpathy-Cramer, J., Farahani, K., Kirby, J., et al.: The multimodal brain tumor image segmentation benchmark (BRATS).
IEEE Trans. Med. Imaging34, 1993–2024 (2015)
3. Bakas, S., Reyes, M., Jakab, A., Bauer, S., Rempfler, M., Crimi, A., et al.:
Identifying the best machine learning algorithms for brain tumor segmentation, progression assessment, and overall survival prediction in the BRATS challenge.
arXiv: 1181.02629v3, 23 April 2019
4. Phophalia, A., Maji, P.: Multimodal brain tumor segmentation using ensemble of forest method. In: Crimi, A., Bakas, S., Kuijf, H., Menze, B., Reyes, M. (eds.) BrainLes 2017. LNCS, vol. 10670, pp. 159–168. Springer, Cham (2018). https://
doi.org/10.1007/978-3-319-75238-9 14
5. Tustison, N.J., et al.: Optimal symmetric multimodal templates and concatenated random forests for supervised brain tumor segmentation (simplified) with ANTsR.
Neuroinformatics13, 209–225 (2015)
6. Lefkovits, L., Lefkovits, S., Szil´agyi, L.: Brain tumor segmentation with optimized random forest. In: Crimi, A., Menze, B., Maier, O., Reyes, M., Winzeck, S., Han- dels, H. (eds.) BrainLes 2016. LNCS, vol. 10154, pp. 88–99. Springer, Cham (2016).
https://doi.org/10.1007/978-3-319-55524-9 9
7. Lefkovits, S., Szil´agyi, L., Lefkovits, L.: Brain tumor segmentation and survival prediction using a cascade of random forests. In: Crimi, A., Bakas, S., Kuijf, H., Keyvan, F., Reyes, M., van Walsum, T. (eds.) BrainLes 2018. LNCS, vol. 11384, pp.
334–345. Springer, Cham (2019).https://doi.org/10.1007/978-3-030-11726-9 30 8. Islam, A., Reza, S.M.S., Iftekharuddin, K.M.: Multifractal texture estimation for
detection and segmentation of brain tumors. IEEE Trans. Biomed. Eng.60, 3204–
3215 (2013)
9. Pinto, A., Pereira, S., Rasteiro, D., Silva, C.A.: Hierarchical brain tumour segmen- tation using extremely randomized trees. Pattern Recogn.82, 105–117 (2018) 10. Zhang, N., Ruan, S., Lebonvallet, S., Liao, Q., Zhou, Y.: Kernel feature selection
to fuse multi-spectral MRI images for brain tumor segmentation. Comput. Vis.
Image Underst.115, 256–269 (2011)
11. Pereira, S., Pinto, A., Alves, V., Silva, C.A.: Brain tumor segmentation using convolutional neural networks in MRI images. IEEE Trans. Med. Imaging 35, 1240–1251 (2016)
12. Shin, H.C., et al.: Deep nonvolutional neural networks for computer-aided detec- tion: CNN architectures, dataset characteristics and transfer learning. IEEE Trans.
Med. Imaging35, 1285–1298 (2016)
13. Kim, G.: Brain tumor segmentation using deep fully convolutional neural networks.
In: Crimi, A., Bakas, S., Kuijf, H., Menze, B., Reyes, M. (eds.) BrainLes 2017.
LNCS, vol. 10670, pp. 344–357. Springer, Cham (2018).https://doi.org/10.1007/
978-3-319-75238-9 30
14. Li, Y., Shen, L.: Deep learning based multimodal brain tumor diagnosis. In: Crimi, A., Bakas, S., Kuijf, H., Menze, B., Reyes, M. (eds.) BrainLes 2017. LNCS, vol.
10670, pp. 149–158. Springer, Cham (2018). https://doi.org/10.1007/978-3-319- 75238-9 13
15. Zhao, X.M., Wu, Y.H., Song, G.D., Li, Z.Y., Zhang, Y.Z., Fan, Y.: A deep learning model integrating FCNNs and CRFs for brain tumor segmentation. Med. Image Anal.43, 98–111 (2018)
16. Juan-Albarrac´ın, J., et al.: Automated glioblastoma segmentation based on a mul- tiparametric structured unsupervised classification. PLoS One 10(5), e0125143 (2015)
17. Menze, B.H., van Leemput, K., Lashkari, D., Riklin-Raviv, T., Geremia, E., Alberts, E., et al.: A generative probabilistic model and discriminative extensions for brain lesion segmentation - with application to tumor and stroke. IEEE Trans.
Med. Imaging35, 933–946 (2016)
18. Szil´agyi, L., Szil´agyi, S.M., Beny´o, B., Beny´o, Z.: Intensity inhomogeneity com- pensation and segmentation of MR brain images using hybridc-means clustering models. Biomed. Signal Process. Control6, 3–12 (2011)
19. Szil´agyi, L., Lefkovits, L., Beny´o, B.: Automatic brain tumor segmentation in mul- tispectral MRI volumes using a fuzzyc-means cascade algorithm. In: Proceedings of the 12th International Conference on Fuzzy Systems and Knowledge Discovery, pp. 285–291. IEEE (2015)
20. Lˆe, M., et al.: Personalized radiotherapy planning based on a computational tumor growth model. IEEE Trans. Med. Imaging36, 815–825 (2017)
21. Hamamci, A., Kucuk, N., Karamam, K., Engin, K., Unal, G.: Tumor-Cut: seg- mentation of brain tumors on contranst enhanced MR images for radiosurgery applicarions. IEEE Trans. Med. Imaging31, 790–804 (2012)
22. Sahdeva, J., Kumar, V., Gupta, I., Khandelwal, N., Ahuja, C.K.: A novel content- based active countour model for brain tumor segmentation. Magn. Reson. Imaging 30, 694–715 (2012)
23. Njeh, I., et al.: 3D multimodal MRI brain glioma tumor and edema segmentation:
a graph cut distribution matching approach. Comput. Med. Imaging Graph.40, 108–119 (2015)
24. Gordillo, N., Montseny, E., Sobrevilla, P.: State of the art survey on MRI brain tumor segmentation. Magn. Reson. Imaging31, 1426–1438 (2013)
25. Vovk, U., Pernu˘s, F., Likar, B.: A review of methods for correction of intensity inhomogeneity in MRI. IEEE Trans. Med. Imaging26, 405–421 (2007)
26. Szil´agyi, L., Szil´agyi, S.M., Beny´o, B.: Efficient inhomogeneity compensation using fuzzyc-means clustering models. Comput. Methods Programs Biomed.108, 80–89 (2012)
27. Tustison, N.J., et al.: N4ITK: improved N3 bias correction. IEEE Trans. Med.
Imaging29, 1310–1320 (2010)
28. Szil´agyi, L., Icl˘anzan, D., Kap´as, Z., Szab´o, Z., Gy˝orfi, ´A., Lefkovits, L.: Low and high grade glioma segmentation in multispectral brain MRI data. Acta Univ.
Sapientia Informatica10(1), 110–132 (2018)
29. Gy˝orfi, ´A., Kov´acs, L., Szil´agyi, L.: A feature ranking and selection algorithm for brain tumor segmentation in multi-spectral magnetic resonance image data. In:
41st Annual International Conferences of the IEEE EMBS. IEEE (2019, accepted paper)