Fractional Order Impedance Model to Estimate Glucose Concentration: in Vitro Analysis
Dana Copot, Robin De Keyser, Jasper Juchem, Clara M. Ionescu
Ghent University, Research group on Dynamical Systems and Control Technologiepark 914, 9052 Ghent, Belgium
{dana.copot,claramihaela.ionescu,robain.dekeyser,jasper.junchem}@ugent.be
Abstract: This paper uses tools from fractional calculus such as Cole-Cole and fractional order impedance models for estimation of glucose concentration. The measured impedance is compared with two fractional order models and the simulation results show that Cole-Cole model has limitation and cannot capture the dynamics of the simulated environment. On the other hand, the fractional order model can follow the changes in impedance for several study cases. Model parameters are correlated with various conditions of the test environment. The results of these study cases show that the fractional order model is a suitable candidate for this particular application. The hypothesis tested in this paper provides new tools for glucose concentration monitoring and measurement.
Keywords: Fractional Order Impedance Models; Diabetes; Modeling; Cole-Cole Model
1 Introduction
Due to the increase in diabetes severity, this disease has become a serious health problem at a worldwide level representing teh main cause of death in the age cat- egory 20-79 years. Hence, the research comunity has focused on developing more reliable and accurate devices for glucose measurement [1]. In this research area the main challenge to tackle is the design of non-invasive devices. Although, the non- invasive idea dates already from the 70s many of the proposed technologies are still at an early stage of development [2].
Several techniques such as electromagnetic sensing, infrared spectroscopy, polarime- try were considered in order to enable the design of new methodologies for glucose concentartion measurement. Worldwide, this area is intensively explored and efforts are being made towards the development of stabe, reliable and accurate measure- ment devices (e.g. BioSensors, Cnoga Medical C8 MediSensors, etc.).
Although there are several devices available on the market, they are not yet working at the desired capacity and there is ongoing research for upgrade. Moreover, the documentation released by the research groups is limited and also validation of this devices on large groups is still missing [3]. The main disadvantage of the current
devices is that they are relatively poor in signal-to-noise-ratio. Therefore, up to now no device can be considered fully reliable and clinically validated. Given that non- invasive techniques are still at an early stage of development there is still room for improvements [3].
Therefore, focus on developing systems such as artificial pancreas to control insulin delivered to patients with diabetes has increased. the current standards in clinical practice consist of blood glucose measurements based on finger-prick technique.
However, when this method is used for most patients is an unpleasant procedure due to the protocol of taking blood samples. Moreover, recent studies show that on long term there is the risk of fingerprint damage [4]. In figure 1 an overview of the methods used for blood glucose monitoring and control are presented.
Figure 1
An overview of the method used for blood glucose measurement
Considering all the aspects presented above the advantages of non-invasive technol- ogy is easily motivated. Nowadays, the use of nano-technology is the new approach towards the improvement of the health sector. For example, nanorobots are used to deliver a drug to a precise location. This will result in a faster effect and also will re- duce the risks of secondary effects. Blood can be characterized as a non-newtonian fluid and therefore when designing such a device this aspect needs to taken into account [5]. In order to deal with difficulties encountered (from a modeling and control approach) new techniques need to be investigated.
Therefore, this paper discusses the use of fractional calculus since it is able to make a trade off between linear theory (Newtonian) and non-linear theory (Non-Newtonian) fluids.
More specifically, fractional order impedance is a suitable tool to estimate, measure and evaluate the glucose levels. FC is of key importance in modeling of phenomena in several areas of research (e.g. chemistry, physics, engineering, etc.) [6, 7]. From
the perspective of biomedical engineering fractional order calculus has been only recently introduced [8].
In the biomedical engineering research community the interest on using tools from fractional calculus in this area has increased considerably in the last years [9–11].
Fractional order concept refers to dynamical systems for which the structure consist of arbitrary-order derivatives and integrals [12]. A detailed description of fractional order integrals and derivatives can be found in [13].
In this paper the hypothesis wheter or not fractional calculus is a suitable candidate to measure, estimate and evaluate the level of glucose. For this, electrochemical impedance spectroscopy has been employed and preliminary analysis (in vitro) has been performed. EIS is used in several fields of research (e.g. batteries, fuel cells, biological systems, etc.) [14–18] EIS has been succesfully applied to estimate and analyze the impact of glucose in erythrocytes [19, 20], effect of glucose in aqueous solutions [21,22], etc. This paper proposes a new approach, i.e. the use of fractional order impedance models to characterize changes in glucose concentration (in vitro analysis). At the same time, analysis on how the model parameters are changing as a function of the concentration will be also investigated. The preliminary results in- dicate that the proposed fractional order model can detect and differentiate changes in glucose concentration.
The paper is organized as follows: In section II A brief description of the tools pro- posed in this paper is given followed by Section III where the measurement device and the methodology employed are introduced. The outcome of the proposed hy- pothesis is given in section IV. The main outcome of this study is summarized in section V.
2 Theoretical Background
2.1 Cole-Cole Impedance Model
Fractional order elements are present in many areas of engineering [23]. When an electrochemical system is modelled usually a constat phase element is chosen since a non-homogenuous surface is present [23]. Impedance (when a CPE is used) is obtained using the following formula:
Z(jω) = 1
Cα(jω)α (1)
whereCαrepresents the capacitance of orderα, with 0≤α ≤1.
Electrical properties of cell membrane have been modelled by means of impedance measurements in the 1940 by Cole. Recently, the work of Magin presented a gener- alization of the Cole-Cole expression by means of fractional calculus [16, 17]. This model consist of 3 main elements: a low frequency resistor R0, a high frequency resistorR∞and aCPEα [24].
The developed circuit can be visualised as two serial connected elements: one isR∞
and the second one is(R0−R∞)||CPEα. The complex impedance described by Cole
model is given by the following equation (Cole 1940):
Zα(ω) =R∞+ R0−R∞
1+ (jω τα)α (2)
withτα the characteristic relaxation time.
Previous work of the authors have aslo employed Cole-Cole model fro characteri- zation of several simulated environment (i.e. simulating different concentrations of glucose) and the obtained results are presented in [24].
2.2 Fractional Order Impedance Model
The Cole-Cole model has several limitation (as described in [24]) in terms of cap- turing the dynamics of the real data. Next, tools from fractional calculus have been employed and an augmented fractional order model has been used to characterize the glucose concentration profile. Given the structure of the fractional order model electrical analogy with ladder networks can be considered [10]. It has been shown that the values of the complex impedance are increasing as a function of the number of neural networks.
A conceptual scheme of such a ladder network is depiceted in the following Figure.
The total admittance of such a ladder is given by the continued fraction expansion.
Figure 2
Schematic representation of a ladder network characterizing the neuron transmission model [10]
YN(s) = 1/Zl1
1+ Zt1(s)/Zl1(s) 1+ Zt1(s)/Zl2(s)
1+ Zt2(s)/Zl3(s)
1+ . . .
1+ ZtN−1(s)/ZlN(s) 1+ZtN(s)/ZlN(s)
(3)
In previous work of the authors it has been demonstrated that this structure of the ladder network results in the appearance in lumped form of a fractional order pa- rameter dependent on the structure and fucntionality of the ladder elements [10]:
γ= log(a)
log(a+b) (4)
whereaandbrepresent the specific property parameters. Then, the lumped admit- tance model can be expressed as:
Y(s)≈Ksγ (5)
or equivalently, the impedance:
Z(s)≈ k
sγ (6)
When interpreting the model at a micro scale level, the model refers to the diffu- sion process of glucose molecules in teh simulated environment. Independently, the lumped impedance model has been shown to be of the form:
Z(s) =Dsδ (7)
where D represents the diffusion parameter andδ represents the fractional order parameter value related to the diffusion rate. The complete fractional order model is expressed as:
Z(jω) =R+ k
sγ+Dsδ (8)
When this model is employed there are 5 parameters which need to be estimated for every impedance measurement.
The reasoning behind developing such a model is to enable the design and devel- opment of a nanoscale robot for continuous evaluation of glucose levels. Such a technology would lead to a better monitoring of patients with diabetes by means of an accurate and reliable tool.
3 Experimental Setup and Methodology
3.1 Solutions
To test the proposed methodology, simulated solutions of different glucose concen- tration have been used for analysis. It is well known that the composition of plasma consits in 92% water and dissolved solutes of 8% such a electrolytes, proteins, or- ganic wastes and nutrients. Electrolytes are responsible with the transmission of electrical signals. The major electrolytes in plasma are Sodium (Na+), Potassium (K+) and Chloride (Cl−) and these are responsible to ensure stable concentrations and to charge differences across cell membranes. For teh study cases presented in this paper aquaous solution of KCl with a concentration of 80 mmol/L have been used. In order to simulate the real life situation this baseline solution has been di- luted in other 5 concentration levels, i.e. 5, 10, 15, 20 and 40 mmol/L. To ensure that the analysis performed is as close as possible to real life teh sample concentration have been chosen based on the data presented in Table 1.
Table 1
Overall glucose level and the medical interpretation.
mmol/L mg/dL Medical interpretation
2.0 35 very low, danger of unconsciousness
3.0 55 marginal insulin reaction
4.0 - 6.0 70 -100 normal value before meal in nondiabetic patient 8.0 150 normal value after meal in nondiabetic patient 10.0 180 maximum after meal in nondiabetic patient
15 270 high to very value
16.5 - 20.0 300 - 360 danger
22 400 extremely high
In clinical practice the following glucose levels have been defined (recommended):
prior a meal (preprandial) it is indicated that the level of glucose is less than 100 mg/dL (5.5 mmol/L) in plasma and 89 mg/dL (4.9 mmol/L) in whole blood capil- lary; after meal (postprandial) the value cannot exceed 140 mg/dL (7.8 mmol/L) in plasma and 125 mg/dL (6.9 mmol/L) in whole blood or capillary as shown in table 1, based on which the samples concentration has been selected.
3.2 Instrumentation
Impedance measurements have been performed using an electrochemical device i.e.
a Solatron modulabXm impedance analyzer (Solatron Analytical, UK), see Figure 3. The experimental procedure consist in sending a sinusoidal voltage to the elec- trodes connected to the analyzed sample. The impedance has been evaluated in the frequency interval 1Hz-1MHz. The measurement cell is a small cylindrical tank (inner diameter of 20 mm and a length of 30 mm) and the electrodes used to aquired the measured data are screen-printed electrodes. These electrodes are suitable for repeatable measurements but also they exhibit high electrochemical activity.
3.3 Methodology
Mostly, the electrochemical impedance spectrocopy method is done by means of a single frequency. However, this a time-consuming procedure and it is more difficult to eliminate the transient. Another posibility is to use a random signal which will decrease the amount of time rquired for analysis, but, in this situation leakage migt introduce error in the frequency response function estimation [21]. Therefore, it is important to preserve linearity and to ensure this small amplitude signals need to be send to the analyzed probe and this will result in a poor signal to noise ration. To overcome these multisine exciattion signals are a suitable choice. These signal are able to ensure a short measurement time due to their ability to perform broadband excitation. Also, in case of multisine signals leakage is not an issue since it is a pe- riodic signal. For the analysis performed in this paper a multisine exictation signal
Figure 3
Solatron ModulabXm impedance analyzer
(i.e. voltage) has been sent to the probe and the corresponding current signals have been aquired. This method has the advantage of proving a good analysis of the noise and at the same time of the bias present in the analyzed data. This enables extrac- tion of teh best linear approximation from the measured data. For identification, the non-parametric best linear approximation method has been employed. More details about this method can be found in [10]. The outcome of teh identification proce- dure is a complex impedance which can be expresssed as real and imaginary part for each excited frequency point. This is a graphical interpretation of the analyzed data which allows us to extract a parametric representation. More speciffically, to the extracted data is compared with the parametric model described in section 2.
This results in a parameterization of the analyzed data. In previous work the authors showed that the method employed in this paper is equally good as a full optimiza- tion procedure [10]. In Figure 3 a typical measurement output is depicted.
4 Results
In this section the experimental results obtained for different glucose concentrations solution are presented and discussed. Using the device described in section 2 and employing the metodology describe in the paper analysis of multiple simulated solu- tions has been performed and the results are presented in figures 4-10. The reasoning of the analysis performed in this paper has been described in 3.2. First, the mea- sured data has been fitted to the Cole-Cole model. For this, it is necessary to identify the values of the five model parameters (R0,R∞,τ,α,β) for the Cole-Cole model.
This model proved not be able to capture the dynamics of measured impedances. In
figure 4 the results obtained for concentration of 5mmol/L and 10mmol/L glucose are presented.
Figure 4
Results of tge measured and estimated impedance using Cole-Cole approach. Blue line: model; Red line: measured data. Left: 0 mmol/L glucose; Right: 5 mmol/L. The measurement were performed in
the ferquency range 1Hz-0.1Mh
As it can be noticed from Figure 4 the obtained results are not satisfactory. More specifically, it can be seen that the typical ellipsoid shape of the estimated impedance does not comply with the somewhat skewed polar plot of the calculated impedance from voltage-current measurements. Therefore, we have moved one step further and tools from fractional calculus have been employed.
For the fractional order impedance model the following parameters have to be esti- matedR,L,D,α,β. The identified values for every parameter are given in table 2.
From table 2 it can be noticed that three model parameters are well caharacterized while two parameters are yet to be identified. For this two parameters the right ex- periment has not been yet found but there is ongoing work. The real and imaginary part of the measured impedance for the in vitro tests performed are shown in Figure 5.
Figure 5
Relevant part of the measured signal used for further analysis
Table 2
Fractional order impedance model parameters estimation.
R L D α β
0.1512 0.2862 2.9583 0.0017 0.00009 0.1568 0.1700 2.6854 0.00011 0.00009 0.1658 0.0180 2.1128 0.0013 0.00009 0.2164 0.1210 2.6358 0.00012 0.00009 0.2358 0.3521 2.2657 0.0015 0.00009 0.2688 0.0130 1.8598 0.00015 0.00009
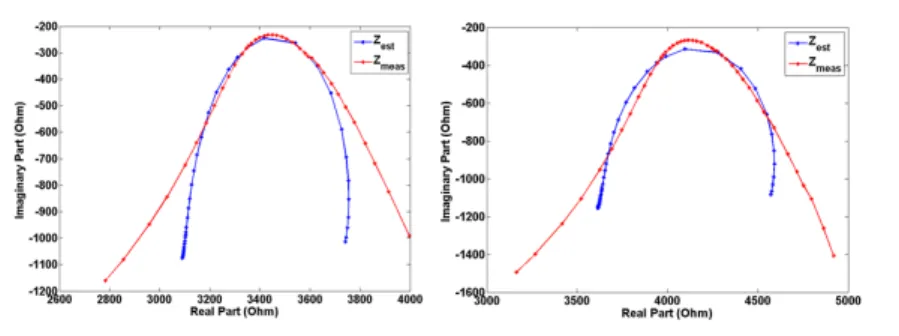
In Figures 6-10 the results obtained for different glucose concentration are presented and it can be noticed that a good fit between measured and estimated impedance has been obtained. As it can be noticed from the model parameters also, there si still room for improvement and research with respect to the model performance is ongoing. More specifically, tests to understand the changes of the impedance at high frequencies as well as why at higher concentration a good fitting is not obtained anymore are being investigated.
Conclusions
In this paper the concept of fractional calculus and electrochemical impedance spec- troscopy has been used to estimate and measure the impedance of several aque- ous glucose solutions. The results show that the electrochemical impedance spec- troscopy can be used as a basis for detection of glucose. However, there is still room for improvement in order to obtain a better correlation between the estimated and measured impedance.
Figure 6
Model (o) against measured impedance (+) at a concentration of 0 mmol/L glucose in the frequency range 1Hz-0.1 MHz
Figure 7
Model (o) against measured impedance (+) at a concentration of 5 mmol/L glucose in the frequency range 1Hz-0.1 MHz
Figure 8
Model (o) against measured impedance (+) at a concentration of 10 mmol/L glucose in the frequency range 1Hz-0.1 MHz
Figure 9
Model (o) against measured impedance (+) at a concentration of 15 mmol/L glucose in the frequency range 1Hz-0.1 MHz
Figure 10
Model (o) against measured impedance (+) at a concentration of 20 mmol/L glucose in the frequency range 1Hz-0.1 MHz
Acknowledgement
This work is financially supported by Flanders Research Centre, grant nr 12B3415N, G008113N and G026514N.
References
[1] S. Vashist, Constinuous glucose monitoring systems: A review. Diagnostics, 3, 385-412, 2013.
[2] O. Khalil, Non-invasive glucose measurement technologies: an update from 1999 to the dawn of the new millennium. Diabetes Technology Therapy, 6(5), 660–697, 2004.
[3] C. So, K. Choi, T. Wong, J. Chung, Recent advances in noninva- sive glucose monitoring. National Center for Biotechnology Information, doi:10.2147/MDER.S28134, 2012.
[4] V. Sgurev, R. Yager, J. Kacprzyk and K. Atanassov. Recent contributions in intelligent systems. Springer International Publishing Switzerland, 2017.
[5] C. Ionescu, A memory-based model for blood viscosity. Communications in Nonlinear Science and Numerical Simulation, 45, 29-34, 2017.
[6] R. L. Magin. Fractional Calculus in Bioengineering, Begell House Publishers, 2006.
[7] E. Gutierrez, J. Mauricio Rosario and J. T. Machado. Fractional Order Calcu- lus: Basic Concepts and Engineering Applications, Mathematical Problems in Engineering, 2010.
[8] B. J. West. Fractal physiology and chaos in medicine, Studies of nonlinear phe- nomena in life sciences, vol.1. Singapore: World Scientific, 1990.
[9] G. A. Losa, D. Merlini, T. F. Nonnenmacher and E. R. Weibel. Fractals in Biol- ogy and Medicine, vol IV. Berlin: Birkhaser, 2005.
[10] C. Ionescu, The human respiratory system: an analysis of the interplay be- tween anatomy, structure, breathing and fractal dynamics, Springer, Series in BioEngineering ISBN 978-1-4471-5387-0, Online ISBN 978-1-4471-5388-7, 2013.
[11] C. Ionescu, Phase Constancy in a Ladder Model of Neural Dynamics. IEEE TRANSACTIONS ON SYSTEMS MAN AND CYBERNETICS PART A- SYSTEMS AND HUMANS, 42(6), 1543-1551, 2012.
[12] A. Oustaloup. La derivation non entiere. Hermes, Paris, 1995. (in French) [13] I. Podlubny. Fractional differential equations, San Diego: Academic
Press,1999.
[14] F. Mansfeld, W.J. Lorenz, Electrochemical impedance spectroscopy; applica- tions in corrosion science and technology, in R. Varma, J.R. Selman (Eds. ) , Techniques for Characterization of Electrodes and Electrochemical Processes, Wiley, New York, 581-647, 1999.
[15] A. Lasia, Electrochemical impedance spectroscopy and its applications, in R.E. White, B.E. Conway, J.O’M. Bockris (Eds.), Modern Aspects of Elec-
trochemistry, vol. 32, Kluwer Academic/Plenum Press, New York, 143-248, 1999.
[16] R. Magin, Fractional calculus in bioengineering 1. Critical Reviews in Biomedical Engineering, 32, 1-104, 2004.
[17] R. Magin, Fractional calculus in bioengineering 2. Critical Reviews in Biomedical Engineering, 32, 105-194, 2004
[18] H. Fricke, Theory of electrolytic polarization. Philosophical Magazine, ed.
Tailor and Francis, 14, 310-318, 1932.
[19] R. Lisin, B. Ginzburg, M. Schlesinger, Y. Feldman, Time domain dielectric spectroscopy study of human cells. I. Erythrocytes and ghosts. Biochimica et Biophysica Acta, 1280(1), 34-40, 1996.
[20] A. Caduff , L. Livshits , Y. Hayashi, Y. Feldman, Cell Membrane Response on d-Glucose Studied by Dielectric Spectroscopy. Erythrocyte and Ghost Suspen- sions. Journal of Physical Chemistry, 108(6), 13827-13830, 2004.
[21] Park, J.H. Kim, C.S. Choi, B.C. Ham, Biosens. Bioelectron. 19 (4), 321–324 [22] A. Tura, S. Sbrignadello, S. Barison, S. Conti, G. Pacini, Impedance spec-
troscopy of solutions at physiological. Journal of Physical Chemistry glucose concentrations, 129(2-3), 235-241, 2007.
[23] E. Barsoukov, J. Macdonald, Impedance spectroscopy theory, Experiment and Applications. New Jersey: John Wiley and Sons, 595p, 2005.
[24] D. Copot, C. Muresan. R. De Keyser, C. Ionescu, Fractional order modeling of diffusion processes: a new approach for glucose concentration estimation.
International Conference on Automation, Quality and Testing, Robotics, Cluj Napoca, Romania, 19-21 May, 2016 (accepted).
[25] R. Kadara, N. Jenkinson, C. Banks, Characterisation of commercially avail- able electrochemical sensing platforms. Sensors and Actuators B: Chemical, 138(2), 556-562, 2009.