Bulletin of the American Meteorological Society
EARLY ONLINE RELEASE
This is a preliminary PDF of the author-produced manuscript that has been peer-reviewed and accepted for publication. Since it is being posted so soon after acceptance, it has not yet been copyedited, formatted, or processed by AMS Publications. This preliminary version of the
manuscript may be downloaded, distributed, and cited, but please be aware that there will be visual differences and possibly some content differences between this version and the final published version.
The DOI for this manuscript is doi: 10.1175/BAMS-D-17-0175.1
The final published version of this manuscript will replace the preliminary version at the above DOI once it is available.
If you would like to cite this EOR in a separate work, please use the following full citation:
Andrews, E., P. Sheridan, J. Ogren, D. Hageman, A. Jefferson, J. Wendell, A.
Alastuey, L. Alados-Arboledas, M. Bergin, M. Ealo, A. Hallar, A. Hoffer, I. Kalapov, M. Keywood, J. Kim, S. Kim, F. Kolonjari, C. Labuschagne, N. Lin, A. Macdonald, O. Mayol-Bracero, I. McCubbin, M. Pandolfi, F. Reisen, S. Sharma, J. Sherman,
AMERICAN
METEOROLOGICAL
SOCIETY
© 2018 American Meteorological Society
M. Sorribas, and J. Sun, 2018: Overview of the NOAA/ESRL Federated Aerosol Network. Bull. Amer. Meteor. Soc. doi:10.1175/BAMS-D-17-0175.1, in press.
1
Overview of the NOAA/ESRL Federated Aerosol Network 1
2
Elisabeth Andrews1, Patrick J. Sheridan2, John A. Ogren2, Derek Hageman1, Anne Jefferson1, 3
Jim Wendell2, Andrés Alastuey3, Lucas Alados-Arboledas4, Michael Bergin5, Marina Ealo3, A.
4
Gannet Hallar6,7, Andras Hoffer8, Ivo Kalapov9, Melita Keywood10, Jeongeun Kim11, Sang-Woo 5
Kim12, Felicia Kolonjari13, Casper Labuschagne14, Neng-Huei Lin15, AnneMarie Macdonald13, 6
Olga L. Mayol-Bracero16, Ian B. McCubbin7, Marco Pandolfi3, Fabienne Reisen10, Sangeeta 7
Sharma13, James P. Sherman17, Mar Sorribas18, Junying Sun19 8
9
1Cooperative Institute for Research in Environmental Sciences (CIRES), University of Colorado, 10
Boulder, CO USA 11
12
2Earth System Research Laboratory (ESRL), National Oceanic and Atmospheric Administration 13
(NOAA), Boulder, CO USA 14
15
3Institute of Environmental Assessment and Water Research, Barcelona, Spain 16
17
4Andalusian Institute for Earth System Research, IISTA-CEAMA, University of Granada, 18
Granada, Spain 19
20
5Department of Civil & Environmental Engineering, Duke University, Durham, NC, USA 21
22
6University of Utah, Department of Atmospheric Science, Salt Lake City, UT, USA 23
Manuscript (non-LaTeX) Click here to download Manuscript (non-LaTeX) network_ms_20180613_final.docx
2 24
7Storm Peak Laboratory, Desert Research Institute, Steamboat Springs, CO, USA 25
26
8MTA-PE Air Chemistry Research Group, University of Pannonia, Veszprém, Hungary 27
28
9Institute for Nuclear Research and Nuclear Energy, Basic Environmental Observatory 29
Moussala, Sofia, Bulgaria 30
31
10CSIRO Oceans and Atmosphere, Aspendale, Australia 32
33
11Environmental Meteorology Research Division, National Institute of Meteorological Sciences 34
(NIMS), Seogwipo-si, Jeju-do, R. Korea 35
36
12School of Earth and Environmental Sciences, Seoul National University, Seoul, Korea 37
38
13Environment and Climate Change Canada, Toronto, Ontario, Canada 39
40
14Climate Environmental Research Monitoring (CERM), South African Weather Service, 41
Stellenbosch, South Africa 42
43
15Department of Atmospheric Sciences, National Central University, Taoyuan, Taiwan 44
45
3
16Department of Environmental Science, University of Puerto Rico - Rio Piedras, San Juan, 46
Puerto Rico, USA 47
48
17Deptartment of Physics and Astronomy, Appalachian State University, Boone, NC, USA 49
50
18El Arenosillo Atmospheric Sounding Station, Atmospheric Research and Instrumentation 51
Branch, National Institute for Aerospace Technology (INTA), Huelva, Spain 52
53
19State Key Laboratory of Severe Weather & Key Laboratory of Atmospheric Chemistry of 54
CMA, Chinese Academy of Meteorological Sciences, Beijing, Peoples Republic of China 55
56
Corresponding author: Elisabeth Andrews, 57
Email: betsy.andrews@noaa.gov 58
Address: NOAA/ESRL/GMD, 325 Broadway, Boulder, CO 80305, USA 59
Phone: 303-497-5171 60
61
4
Overview of the NOAA/ESRL Federated Aerosol Network 62
63
Capsule 64
The cooperative nature of NOAA’s Federated Aerosol Network allows for collection of 65
consistent datasets for evaluating regionally representative aerosol climatologies, trends, and 66
radiative forcing at 30 sites around the world.
67 68
Abstract 69
In order to estimate global aerosol radiative forcing, measurements of aerosol optical properties 70
are made by the NOAA Earth System Research Laboratory’s Global Monitoring Division 71
(ESRL/GMD) and their collaborators at 30 monitoring locations around the world. Many of the 72
sites are located in regions influenced by specific aerosol types (e.g., Asian and Saharan desert 73
dust, Asian pollution, biomass burning, etc.). This network of monitoring stations is a shared 74
endeavor of NOAA and many collaborating organizations, including the World Meteorological 75
Organization Global Atmosphere Watch (WMO/GAW) Program, the U.S. Department of Energy 76
(DOE), several U.S. and foreign universities, and foreign science organizations. The result is a 77
long-term, cooperative program making atmospheric measurements that are directly comparable 78
with those from all the other network stations and with shared data access. The protocols and 79
software developed to support the program facilitate participation in GAW’s atmospheric 80
observation strategy and the sites in the NOAA/ESRL network make up a substantial subset of 81
the GAW aerosol observations. This paper describes the history of the NOAA/ESRL Federated 82
Aerosol Network, details about measurements and operations and some recent findings from the 83
network measurements.
84
5 85
1. Introduction 86
Climate change is one of the most important environmental, social, economic, and political 87
issues facing the planet today. Aerosol particles may have either a warming or cooling effect at 88
the top-of-atmosphere, depending both on properties of the aerosol and the underlying surface 89
(IPCC, 2013). Atmospheric aerosol particles interact with solar radiation by absorbing and 90
scattering light. The amount of scattering and absorption is a function of particle size, 91
composition, and shape, as well as external variables like relative humidity (RH) and wavelength 92
of incident light. The regional influence of aerosol particles on climate and weather tends to be 93
stronger than their global average impact, due to their relatively short atmospheric lifetimes and 94
inhomogeneity in sources and processing. Thus, to understand the global influence of aerosol 95
particles, it is necessary to make long-term measurements at many regionally representative sites 96
(e.g., Laj et al., 2009; Lund Myhre and Baltensperger, 2012). Short-term aerosol campaign 97
measurements are typically designed to study specific processes and/or events, but long-term 98
measurements are often needed to put such data into a broader context, e.g., to assess whether 99
field campaign measurements represent that location and season, as well as for assessing trends 100
and variability. Such long-term measurements can take the form of ground-based remote 101
sensing, satellite-based remote sensing, and/or ground-based in-situ sites. While the focus here 102
is on long-term, surface in-situ sites, it is important to recognize the synergy obtained when data 103
from multiple independent platforms are combined (e.g., Ogren, 1995; Kahn et al., 2004, 2017;
104
Anderson et al., 2005). For example, combining surface measurements with airborne or remote 105
sensing platforms enables the connection of ground-based aerosol properties to vertically- 106
resolved processes. While ground-based, in-situ measurements cannot represent the properties 107
6
of aerosols that are present in layers aloft, multi-year in-situ aerosol profiling measurements over 108
two FAN sites in the US have shown that ground-based measurements of aerosol intensive 109
properties such as single scattering albedo and scattering Ångström exponent can represent the 110
climatology of those properties aloft under well-mixed conditions (Andrews et al., 2004;
111
Sheridan et al., 2012).
112 113
Numerous stations around the world make long-term in-situ measurements of regionally- 114
representative aerosol optical properties. Originally, many of these sites were operated in 115
isolation to address specific scientific goals with sampling and data protocols designed to meet 116
those goals, making it difficult to utilize those data in wider studies and inter-comparisons 117
(Kulmala et al., 2011). Several recent papers note the importance of consistent operational and 118
data processing among sites in order to improve data quality control and access across locations 119
(e.g., Kulmala et al., 2011; Wiedensohler et al., 2012). In contrast, some sites (e.g., the original 120
NOAA Baseline Observatories, Bodhaine, 1983) were conceived as part of a network where 121
similarities in instruments, protocols, and a common data archive resulted in complete intra- 122
network consistency, although extra-network comparisons were limited by differences in data 123
collection and/or treatment. Recognition of the need for consistent measurements drives the 124
development of protocols for instruments and data treatment (e.g., WMO, 2016).
125 126
This paper presents a description of the current NOAA Federated Aerosol Network (FAN), 127
which evolved from the original NOAA baseline network. The two primary purposes of this 128
paper are (1) to describe the current state of the FAN (including its member stations, the 129
measurements common to most of the stations, and the sampling and measurement protocols) 130
7
and (2) to show examples of the science that is possible with a global network of this type. A 131
number of earlier papers (e.g., Sheridan et al., 2001; Delene and Ogren, 2002; Sherman et al., 132
2015) touched on some aspects of this, utilizing small subsets of the network (1 to 4 stations) 133
but, until now, there have been no papers describing the FAN in its entirety. The paper begins 134
with a brief history of the network, discusses the key measurements and measurement protocols 135
made at network sites, describes the software for data acquisition and processing, and finally, 136
presents an overview of scientific results from FAN measurements over the last 15 years.
137 138
2. History of the NOAA Federated Aerosol Network 139
The current network mission is to characterize the means, variability, and trends of climate- 140
forcing properties of different types of aerosols, and to understand the factors that control these 141
properties. In the 1970s, NOAA’s Environmental Research Laboratories (ERL) Geophysical 142
Monitoring for Climatic Change (GMCC) Program had the mission to detect changes (i.e., 143
trends, cycles) in the long-term global aerosol background values. To do so, GMCC conducted 144
aerosol measurements at four baseline observatories. The original NOAA Baseline 145
Observatories (Mauna Loa, Hawaii (MLO), the South Pole (SPO), American Samoa (SMO), and 146
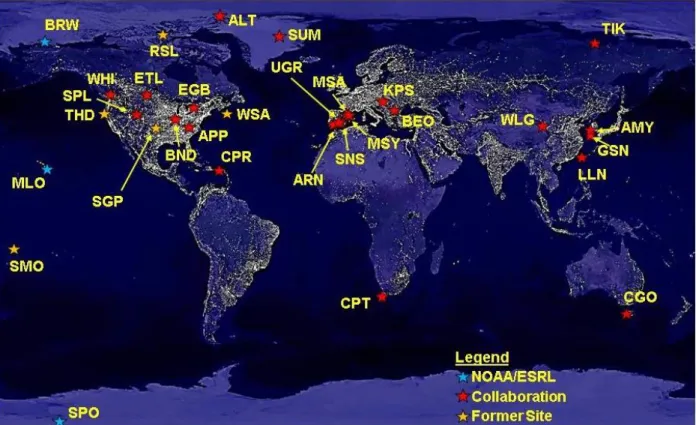
Barrow, Alaska (BRW)) appear along the left-hand side of Figure 1. These sites are remote from 147
aerosol sources and typically represent clean background air, although, occasionally, they may 148
be impacted by long range transport (e.g., Perry et al., 1999; Stone et al., 2007).
149 150
Since the initial founding of the baseline observatory network, the scientific understanding of the 151
properties and impacts of atmospheric aerosols has improved considerably. In response to the 152
finding that anthropogenic aerosols create a significant perturbation in the Earth's radiative 153
8
balance on regional scales (e.g., Bolin and Rodhe, 1976; Charlson et al., 1991), NOAA expanded 154
its aerosol research program starting in 1992 to include four sites in North America: Bondville, 155
Illinois (BND, collaboration with University of Illinois), Sable Island, Nova Scotia (WSA, 156
collaboration with Environment and Climate Change Canada), Southern Great Plains (SGP, 157
collaboration with US Department of Energy)) and Trinidad Head, California (THD). These site 158
locations were chosen because they are at times impacted by anthropogenic aerosols and 159
consequently address the need to better understandhow human activity can influence the 160
radiation balance. Although these sites are not as remote as the baseline observatories, they also 161
are not close to major anthropogenic aerosol sources (e.g., Delene and Ogren, 2002) and 162
typically provide measurements of regionally representative aerosol (e.g., Wang et al., 2018).
163 164
ESRL/GMD’s expertise in maintaining long-term measurements of aerosol optical properties 165
(often at remote locales) did not go unnoticed. Colleagues from around the world contacted 166
GMD for advice on station operations and instrument maintenance and the collaborative 167
NOAA/ESRL Federated Aerosol Network was born. The concept for and, indeed, the name of 168
the FAN, owes much to the development of the AERONET sunphotometer network in the mid- 169
1990s (Holben et al., 1998). The definition of a federation is groups “that have joined together 170
for a common purpose” (Collins, 2018). The descriptor ‘federated’ is appropriate as the result is 171
a long-term, cooperative program with shared data access making atmospheric measurements 172
that are directly comparable with all the other FAN stations. FAN collaborators contribute 173
scientific interest, instruments, onsite technicians, long-term station costs, and operations support 174
while NOAA contributes software for data acquisition and processing, as well as technical 175
expertise. It is a true partnership where both sides are learning from each other. A major 176
9
advantage is that the NOAA software and protocols streamline data acquisition and processing 177
(discussed below) so that more time can be spent on science. Since 2010, more than 50 papers 178
using FAN network data have been published (NOAA, 2018a) and multiple graduate theses have 179
also been submitted. FAN support has also improved data submission to the World Data Center 180
for Aerosols (www.gaw-wdca.org), both in terms of quantity of data submitted and quality and 181
completeness of the submitted data sets.
182 183
Since 2004, 25 sites operated by numerous collaborators have joined FAN (prior to 2004 only six 184
sites were in the network – NOAA’s four baseline observatories and 2 regional stations running 185
NOAA instruments and supervised by NOAA scientists). Many of these new cooperative aerosol 186
monitoring sites are situated in regions where significant aerosol forcing is anticipated, including 187
locations in North America, Europe, and Asia. Figure 1 illustrates that, while there is reasonable 188
global coverage, there are also some large spatial gaps (particularly in the southern hemisphere) 189
due to finite funding resources and limited infrastructure as well as the lack of collaborators in 190
those regions. NOAA has as major partners in these global and regional aerosol measurements 191
the World Meteorological Organization Global Atmosphere Watch (WMO/GAW) Program, and 192
several US and foreign universities and science agencies. Most of the collaborative stations are 193
run under the auspices of the GAW network, thus FAN sites may be considered a substantial 194
subset of the larger GAW surface in-situ aerosol monitoring network. (FAN data comprises 195
approximately 1/3 of GAW’s surface aerosol optical property measurements and dominates 196
contributions of optical properties to GAW outside of Europe). Table S1 provides more detail 197
about the sites shown in Figure 1.
198 199
3. Description of system 200
10
The basic aerosol optical property measurements made at FAN sites are spectral aerosol light 201
scattering (total and backwards hemisphere) and light absorption. These are the critical 202
parameters for determining aerosol direct radiative forcing. Most of the sites also measure 203
aerosol number concentration. Depending on the station, additional aerosol and gas-phase 204
measurements may be available. Over the years, NOAA/GMD has developed protocols and 205
instrument infrastructure in order to make measurements of known, high quality and has written 206
software to enable consistent processing, editing, and archiving of the data. NOAA (2018b) 207
provides details, design drawings and photos of the system components (inlet, instruments, 208
auxiliary control units, pumpbox, etc.), but brief descriptions of the main components are 209
provided below.
210 211
3.1 Instruments 212
Light scattering by atmospheric aerosols at the FAN stations is measured using integrating 213
nephelometers (currently, either the TSI (model 3563, TSI Inc., St Paul, MN) or the Ecotech 214
(Aurora 3000/4000, Ecotech, Melbourne, Australia) nephelometer). Both instruments measure 215
total and hemispheric aerosol back-scattering coefficients at three visible wavelengths, enabling 216
calculation of spectral aerosol properties and various proxies describing the angular distribution 217
of light scattering (e.g., Andrews et al., 2006). Table S1 describes the scattering and absorption 218
instruments at each site. Table S2 in the supplemental materials gives further details (e.g., 219
wavelengths) for the various instruments.
220 221
Aerosol light absorption is measured at FAN stations using a variety of filter-based absorption 222
instruments. Currently, the primary light absorption instruments are the ESRL/GMD-developed 223
11
three-wavelength Continuous Light Absorption Photometer (CLAP, Ogren et al., 2017) and the 224
single-wavelength Multi-Angle Absorption Photometer (MAAP, Thermo Fisher Scientific, 225
Franklin, MA). Many sites are also operating 7-wavelength aethalometers (Magee Scientific, 226
Berkeley, CA) to take advantage of that instrument’s broad spectral range. Previously, FAN 227
sites used single- and multi-wavelength Particle Soot Absorption Photometers (PSAP, Radiance 228
Research Inc., Seattle, WA) and/or broadband aethalometers.
229 230
While the instruments across the FAN are not identical, laboratory studies suggest they make 231
comparable measurements. Intercomparisons of TSI and Ecotech nephelometers show excellent 232
reproducibility for total scattering although the differences are slightly larger for backscattering 233
(Mueller et al., 2011b). Mueller et al. (2011a) find good between PSAP and MAAP 234
measurements of aerosol light absorption for a 2007 intercomparison study although less 235
agreement existed for an earlier (2005) data set. Mueller et al (2011a) also identify a fairly wide 236
range of variability in PSAPs, but show much of the variability was due to spot size variations 237
and flow rate issues. The PSAPs and CLAPs in the FAN are corrected for spot size and operated 238
at a consistent flow rate (face velocity of 0.8 m/s) to minimize these issues. Ogren et al. (2017) 239
demonstrate excellent agreement between long-term measurements with PSAPs and CLAPs at 240
multiple sites in the FAN. Sherman et al. (2015) present measurement uncertainties for 241
scattering and absorption measurements as well as for calculated parameters such as single 242
scattering albedo and Ångström exponent.
243 244
Aerosol number concentration is another common measurement at FAN sites (Table S3). The 245
most commonly used instruments for this parameter are butanol-based particle counters. Many 246
12
FAN sites operate multiple particle counters in tandem which can provide some minimal 247
information on aerosol size distribution because different models have different lower size cuts.
248
Some sites also operate instruments to measure aerosol size distributions (see Table S3).
249 250
3.2 Infrastructure and Protocols 251
The FAN is a subset of the WMO Global Atmosphere Watch, and consequently follows the 252
GAW aerosol guidelines and standard operating procedures (WMO, 2011; 2016). The WMO 253
World Calibration Center for Aerosol Physics (WCCAP, 2018) organizes instrument training and 254
evaluation workshops and performs occasional site audits that are designed to ensure consistency 255
across the GAW network. The role of FAN, in this context, is to provide advice and tools that 256
make it easier for stations operators to implement the recommended procedures for GAW 257
stations.
258 259
The FAN standard aerosol inlet configuration (NOAA, 2018c) is slightly anisokinetic (i.e., 260
Reynolds number in the range 4500-7000). The resulting turbulent conditions limit losses of 261
super micrometer particles (Wilcox, 1956). Sampling line sizes, materials, pickoffs, and flow 262
rates are optimized to promote maximum passing efficiency for particles that are most important 263
to radiative forcing (i.e., particles with diameters between 0.1 and 10 m). Because the focus is 264
primarily on optically important aerosol, bends in tubing and obstructions upstream of 265
instruments are minimized to limit particle losses due to impaction. Passing efficiencies for 266
super-micron particles are 99% and 50% for 1-2 and 7-11 m aerodynamic diameter particles, 267
respectively. Different inlet designs and/or instruments should be used for aerosol diameters 268
above this size range. The inlet is not optimized for ultrafine aerosol, however inlet passing 269
13
efficiency calculations suggest a 99% and 50% passing efficiency for 0.1 and 0.002-0.004 m 270
aerodynamic diameter particles, respectively. Figure S1 in supplemental materials shows the 271
aerosol inlet passing efficiency for several stations. Some collaborators have designed their own 272
inlet system (see Table S3). The GAW report 227 (WMO, 2016) includes guidelines for inlet 273
systems, including criteria and equations used to design them. GAW and FAN offer assistance to 274
station operators to design inlet systems and calculate losses, but every site is different (e.g., 275
surrounding terrain and vegetation, fog frequency) meaning a common design is not practical or 276
even desirable.
277 278
The network goal is to make aerosol measurements at low relative humidity (RH<40%) which 279
minimizes the confounding effects of aerosol amount and hygroscopicity on the optical 280
properties, facilitating comparison of aerosol properties among FAN sites. This objective is 281
consistent with the wider GAW sampling protocol (WMO, 2016). To achieve low RH, two 282
approaches have been used. The first involves gentle heating (to a maximum of 40º C) of the 283
sample lines and insulation of the sample lines downstream of the heater. Power is only applied 284
to the heater when the sample humidity is above the desired value. The second approach is to 285
dilute the air stream with dry, filtered air generated by a compressor system. The dilution 286
approach is typically used at warm marine sites in the network. The amount of dilution air is 287
measured and corrections to the measurements are applied automatically during data processing.
288 289
In order to fully characterize the sampling system, temperature, RH, flow, and pressure are 290
monitored at several points along the sample line. Monitoring temperature and RH in several 291
places allows determination of whether sample dewpoint temperature is maintained as the air 292
14
moves through the system. Discrepancies in system dewpoint temperature can indicate a leak in 293
the system (or, possibly, a poorly calibrated sensor). Pressure and flow measurements provide 294
diagnostics to determine whether sample air is flowing through the system as designed.
295
Additionally, both analog and digital flow and pressure measurements are implemented. The 296
analog measurements (e.g., rotameters, pressure gauges, etc.) can be assessed at a glance by an 297
on-site operator. The digital measurements are also available to the on-site operator via the data 298
acquisition interface, but are primarily intended for someone who is remotely evaluating the 299
data.
300 301
Many FAN sites make aerosol light scattering and absorption coefficient measurements at two 302
size cuts (aerodynamic particle diameter <1 and <10 m (PM1 and PM10)). ESRL/GMD has 303
designed an ‘impactor box’ to smoothly integrate size cut switching into system operations. All 304
sample air flows through a 10 m multi-jet Berner impactor (Hillamo and Kauppinen, 1991 and 305
references therein) prior to being sampled by instruments. On a time base interval ranging from 306
5 min to 30 min, depending on the site, control software closes an automated ball valve, forcing 307
the sample flow through a 1 m Berner impactor. A mass flow controller is used to control flow 308
through the impactors in order to ensure the desired size cut. The impactor box also contains 309
solenoid valves that enable the instruments to be bypassed at certain times (e.g., during impactor 310
cleaning).
311 312
The system requires only minor intervention from on-site technicians. Technician tasks include 313
nephelometer calibration gas checks (performed with CO2 and filtered air) to verify instrument 314
calibration (Anderson and Ogren, 1998); impactor cleaning; filter changes for the light 315
15
absorption instruments; and replenishing the operating fluid for number concentration 316
instruments. The frequency of these tasks depends on the site. Most sites perform nephelometer 317
calibration checks and impactor servicing on a weekly to monthly basis, while filter changes and 318
operating fluid replenishment tend to be more frequent. Figure S2 provides an example of 319
nephelometer calibration checks for FAN sites with at least 5 years of data. Annually, or 320
whenever problems are suspected, FAN protocols recommend calibration of system sensors (T, 321
P, RH, flow), cleaning of instruments and sample lines, and overnight filtered air tests on 322
scattering and absorption instruments.
323 324
It should be noted that there is currently no calibration standard for filter-based absorption 325
measurements (that is an area of active research, e.g., EMPIRBlackCarbon (2018)) but the flows 326
for the absorption instruments are calibrated annually. NOAA/GMD does not utilize a 327
calibration system for particle counters, however, two particle counters are maintained as 328
reference standards, one of which was tested at the WCCAP for connecting the FAN 329
measurements with the wider GAW network. Field CPCs are periodically tested against these 330
lab reference CPCs. The CPC flows are also checked on a regular basis. Instrument 331
intercomparisons are a major tool in the in-situ aerosol community for ensuring comparable 332
measurements, due to the lack of calibration standards. Additionally, instrument noise 333
evaluations are performed annually for scattering, absorption and number concentration 334
instruments; these evaluations consist of having the instruments measure filtered air for a 12-24 h 335
period.
336 337
3.3 Software 338
16
ESRL/GMD has developed custom software (called CPD3) for acquisition, processing, editing 339
and archiving of data from aerosol instruments that are used in the FAN. More information about 340
the software is available in supplemental materials but some key aspects are highlighted here.
341
An earlier version of the ESRL/GMD software (CPD2) is also used in the CATCOS aerosol 342
network (Capacity Building and Twinning for Climate Observing Systems, PSI (2018)). The 343
same software suite is used for both field acquisition computers and offsite data processing and 344
analysis. Scientists and technicians responsible for the data use another copy of CPD3 on their 345
desktop or laptop computers to review the data for quality and completeness and flag or remove 346
contaminated or invalid data. The CPD3 system supports direct submission of both near real- 347
time (raw data) and annual (QC-reviewed) data to the WMO World Data Center for Aerosols.
348 349
CPD3 is highly configurable, making it simple to add or remove instruments at the field site and 350
to change data logging parameters. A list of instruments that can be logged with CPD3 is 351
available from NOAA (2018d). Because all instruments are logged on the same computer using 352
the time server synched computer timestamp, the timestamp for every instrument is the same.
353
Having all the instruments and infrastructure tied together enables the system to operate 354
holistically. For example, if high particle concentrations and/or wind direction indicate local 355
contamination can flagged automatically (e.g., Sheridan et al., 2016). Similarly, chemical filters 356
can be automatically bypassed to avoid sampling contaminated air while other measurements are 357
flagged (Quinn et al., 2002).
358 359
During data review, the ability to inspect multiple data streams simultaneously in a graphical 360
interface helps both with identifying events and troubleshooting system failures. CPD3 includes 361
17
a time-stamped message log enabling the data to be directly related to operator actions and 362
observations both on the station computer and after the fact during quality control (QC) data 363
inspection and editing. CPD3 provides tools for editing and applying standard corrections (e.g., 364
standard temperature and pressure corrections, the truncation correction for the nephelometer 365
(Anderson and Ogren 1998), various schemes for correcting filter-based absorption 366
measurements (e.g., Bond et al., 1999), etc. The end result of the integrated software developed 367
at ESRL/GMD is a self-consistent data archive standardized across all stations using the 368
software. Final data from the NOAA/ESRL FAN are available from the WDCA (NILU, 2018) 369
for most stations and from the PIs in all cases.
370 371
4. FAN science 372
While the FAN methodology is useful for a single station, its real strength lies in creating 373
measurement consistency amongst multiple stations. Science questions that can be addressed 374
with this data set include:
375
What are the range and variability (on multiple time scales) of aerosol optical properties 376
observed at FAN sites?
377
How do long-term trends in aerosol properties compare across the globe?
378 379
By combining FAN data with external data sets, additional questions can be explored:
380
Can similarities and differences among sites be related to aerosol types, sources, or 381
processes?
382
How well do global models and aerosol parameterizations in models capture aerosol 383
properties across a range of sites?
384
18
How consistent are the in-situ aerosol properties measured at FAN sites with remote- 385
sensing measurements from ground- and satellite-based instruments, and how do the 386
consistencies and inconsistencies inform interpretation of the results from all three 387
approaches?
388 389
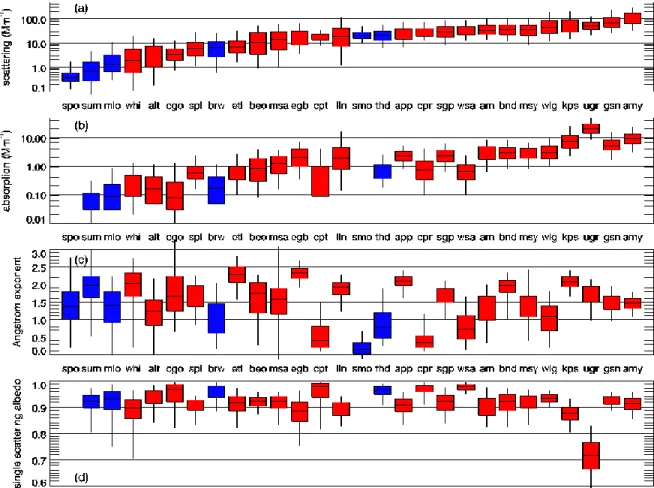
Figure 2 illustrates that the FAN sites cover a wide range of aerosol properties. Aerosol loading 390
(e.g., scattering and absorption) spans nearly four orders of magnitude. While scattering at the 391
sites is shown in monotonically increasing order, other aerosol parameters (e.g., single-scattering 392
albedo and scattering Ångström exponent, see Table 1) vary as a function of the nature of the 393
particles (e.g., size, composition) rather than aerosol amount. For example, the clean marine 394
sites (Cape Grim, Australia (CGO), Cape Point, South Africa (CPT), American Samoa (SMO), 395
Trinidad Head, CA (THD) and Cape San Juan, PR (CPR)) exhibit low scattering Ångström 396
exponent (SAE) values indicative of large sea salt aerosol, while the low SAE at Mount 397
Waliguan, China (WLG) can be attributed to large dust particles. Median single-scattering 398
albedo (SSA) values are around 0.92 at most sites, although the clean marine sites exhibit higher 399
SSA values due to predominantly white sea salt aerosol. In contrast, UGR exhibits significantly 400
lower SSA relative to the other sites in the FAN network – the site is strongly impacted by 401
diesel-based traffic and local biomass burning (Titos et al., 2017). The standardized FAN 402
sampling and data processing protocols help ensure that the reported differences between stations 403
are real and not related to operational inconsistencies. Table S1 in the supplemental materials 404
provides more information about the stations and measurement data depicted in Figure 2. Figure 405
S3 in supplemental materials shows the same data depicted in Figure 2 in separate sets of panes 406
with aerosol scattering coefficient ordered by (a) elevation, (b) latitude and (c) longitude.
407
19 408
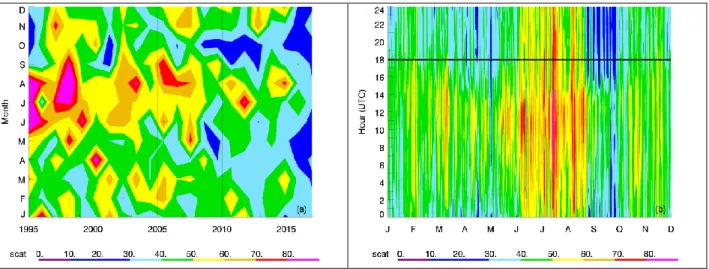
While Figure 2 shows annual climatological values for all sites in the network, more detailed 409
climatologies can be evaluated as well. Figure 3 shows climatological patterns of aerosol light 410
scattering at Bondville, IL as a function of year, month and day of year. Figure 3a shows that 411
there has been a decrease in aerosol light scattering at Bondville since the start of measurements 412
in the mid-1990s and that this decrease appears to have impacted scattering during all months at 413
the site. This result is consistent with other literature documenting decreases in aerosol loading 414
over most of the continental U.S. (e.g., Collaud Coen et al., 2013). Although aerosol amounts 415
have decreased over the last two decades, the general picture of higher scattering during the 416
summer remains true. Figure 3b depicts how the diurnal cycle varies with time of year. In the 417
summer, the scattering is high throughout the day, while at other times of year the diurnal cycle 418
is much more pronounced (similar to the observations of Sherman et al. (2015)). The diurnal 419
minimum occurs in the early afternoon, most likely due to an increase in boundary layer height.
420 421
Detailed multi-site climatologies, including data from FAN observatories, based on location 422
(e.g., mountain sites (Andrews et al., 2011); North American sites (e.g., Sherman et al., 2015;
423
Delene and Ogren, 2002); and Arctic sites (Schmeisser et al., 2018)) have been published. Sites 424
in the FAN are often members of other networks (e.g., ACTRIS, 2018; IASOA, 2018) and are 425
included in reports on their climatologies as well (e.g., Uttal et al., 2016; Zanatta et al., 2016;
426
Pandolfi et al., 2018). Additionally, with multiple sites one can look at the co-variability of 427
different aerosol properties and start to identify relationships as a function of site and aerosol 428
type (e.g., Delene and Ogren, 2002; Andrews et al., 2011; Sherman et al., 2015; Schmeisser et 429
al., 2017). Trend studies have also used data from multiple FAN sites as the focus of their 430
20
investigation (e.g., Asmi et al., 2013; Collaud Coen et al., 2013; Sherman et al., 2015) to explore 431
changes in aerosol properties as a function of location.
432 433
An additional advantage of the unified FAN data set is that it can be used to assess and improve 434
global models. Multiple studies use FAN number concentration data to evaluate various 435
parameterizations of aerosol nucleation (e.g., Spracklen et al., 2010; Matsui et al., 2013; Mann et 436
al., 2014; Yu et al., 2014). Skeie et al. (2011) evaluated how well the Oslo CTM2 model 437
simulated absorbing aerosol in terms of loading and seasonality at multiple FAN stations. There 438
are several modeling studies using Arctic sites FAN data. For example, Sharma et al. (2013) 439
explored the sensitivity of absorbing aerosol to wet and dry deposition, while Eckhardt et al.
440
(2015) used Arctic surface measurements to evaluate simulated model climatologies. Currently, 441
the FAN data are being utilized to evaluate AEROCOM (Kinne et al., 2006) global model 442
simulations of surface aerosol scattering and absorption coefficients (Andrews et al., in 443
preparation, 2018).
444 445
While the FAN data consistency allows for collective science using data from multiple sites, the 446
unique locations and interests of scientists involved with each site have also resulted in many 447
findings. For example, there have been both climatological and transport event-based studies 448
focused on aerosol types observed at individual sites (e.g., Lim et al., 2012; Hallar et al., 2015;
449
Sorribas et al., 2015; 2017; Denjean et al., 2016; Rivera et al., 2017; Kassianov et al., 2017).
450
FAN measurements have been used to provide context for field campaigns (e.g., Brock et al., 451
2011; Bravo-Aranda et al., 2015; Denjean et al., 2016), instrument comparisons (e.g., Sharma 452
and Barnes, 2016; Backman et al., 2017; Sinha et al., 2017; Sharma et al., 2017); remote sensing 453
21
validation (e.g., Pahlow et al., 2006; Di Pierro et al., 2013; Shinozuka et al., 2015) ); aerosol 454
direct radiative forcing sensitivities and uncertainties (e.g. Sherman and McComiskey, 2018), 455
and many other scientific efforts.
456 457
Uniting observatories under the umbrella of the Federated Aerosol Network provides the 458
opportunity to both train and learn from a diverse group of US and international partners. The 459
federated nature of the network enables scientists to pursue their own interests while 460
participating in a wider goal, making the network greater than sum of its individual parts. In the 461
process of increasing understanding of the range and variability in aerosol radiative properties, 462
the FAN strengthens scientific ties across the globe, fostering collaborations and the exchange of 463
knowledge. In the FAN’s next 25 years, the objective is to maintain current collaborations and 464
to establish new ones to expand the network, particularly in under-sampled regions. The FAN 465
will continue to improve measurements, software and protocols in order to be able to address 466
new questions as they arise. For example, in the future, a complementary network comprised of 467
new, low-cost sensors could be developed or even used to expand the FAN or other networks 468
pending guidance from WMO/GAW (e.g., WMO, 2018).
469 470
5. Conclusions 471
The FAN is a long-term, cooperative program enabling diverse sites with a wide range of aerosol 472
types to make measurements that are directly comparable with other network stations. This 473
facilitates the exploration of science questions at local, regional, and global scales and makes the 474
network measurements especially useful for global model evaluation. There is a need to expand 475
such measurements to locations that have large impacts by aerosols but little current 476
22
representation in measurement databases, but of course many factors (e.g., funding) will 477
determine whether this really takes place. The growth and scope of NOAA’s collaborative 478
network can be a model for new and existing networks which seek to expand coverage in a 479
collaborative fashion.
480 481
Acknowledgements 482
The writing of this manuscript was supported by NOAA Climate Program Office’s Atmospheric 483
Chemistry, Carbon Cycle and Climate (AC4) program. The FAN network would not be possible 484
without the interest and support of our collaborators and their students and/or technicians who 485
maintain the stations and instruments, and keep the data flowing from their observatories.
486 487 488
23 References
489
ACTRIS, 2018: Research Infrastructure for the observation of Aerosol, Clouds, and Trace gases.
490
Accessed 21 May 2018, https://www.actris.eu/.
491 492
Anderson, T.L., and Coauthors, 2005: An “A-Train” Strategy for Quantifying Direct Climate 493
Forcing by Anthropogenic Aerosols. Bull. Amer. Meteor. Soc., 86, 1795-1809, 494
https://doi.org/10.1175/BAMS-86-12-1795.
495 496
Anderson, T.L. and Ogren, J.A., 1998: Determining aerosol radiative properties using the TSI 497
3563 integrating nephelometer, Aerosol Sci. Tech., 29, 57-69, doi:10.1080/02786829808965551.
498 499
Andrews, E., and Coauthors, 2018: Comparison of aerosol optical property climatology from in- 500
situ observations and global climate model simulations, in preparation.
501 502
Andrews, E., and Coauthors, 2011: Climatology of aerosol radiative properties in the free 503
troposphere, Atmos. Res., 102, 365-393, https://doi.org/10.1016/j.atmosres.2011.08.017.
504 505
Andrews, E., and Coauthors, 2006: Comparison of methods for deriving aerosol asymmetry 506
parameter, J. Geophys. Res., 111, doi:10.1029/2004JD005734.
507 508
Andrews, E., Sheridan, P. J., Ogren, J. A., and Ferrare, R., 2004: In situ aerosol profiles over the 509
Southern Great Plains cloud and radiation testbed site: 1. Aerosol optical properties, J. Geophys.
510
Res., 109, D06208, doi:10.1029/2003JD004025.
511
24 512
Asmi, A., and Coauthors, 2013: Aerosol decadal trends – Part 2: In-situ aerosol particle number 513
concentrations at GAW and ACTRIS stations, Atmos. Chem. Phys., 13, 895-916, 514
https://doi.org/10.5194/acp-13-895-2013.
515 516
Backman, J. and Coauthors, 2016: On Aethalometer measurement uncertainties and multiple 517
scattering enhancement in the Arctic, Atmos. Meas. Tech., accepted, 518
https://doi.org/10.5194/amt-2016-294.
519 520
Bodhaine, B. A., 1983: Aerosol measurements at four background sites, J. Geophys. Res., 88, 521
10753–10768, doi:10.1029/JC088iC15p10753.
522 523
Bolin, B. and Charlson, R.J., 1976: On the role of the tropospheric sulfur cycle in the shortwave 524
radiative climate of the Earth, Ambio, 3, 47-54.
525 526
Bond, T. C., Anderson, T. L., and Campbell, D., 1999: Calibration and intercomparison of filter- 527
based measurements of visible light absorption by aerosols, Aerosol Sci. Technol., 30, 582–600, 528
doi:10.1080/027868299304435.
529 530
Bravo-Aranda, J.A. and Coauthors, 2015: Study of mineral dust entrainment in the planetary 531
boundary layer by lidar depolarisation technique, Tellus B, 67, 26180, doi:
532
10.3402/tellusb.v67.26180.
533 534
25
Brock, C.A. and Coauthors, 2011: Characteristics, sources, and transport of aerosols measured in 535
spring 2008 during the aerosol, radiation, and cloud processes affecting Arctic Climate 536
(ARCPAC) Project, Atmos. Chem. Phys., 11, 2423-2453, 537
https://doi.org/10.5194/acp-11-2423-2011.
538 539
Charlson, R.J., Langner, J., Rodhe, H., Leovy, C.B., and Warren, S.G., 1991: Perturbation of the 540
northern hemisphere radiative balance by backscattering from anthropogenic sulfate aerosols, 541
Tellus, 43AB, 152-163, doi:10.1034/j.1600-0870.1991.00013.x.
542 543
Collaud Coen, M., and Coauthors, 2013: Aerosol decadal trends – Part 1: In-situ optical 544
measurements at GAW and IMPROVE stations, Atmos. Chem. Phys., 13, 869-894, 545
https://doi.org/10.5194/acp-13-869-2013.
546 547
Collins., 2018: Definition of 'federated'. Accessed 21 May 2018, 548
https://www.collinsdictionary.com/us/dictionary/english/federated 549
550
Delene, D. J. and Ogren, J. A., 2002: Variability of aerosol optical properties at four North 551
American surface monitoring sites, J. Atmos. Sci., 59, 1135–1150, doi:10.1175/1520- 552
0469(2002)059<1135:VOAOPA>2.0.CO;2.
553 554
Denjean, C. and Coauthors, 2016: Size distribution and optical properties of African mineral dust 555
after intercontinental transport, J. Geophys. Res., 121, 7117-7138, doi:10.1002/2016JD024783.
556 557
26
Di Pierro, M., Jaegle, L., Eloranta, E.W., Sharma, S., 2013: Spatial and seasonal distribution of 558
Arctic aerosols observed by the CALIOP satellite instrument (2006–2012), Atmos. Chem. Phys., 559
13, 13, 7075-7095, https://doi.org/10.5194/acp-13-7075-2013.
560 561
Eckhardt, S. and Coauthors, 2015: Current model capabilities for simulating black carbon and 562
sulfate concentrations in the Arctic atmosphere: a multi-model evaluation using a comprehensive 563
measurement data set, Atmos. Chem, Phys., 15, 9413–9433, doi:10.5194/acp-15-9413-2015.
564 565
EMPIRBlackCarbon, 2018: Black Carbon Metrology for light absorption by atmospheric 566
aerosols. Accessed 21 May 2018, http://www.empirblackcarbon.com.
567 568
Hallar, A.G., Petersen, R., Andrews, E., Michalsky, J., McCubbin, I., Ogren, J.A., 2015:
569
Contributions of dust and biomass-burning to aerosols at a Colorado mountain-top site, Atmos.
570
Chem. Phys., 15, 13665-13679, https://doi.org/10.5194/acp-15-13665-2015.
571 572
Hillamo, R.E. and Kauppinen, E.I, 1991: On the performance of the Berner low pressure 573
impactor, Aerosol Sci. Technol., 14, 33-47, doi: 10.1080/02786829108959469.
574 575
Holben, B.N. and Coauthors, 1998: AERONET - A federated instrument network and data 576
archive for aerosol characterization. Remote Sensing of Environment, 66, 1-16, 577
https://doi.org/10.1016/S0034-4257(98)00031-5.
578 579
27
IASOA, 2018: International Arctic Systems for Observing the Atmosphere. Accessed 21 May 580
2018, https://www.esrl.noaa.gov/psd/iasoa/.
581 582
IPCC, 2013: Climate Change 2013: The Physical Science Basis. Contribution of Working 583
Group I to the Fifth Assessment Report of the Intergovernmental Panel on Climate Change, 584
[Stocker, T.F., D. Qin, G.-K. Plattner, M. Tignor, S.K. Allen, J. Boschung, A. Nauels, Y. Xia, V.
585
Bex and P.M. Midgley (eds.)]. Cambridge University Press, Cambridge, United Kingdom and 586
New York, NY, USA, 1535 pp, doi:10.1017/CBO9781107415324.
587 588
Kahn, R.A. and Coauthors, 2004: Aerosol data sources and their roles within PARAGON, Bull.
589
Amer. Meteor. Soc., 85, 1155-1122, https://doi.org/10.1175/BAMS-85-10-1511.
590 591
Kahn, R.A. and Coauthors, 2017: SAM-CAAM: A Concept for Acquiring Systematic Aircraft 592
Measurements to Characterize Aerosol Air Masses, Bull. Amer. Meteor. Soc, 98, 2215-2228, 593
https://doi.org/10.1175/BAMS-D-16-0003.1.
594 595
Kassianov, E. and Coauthors, 2017: Large Contribution of Coarse Mode to Aerosol 596
Microphysical and Optical Properties: Evidence from Ground-Based Observations of a 597
Transpacific Dust Outbreak at a High-Elevation North American Site, J. Atmos. Sci., 74, 1431- 598
1443, https://doi.org/10.1175/JAS-D-16-0256.1.
599 600
28
Kinne, S., and Coauthors, 2006: An AeroCom initial assessment – optical properties in aerosol 601
component modules of global models, Atmos. Chem. Phys., 6, 1815–1834, doi:10.5194/acp-6- 602
1815-2006.
603 604
Kulmala M., and Coauthors, 2011: General overview: European Integrated project on Aerosol 605
Cloud Climate and Air Quality interactions (EUCAARI) – integrating aerosol research from 606
nano to global scales, Atmos. Chem. Phys., 11, 13061–13143, https://doi.org/10.5194/acp-11- 607
13061-2011.
608 609
Laj, P., and Coauthors, 2009: Measuring atmospheric composition change, Atmos. Environ., 43, 610
5351-5414, doi:10.1016/j.atmosenv.2009.08.020.
611 612
Lim, S., Lee, M., Lee, G., Kim, S., Kang, K., 2012: Ionic and carbonaceous compositions of 613
PM10, PM2.5 and PM1.0 at Gosan ABC Superstation and their ratios as source signature,"
614
Atmos. Chem. Phys., 12, 2007-2024, https://doi.org/10.5194/acp-12-2007-2012.
615 616
Lund Myhre, C. and Baltensperger, U., 2012: Recommendations for a Composite Surface-Based 617
Aerosol Network, WMO/GAW Report 207, World Meteorological Organization, Geneva, 618
http://library.wmo.int/pmb_ged/gaw_207.pdf.
619 620
Mann, G.W. and Coauthors, 2014: Intercomparison and evaluation of global aerosol 621
microphysical properties among AeroCom models of a range of complexity, Atmos. Chem.
622
Phys., 14, 4679–4713, doi:10.5194/acp-14-4679-2014.
623
29 624
Matsui, H. and Coauthors, 2013: Spatial and temporal variations of new particle formation in 625
East Asia using an NPF-explicit WRF-chem model: North-south contrast in new particle 626
formation frequency, J. Geophys. Res., 118, 11647–11663, doi:10.1002/jgrd.50821.
627 628
Mueller, T. and Coauthors, 2011a: Characterization and intercomparison of aerosol absorption 629
photometers: result of two intercomparison workshops, Atmos. Meas. Tech., 4, 245-268, 630
doi:10.5194/amt-4-245-2011.
631 632
Mueller, T., Laborde, M., Kassell, G., and Wiedensohler, A., 2011b: Design and performance of 633
a three-wavelength LED-based total scatter and backscatter integrating nephelometer, Atmos.
634
Meas. Tech., 4, 1291-1303, doi:10.5194/amt-4-1291-2011.
635 636
NILU, 2018: EMEP: Hosting the GAW WDCA, Accessed 21 May 2018, http://ebas.nilu.no/.
637 638
NOAA, 2018a: Network publications. Accessed 21 May 2018, 639
ftp://aftp.cmdl.noaa.gov/aerosol/doc/newsletter/publications.html.
640 641
NOAA, 2018b: ESRL/GMD Aerosol Measurements. Accessed 21 May 2018, 642
https://www.esrl.noaa.gov/gmd/aero/instrumentation/instrum.html.
643 644
NOAA, 2018c: Aerosol System Inlet. Accessed 21 May 2018, 645
https://www.esrl.noaa.gov/gmd/aero/instrumentation/inlet_system.html.
646
30 647
NOAA, 2018d: CPD3 loggable instruments. Accessed 21 May 2018, 648
https://www.esrl.noaa.gov/gmd/instrumentation/cpd_inst.html 649
650
Ogren, J.A., 1995: A systematic approach to in-situ observation of aerosol properties, In:
651
Aerosol Forcing of Climate, eds. R. Charlson and J. Heintzenberg, John Wiley & Sons, Ltd., 652
215-226.
653 654
Ogren, J.A., Wendell, J., Andrews, E., and Sheridan, P., 2017: Continuous light absorption 655
photometer for long-term studies, Atmos. Meas. Tech., 10, 4805-4818, 656
https://doi.org/10.5194/amt-10-4805-201.
657 658
Pahlow, M. and Coauthors, 2006: Comparison between lidar and nephelometer measurements of 659
aerosol hygroscopicity at the Southern Great Plains Atmospheric Radiation Measurement site, J.
660
Geophys. Res., 111, doi:10.1029/2004JD005646.
661 662
Pandolfi, M. and Coauthors, 2018: A European aerosol phenomenology-6: Scattering properties 663
of atmospheric aerosol particles from 28 ACTRIS sites, Atmos. Chem. Phys., 18, 7877-7911, 664
https://doi.org/10.5194/acp-18-7877-2018.
665 666
Perry, K.D., Cahill, T.A., Schnell, R.C., and Harris, J.M., 1999: Long-range transport of 667
anthropogenic aerosols to the National Oceanic and Atmospheric Administration baseline station 668
31
at Mauna Loa Observatory, Hawaii, J. Geophys. Res., 104, 18521-18533, 669
doi:10.1029/1998JD100083.
670 671
PSI, 2018: CATCOS Aerosol Measurements. Accessed 21 May 2018, 672
https://www.psi.ch/catcos/.
673 674
Quinn P. K., Miller, T. L., Bates, T. S., Ogren, J. A., Andrews, E., and Shaw, G. E., 2002: A 3- 675
year record of simultaneously measured aerosol chemical and optical properties at Barrow, 676
Alaska, J. Geophys. Res., 107, doi:10.1029/2001JD001248.
677 678
Rivera, H., Ogren, J.A., Andrews, E., Mayol-Bracero, O.L., 2017: Variations in the 679
physicochemical and optical properties of natural aerosols in Puerto Rico – Implications for 680
climate, Atmos. Chem. Phys. Disc., in review, https://doi.org/10.5194/acp-2017-703.
681 682
Schmeisser, L., and Coauthors, 2017: Classifying aerosol type using in-situ surface spectral 683
aerosol optical properties, Atmos. Chem. Phys., 17, 12097-12120, https://doi.org/10.5194/acp-17- 684
12097-2017.
685 686
Schmeisser, L., and Coauthors, 2018: Seasonality of aerosol optical properties in the Arctic, 687
Atmos. Chem. Phys. Disc, in review, https://www.atmos-chem-phys-discuss.net/acp-2017-1117..
688 689
Sharma, N.C.P., Barnes, J.E., 2016: Boundary layer characteristics over a high altitude station, 690
Mauna Loa Observatory, Aerosol Air Qual. Res., 16, 729-737, doi:10.4209/aaqr.2015.05.0347.
691
32 692
Sharma, S., and Coauthors, 2017: An evaluation of three methods for measuring black carbon at 693
Alert, Canada, Atmos. Chem. Phys. Discuss., 17, https://doi.org/10.5194/acp-2017-339, in 694
review.
695 696
Sharma, S., Ishizawa, M, Chan, D., Lavoué, D., Andrews, E., Eleftheriadis, K and 697
Maksyutov, S., 2013: 16-year simulation of Arctic black carbon: transport, source contribution, 698
and sensitivity analysis on deposition, J. Geophys. Res., 118, doi:10.1029/2012JD017774.
699 700
Sheridan, P.J., Delene, D.J., and Ogren, J.A., 2001: Four years of continuous surface aerosol 701
measurements from the Department of Energy’s Atmospheric Radiation Measurement Program 702
Southern Great Plains Cloud and Radiation Testbed site, J. Geophys. Res. 106, 20735-20747, 703
doi:10.1029/2001JD000785.
704 705
Sheridan, P.J., Andrews, E., Ogren, J.A., Tackett, J., Winker, D.M., 2012: Vertical profiles of 706
aerosol optical properties over central Illinois and comparison with surface and satellite 707
measurements," Atmos. Chem. Phys., 12, 11695-11721, doi: 10.5194/acp-12-11695-2012.
708 709
Sheridan, P.J., Andrews, E., Schmeisser, L., Vasel, B., and Ogren, J.A., 2016: Aerosol 710
Measurements at South Pole: Climatology and Impact of Local Contamination, AAQR, 16, 855- 711
872, doi:10.4209/aaqr.2015.05.0358.
712 713
33
Sherman, J. P. and McComiskey, A., 2018: Measurement-based climatology of aerosol direct 714
radiative effect, its sensitivities, and uncertainties from a background southeast U.S. site, Atmos.
715
Chem. Phys., 18, 4131-4152, https://doi.org/10.5194/acp-18-4131-2018.
716 717
Sherman, J.P., Sheridan, P.J., Ogren, J.A., Andrews, E., Hageman, D.C., Schmeisser, L., 718
Jefferson, A., and Sharma, S., 2015: A multi-year study of lower tropospheric aerosol variability 719
and systematic relationships from four North American regions, Atmos. Chem. Phys., 15, 12487- 720
12517, https://doi.org/10.5194/acp-15-12487-2015.
721 722
Shinozuka, Y., and Coauthors, 2015: The relationship between cloud condensation nuclei (CCN) 723
concentration and light extinction of dried particles: indications of underlying aerosol processes 724
and implications for satellite-based CCN estimates, Atmos. Chem. Phys., 15, 7585-7604, 725
https://doi.org/10.5194/acp-15-7585-2015.
726 727
Sinha, P.R. and Coauthors, 2017: Evaluation of ground-based black carbon measurements by 728
filter-based photometers at two Arctic sites, J. Geophys. Res., 122, 3544-3572, 729
doi:10.1002/2016JD025843.
730 731
Skeie, R.B, Berntsen, T., Myhre, G., Pedersen, J.A., Strom, J., Gerland, S., and Ogren, J.A., 732
2011: Black carbon in the atmosphere and snow, from pre-industrial times until present, Atmos.
733
Chem. Phys., 11, 6809-6836, https://doi.org/10.5194/acp-11-6809-2011.
734 735
34
Sorribas, M., Andrews, E., Adame, J.A., Yela, M., 2017: An anomalous African dust event and 736
its impact on aerosol radiative forcing on the Southwest Atlantic coast of Europe in February 737
2016, Sci. Tot. Environ., 583, 269-279, https://doi.org/10.1016/j.scitotenv.2017.01.064.
738 739
Sorribas, M., Ogren, J.A., Olmo, F.J., Quirantes, A., Fraile, R., Gil-Ojeda, M., Alados- 740
Arboledas, L., 2015: Assessment of African desert dust episodes over the southwest Spain at sea 741
level using in situ aerosol optical and microphysical properties, Tellus B, 67, doi:
742
https://doi.org/10.3402/tellusb.v67.27482.
743 744
Spracklen, D. V., and Coauthors, 2010: Explaining global surface aerosol number concentrations 745
in terms of primary emissions and particle formation, Atmos. Chem. Phys., 10, 4775-4793, 746
https://doi.org/10.5194/acp-11-10661-2011.
747 748
Stone, R.S., Anderson, G.P., Andrews, E., Dutton, E.G., and Shettle, E.P., 2007: Incursions and 749
radiative impact of Asian dust in northern Alaska, Geophys. Res. Lett., 34, 750
doi:10.1029/2007GL029878 . 751
752
Titos, G. and Coauthors, 2017: Spatial and temporal variability of carbonaceous aerosols:
753
Assessing the impact of biomass burning in the urban environment, Sci. Tot. Environ., 578, 613- 754
625, doi:10.1016/j.scitotenv.2016.11.007.
755 756 757
35
Uttal T., and Coauthors, 2016: International Arctic Systems for Observing the Atmosphere: An 758
International Polar Year Legacy Consortium, Bull. Amer. Meteor. Soc., 97, 1033-1056, 759
https://doi.org/10.1175/BAMS-D-14-00145.1.
760 761
Wang, R., and Coauthors, 2018: Representativeness error in the ground-level observation 762
networks for black carbon radiation absorption, Geophys. Res. Lett.,doi:10.1002/2017GL076817.
763 764
WCCAP, 2018: World Calibration Centre for Aerosol Physics, Accessed 21 May 2018, 765
http://www.wmo-gaw-wcc-aerosol-physics.org.
766 767
Wiedensohler, A., and Coauthors, 2012: Mobility particle size spectrometers: harmonization of 768
technical standards and data structure to facilitate high quality long-term observations of 769
atmospheric particle number size distributions, Atmos. Meas. Tech., 5, 657-685, 770
doi:10.5194/amt-5-657-2012.
771 772
Wilcox, J.D., 1956: Isokinetic Flow and Sampling, J. Air Poll. Contr. Assoc., 5, 226-245, doi:
773
10.1080/00966665.1956.10467715 774
775
WMO, 2011: WMO/GAW Standard Operating Procedures for In-situ Measurements of Aerosol 776
Mass Concentration, Light Scattering and Light Absorption, GAW Report No. 200, World 777
Meteorological Organization, Geneva, http://library.wmo.int/pmb_ged/gaw_200.pdf.
778 779
36
WMO, 2016: WMO/GAW Aerosol Measurement Procedures, Guidelines, and 780
Recommendations, GAW Report No. 227, World Meteorological Organization, Geneva, 781
https://library.wmo.int/opac/doc_num.php?explnum_id=3073.
782 783
WMO, 2018: Low-cost sensors for the measurement of atmospheric composition: overview of 784
topic and future applications, WMO Report No. 1215, World Meteorological Organization, 785
Geneva, 786
https://www.wmo.int/pages/prog/arep/gaw/documents/Low_cost_sensors_post_review_final.pdf.
787 788
Yu, F. and Hallar, A.G., 2014: Difference in particle formation at a mountaintop location during 789
spring and summer: implications for the role of sulfuric acid and organics in nucleation, J.
790
Geophys. Res., 119, 12246-12255, doi:10.1002/2014JD022136.
791 792
Zanatta, M. and Coauthors, 2016: A European aerosol phenomenology-5: Climatology of black 793
carbon optical properties at 9 regional background sites across Europe, Atmos. Environ., 145, 794
346-364, http://dx.doi.org/10.1016/j.atmosenv.2016.09.035.
795 796
37
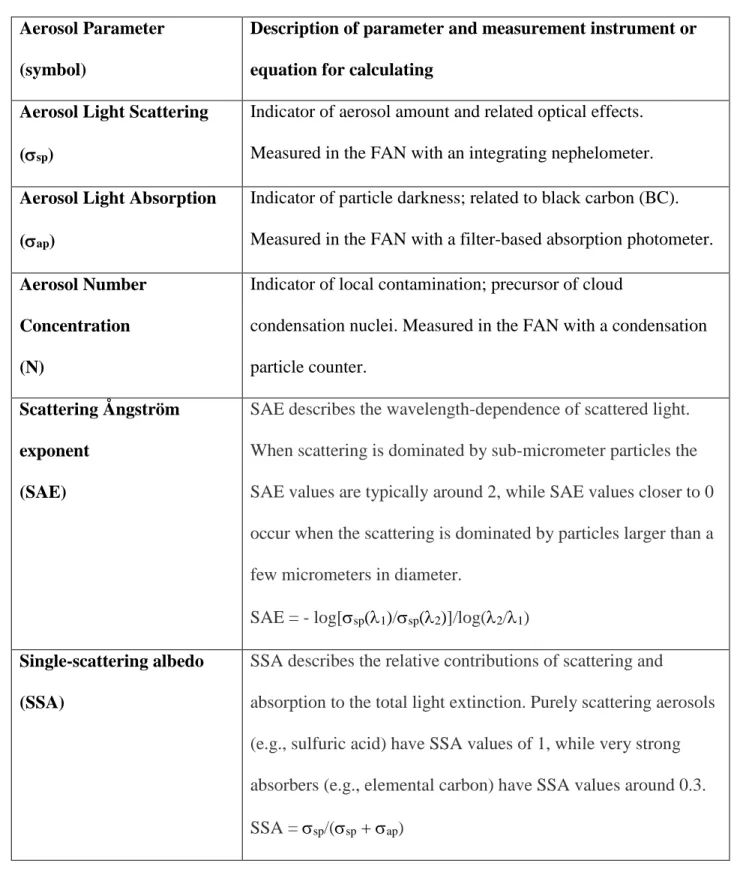
Table 1. Description of aerosol parameters mentioned in text 797
Aerosol Parameter (symbol)
Description of parameter and measurement instrument or equation for calculating
Aerosol Light Scattering (sp)
Indicator of aerosol amount and related optical effects.
Measured in the FAN with an integrating nephelometer.
Aerosol Light Absorption (ap)
Indicator of particle darkness; related to black carbon (BC).
Measured in the FAN with a filter-based absorption photometer.
Aerosol Number Concentration (N)
Indicator of local contamination; precursor of cloud
condensation nuclei. Measured in the FAN with a condensation particle counter.
Scattering Ångström exponent
(SAE)
SAE describes the wavelength-dependence of scattered light.
When scattering is dominated by sub-micrometer particles the SAE values are typically around 2, while SAE values closer to 0 occur when the scattering is dominated by particles larger than a few micrometers in diameter.
SAE = - log[sp(1)/sp(2)]/log(2/1) Single-scattering albedo
(SSA)
SSA describes the relative contributions of scattering and
absorption to the total light extinction. Purely scattering aerosols (e.g., sulfuric acid) have SSA values of 1, while very strong absorbers (e.g., elemental carbon) have SSA values around 0.3.
SSA = sp/(sp + ap) 798
38 Figure Captions
799 800
Figure 1. Map of current and former long-term sites in FAN network superimposed on a 801
nighttime lights image (Credit: NASA Earth Observatory/NOAA NGDC). Former sites RSL, 802
SGP and WSA were FAN collaborations, while THD and SMO were solely NOAA 803
observations.
804 805
Figure 2. Annual aerosol climatology for long-term sites in network. Stations are ordered by 806
increasing scattering coefficient. (a) scattering coefficient; (b) absorption coefficient; (c) 807
scattering Ångström exponent (d) single-scattering albedo. Scattering and absorption have units 808
of Mm-1, scattering Ångström exponent and single-scattering albedo are unitless. Values are 809
reported at 550 nm, scattering Ångström exponent is calculated for the blue/green wavelength 810
pair. Whiskers represent 5th and 95th percentiles, edges of box are 25th and 75th percentiles and 811
midpoint line in box is median value of annual climatology. Blue indicates NOAA observatories, 812
red indicates collaborator sites. Some sites are not shown due little available data (e.g., less than 813
a year of data available or data not yet being QC’d).
814 815
Figure 3. Long-term climatology of aerosol light scattering (at 550 nm) in units of Mm-1 at 816
Bondville. (a) monthly variability as function of year; (b) diurnal variability as function of month 817
(thick black horizontal line indicates local noon). Both plots are based on data obtained from 818
1995 through 2016.
819 820
39 821
822
Figure 1. Map of current and former long-term sites in FAN network superimposed on a 823
nighttime lights image (Credit: NASA Earth Observatory/NOAA NGDC). Former sites RSL, 824
SGP and WSA were FAN collaborations, while THD and SMO were solely NOAA 825
observations.
826
40 827
Figure 2. Annual aerosol climatology for long-term sites in network. Stations are ordered by 828
increasing scattering coefficient. (a) scattering coefficient; (b) absorption coefficient; (c) 829
scattering Ångström exponent (d) single-scattering albedo. Scattering and absorption have units 830
of Mm-1, scattering Ångström exponent and single-scattering albedo are unitless. Values are 831
calculated from daily averages reported at (or adjusted to) 550 nm, scattering Ångström exponent 832
is calculated for the blue/green wavelength pair. Whiskers represent 5th and 95th percentiles, 833
edges of box are 25th and 75th percentiles and midpoint line in box is median value of annual 834
climatology. Blue indicates NOAA observatories, red indicates collaborator sites. Some sites are 835
not shown due to little available data (e.g., less than a year of data available or data not yet being 836
QC’d).
837 838
41 839
840
Figure 3. Long-term climatology of aerosol light scattering (at 550 nm) in units of Mm-1 at 841
Bondville. (a) monthly variability as function of year; (b) diurnal variability as function of month 842
(thick black horizontal line indicates local noon). Both plots are based on data obtained from 843
1995 through 2016.
844