https://doi.org/10.5194/acp-18-7877-2018
© Author(s) 2018. This work is distributed under the Creative Commons Attribution 4.0 License.
A European aerosol phenomenology – 6: scattering properties of atmospheric aerosol particles from 28 ACTRIS sites
Marco Pandolfi1, Lucas Alados-Arboledas2, Andrés Alastuey1, Marcos Andrade3, Christo Angelov4, Begoña Artiñano5, John Backman6,7, Urs Baltensperger8, Paolo Bonasoni9, Nicolas Bukowiecki8,
Martine Collaud Coen10, Sébastien Conil11, Esther Coz5, Vincent Crenn12,13, Vadimas Dudoitis14, Marina Ealo1, Kostas Eleftheriadis15, Olivier Favez16, Prodromos Fetfatzis15, Markus Fiebig17, Harald Flentje18, Patrick Ginot19, Martin Gysel8, Bas Henzing20, Andras Hoffer21, Adela Holubova Smejkalova22,23, Ivo Kalapov4, Nikos Kalivitis24,25, Giorgos Kouvarakis24, Adam Kristensson26, Markku Kulmala6, Heikki Lihavainen7, Chris Lunder17, Krista Luoma6, Hassan Lyamani2, Angela Marinoni9, Nikos Mihalopoulos24,25, Marcel Moerman20, José Nicolas27, Colin O’Dowd28, Tuukka Petäjä6, Jean-Eudes Petit12,16, Jean Marc Pichon27, Nina Prokopciuk14, Jean-Philippe Putaud29,
Sergio Rodríguez30, Jean Sciare12,a, Karine Sellegri27, Erik Swietlicki26, Gloria Titos2, Thomas Tuch31,
Peter Tunved32, Vidmantas Ulevicius14, Aditya Vaishya28,33, Milan Vana22,23, Aki Virkkula6, Stergios Vratolis15, Ernest Weingartner8,b, Alfred Wiedensohler31, and Paolo Laj6,9,19
1Institute of Environmental Assessment and Water Research, c/Jordi-Girona 18–26, 08034, Barcelona, Spain
2Andalusian Institute for Earth System Research, IISTA-CEAMA, University of Granada, Granada 18006, Spain
3Atmospheric Physics Laboratory, ALP, UMSA, Campus Cota Cota calle 27, Endifico FCPN piso 3, La Paz, Bolivia
4Institute for Nuclear Research and Nuclear Energy by the Bulgarian Academy of Sciences, 72 Tsarigradsko Chaussee Blvd, 1784 Sofia, Bulgaria
5Centro de Investigaciones Energéticas, Medioambientales y Tecnológicas, CIEMAT, Unidad Asociada en Contaminación Atmosférica, CIEMAT-CSIC, Avda. Complutense, 40, 28040 Madrid, Spain
6University of Helsinki, UHEL, Division of Atmospheric Sciences, P.O. Box 64, 00014, Helsinki, Finland
7Finnish Meteorological Institute, FMI, Erik Palmenin aukio 1, 00560, Helsinki, Finland
8Paul Scherrer Institut, PSI, Laboratory of Atmospheric Chemistry (LAC), OFLB„ 5232, Villigen PSI, Switzerland
9Institute of Atmospheric Sciences and Climate, ISAC, Via P. Gobetti 101, 40129, Bologna, Italy
10Federal Office of Meteorology and Climatology, MeteoSwiss, Chemin de l’aérologie, 1530 Payerne, Switzerland
11ANDRA – DRD – Observation Surveillance, Observatoire Pérenne de l’Environnement, Bure, France
12LSCE-Orme point courrier 129 CEA-Orme des Merisiers, 91191 Gif-sur-Yvette, France
13ADDAIR, BP 70207 – 189, rue Audemars, 78530, Buc, France
14SRI Center for Physical Sciences and Technology, CPST, Sauletekio ave. 3, 10257, Vilnius, Lithuania
15Institute of Nuclear & Radiological Science & Technology, Energy & Safety, N.C.S.R. “Demokritos”, Athens, 15341, Greece
16Institut National de l’Environnement Industriel et des Risques, Verneuil en Halatte, 60550, France
17Norwegian Institute for Air Research, Atmosphere and Climate Department, NILU, Instituttveien 18, 2007, Kjeller, Norway
18Deutscher Wetterdienst, Met. Obs. Hohenpeissenberg, 82383 Hohenpeissenberg, Germany
19University Grenoble-Alpes, CNRS, IRD, INPG, IGE 38000 Grenoble, France
20TNO B&O, Princetonlaan 6, 3584TA, The Hague, the Netherlands
21MTA-PE Air Chemistry Research Group, Veszprém, P.O. Box 158, 8201, Hungary
22Global Change Research Institute AS CR, Belidla 4a, 603 00, Brno, Czech Republic
23Czech Hydrometeorological Institute, Na Sabatce 17, 143 06, Prague, Czech Republic
24Environmental Chemical Processes Laboratory, Department of Chemistry, University of Crete, Heraklion, 71003, Greece
25Institute for Environmental Research & Sustainable Development, National Observatory of Athens (NOA), I. Metaxa &
Vas. Pavlou, 15236 Palea Penteli, Greece
26Lund University, Department of Physics, P.O. Box 118, 22100, Lund, Sweden
27CNRS-LaMP Université Blaise Pascal 4, Avenue Blaise Pascal, 63178 Aubiere CEDEX, France
28School of Physics and Centre for Climate & Air Pollution Studies, Ryan Institute, National University of Ireland Galway, University Road, Galway, Ireland
29EC Joint Research Centre, EC-JRC-IES, Institute for Environment and Sustainability, Via Enrico Fermi 2749, 21027, Ispra, Italy
30Agencia Estatal de Meteorologia, AEMET, Izaña Atmospheric Research Center, La Marina 20, 38071, Santa Cruz de Tenerife, Spain
31Leibniz Institute for Tropospheric Research (TROPOS), Permoserstraße 15, 04318, Leipzig, Germany
32Department of Environmental Science and Analytical Chemistry (ACES) and the Bolin Centre for Climate Research, Stockholm University, 106 91 Stockholm, Sweden
33Space Physics Laboratory, Vikram Sarabhai Space Centre, ISRO, Thiruvananthapuram – 695022, India
anow at: EEWRC, The Cyprus Institute, Nicosia, Cyprus
bnow at: Institute for Aerosol and Sensor Technology, University of Applied Sciences (FHNW), Windisch, Switzerland Correspondence:Marco Pandolfi (marco.pandolfi@idaea.csic.es)
Received: 5 September 2017 – Discussion started: 13 October 2017 Revised: 7 May 2018 – Accepted: 8 May 2018 – Published: 5 June 2018
Abstract. This paper presents the light-scattering proper- ties of atmospheric aerosol particles measured over the past decade at 28 ACTRIS observatories, which are lo- cated mainly in Europe. The data include particle light scattering (σsp) and hemispheric backscattering (σbsp) co- efficients, scattering Ångström exponent (SAE), backscatter fraction (BF) and asymmetry parameter (g). An increasing gradient of σsp is observed when moving from remote en- vironments (arctic/mountain) to regional and to urban envi- ronments. At a regional level in Europe, σsp also increases when moving from Nordic and Baltic countries and from western Europe to central/eastern Europe, whereas no clear spatial gradient is observed for other station environments.
The SAE does not show a clear gradient as a function of the placement of the station. However, a west-to-east-increasing gradient is observed for both regional and mountain place- ments, suggesting a lower fraction of fine-mode particle in western/south-western Europe compared to central and east- ern Europe, where the fine-mode particles dominate the scat- tering. The g does not show any clear gradient by station placement or geographical location reflecting the complex relationship of this parameter with the physical properties of the aerosol particles. Both the station placement and the ge- ographical location are important factors affecting the intra- annual variability. At mountain sites, higherσspand SAE val- ues are measured in the summer due to the enhanced bound- ary layer influence and/or new particle-formation episodes.
Conversely, the lower horizontal and vertical dispersion dur- ing winter leads to higherσspvalues at all low-altitude sites in central and eastern Europe compared to summer. These sites also show SAE maxima in the summer (with corre- sponding g minima). At all sites, both SAE and g show a strong variation with aerosol particle loading. The lowest values ofgare always observed together with lowσspvalues, indicating a larger contribution from particles in the smaller
accumulation mode. During periods of highσsp values, the variation ofgis less pronounced, whereas the SAE increases or decreases, suggesting changes mostly in the coarse aerosol particle mode rather than in the fine mode. Statistically sig- nificant decreasing trends ofσspare observed at 5 out of the 13 stations included in the trend analyses. The total reduc- tions ofσspare consistent with those reported for PM2.5and PM10 mass concentrations over similar periods across Eu- rope.
1 Introduction
Atmospheric aerosol particles are recognized as an important atmospheric constituent that has demonstrated effects on cli- mate and health. The radiative forcing of aerosol particles, estimated as−0.9 [−1.9 to−0.1] W m−2(IPCC, 2014), has two competing components: a cooling effect from most parti- cle types and a partially offsetting warming contribution from black carbon (BC) particle light absorption of solar radiation.
The aerosol cooling is the dominant effect; thus aerosol par- ticles counteract a substantial portion of the warming effect from well-mixed greenhouse gases (GHGs). This process is driven by the scattering properties of most aerosol particle types (e.g. secondary sulfate and nitrate particles, mineral and organic matter), which reduce the amount of solar radi- ation reaching the Earth’s surface, instead reflecting it back into space and thus modifying the Earth’s radiative balance.
However, the high temporal and spatial variability in at- mospheric aerosol particles due to the wide variety of aerosol sources and sinks, together with their short and variable life- times (hours to weeks in the planetary boundary layer) and spatial non-uniformity, constitute the largest uncertainties in the estimation of the total radiative forcing. Reducing these uncertainties is mandatory in view of the warming the planet
has experienced over the past 50 years. In fact, there is evi- dence suggesting that the observed (and projected) decrease in emissions of anthropogenic aerosol particles in response to air quality policies will eventually exert a positive aerosol effective radiative forcing at the top of the atmosphere (Rot- stayn et al., 2013). Thus, current emission controls could both enhance climate warming while improving air quality (e.g. Stohl et al., 2015).
The measurements of aerosol particle optical properties, such as light scattering and absorption, together with mea- surements of their physical and chemical properties, are fun- damental for understanding the current trade-off between the impacts of aerosols on environmental health and the Earth’s climate. In recent decades, several international projects have provided important information on atmospheric particle properties worldwide. Near-surface in situ observations of aerosol particle properties are being made worldwide under the GAW/WMO (Global Atmosphere Watch; http://www.
wmo.int/pages/prog/arep/gaw/gaw_home_en.html, last ac- cess: August 2017) programme and are complemented with policy-oriented programmes such as IMPROVE (Interagency Monitoring of Protected Visual Environments; http://vista.
cira.colostate.edu/Improve/, last access: August 2017) in the United States and EMEP (European Monitoring and Eval- uation Programme; http://www.emep.int/, last access: Au- gust 2017) in Europe. Additional information specifically tar- geting advanced aerosol particle properties has been obtained in Europe using information from the European research in- frastructure ACTRIS (Aerosols, Clouds, and Trace gases Re- search InfraStructure; http://www.actris.eu, last access: Au- gust 2017) and from short-term RTD (Research and Tech- nological Development) projects such as EUCAARI (Eu- ropean Integrated Project on Aerosol Cloud Climate and Air Quality Interactions; http://www.cas.manchester.ac.uk/
resprojects/eucaari/, last access: August 2017).
The implementation of the GAW programme in Europe is performed under ACTRIS in regard to the advanced ob- servation of aerosol particle properties. ACTRIS provides harmonized measurements of different (physical, chemical and optical) aerosol properties in a systematic way at ma- jor observation sites across Europe. More than 60 measur- ing sites worldwide are currently providing ground-based in situ aerosol particle light-scattering measurements (EBAS database; http://ebas.nilu.no/, last access: August 2017) and this number has increased substantially in the last decade.
However, EBAS also includes data from the IMPROVE net- work nephelometers, which latter are operated at ambient conditions with no size cut, and as a result these IMPROVE data are not directly comparable to the ACTRIS data set dis- cussed in this investigation.
The objective of this work is to integrate the total aerosol light-scattering coefficient (σsp) and hemispheric backscat- tering coefficient (σbsp) measurements taken over several years at the ground-based in situ ACTRIS stations. A total of 28 stations (26 European+2 non-European) are included
in order to document the variability in near-surface aerosol particle light scattering across the ACTRIS network. More- over, at some of the ACTRIS stations more than 10 years of σspdata are available, allowing us to perform trend analyses.
The study of the trend ofσsp is important given that a de- creasing or increasing trend ofσspover time would be indica- tive of the effectiveness of the air quality control measures.
In fact, many studies have shown that the concentrations of particulate matter (PM) and other air pollutants such as sul- fur dioxide (SO2) and carbon monoxide (CO) have clearly decreased over the last 20 years in many European countries (Barmpadimos et al., 2012; Cusack et al., 2012; EEA, 2013;
Querol et al., 2014; Guerreiro et al., 2014; Pandolfi et al., 2016; Tørseth et al., 2012, among others).
Previous studies presenting multi-site ground-based in situ aerosol particle optical measurements were, for example, taken by Delene and Ogren (2002), Sherman et al. (2015), Collaud Coen et al. (2013) and Andrews et al. (2011).
Delene and Ogren (2002) and Sherman et al. (2015) re- ported on the variability in aerosol particle optical proper- ties at four North American surface monitoring sites. Collaud Coen et al. (2013) presented long-term (>8–9 years) aerosol particle light-scattering and absorption measurements taken at 24 regional/remote observatories located mostly in the United States (although 5 are located in Europe). Andrews et al. (2011) reported aerosol particle optical measurements taken at 12 mountaintop observatories (4 of which are located in Europe, 5 in the United States and Canada and 3 in Asia).
Our work is focused mainly on European observatories and aims to present a representative phenomenology of aerosol particle light-scattering coefficients measurements at ACTRIS stations. Thanks to the establishment of European monitoring networks and/or research projects, five papers re- lating to aerosol phenomenology have been published in Eu- rope: Van Dingenen et al. (2004) and Putaud et al. (2004) re- spectively studied the physical and chemical characteristics of PM at the kerbside, urban, rural and background sites in Europe; Putaud et al. (2010) studied the physical and chemi- cal characteristics of PM measured at 60 sites across Europe;
Cavalli et al. (2016) studied the harmonized concentrations of carbonaceous aerosols at 10 regional background sites in Europe; and Zanatta et al. (2016) presented a climatology of BC optical properties at nine European regional background sites. The importance of these studies and of the present work rests on the premise that a reliable assessment of the physi- cal, chemical and optical properties of aerosol particles at a European scale is of crucial importance for an accurate esti- mation of the radiative forcing of atmospheric aerosols. This work is the first European phenomenology study dedicated to the light-scattering properties of aerosol particles measured in situ at near-surface ground-based observatories. Moreover, the trend analyses presented can be used to evaluate how the European mitigation strategies adopted to improve air quality have impacted aerosol particle optical properties.
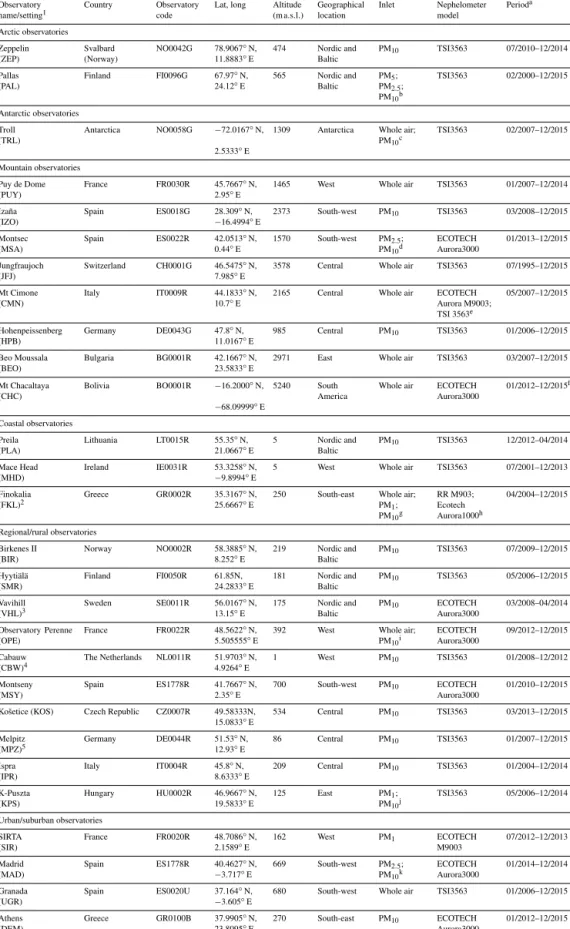
Table 1.List of ACTRIS observatories providing aerosol particle-scattering measurements.
Observatory name/setting1
Country Observatory code
Lat, long Altitude (m a.s.l.)
Geographical location
Inlet Nephelometer model
Perioda
Arctic observatories Zeppelin (ZEP)
Svalbard (Norway)
NO0042G 78.9067◦N, 11.8883◦E
474 Nordic and Baltic
PM10 TSI3563 07/2010–12/2014
Pallas (PAL)
Finland FI0096G 67.97◦N, 24.12◦E
565 Nordic and Baltic
PM5; PM2.5; PM10b
TSI3563 02/2000–12/2015
Antarctic observatories Troll
(TRL)
Antarctica NO0058G −72.0167◦N, 2.5333◦E
1309 Antarctica Whole air;
PM10c TSI3563 02/2007–12/2015
Mountain observatories Puy de Dome (PUY)
France FR0030R 45.7667◦N, 2.95◦E
1465 West Whole air TSI3563 01/2007–12/2014
Izaña (IZO)
Spain ES0018G 28.309◦N,
−16.4994◦E
2373 South-west PM10 TSI3563 03/2008–12/2015
Montsec (MSA)
Spain ES0022R 42.0513◦N,
0.44◦E
1570 South-west PM2.5;
PM10d ECOTECH Aurora3000
01/2013–12/2015
Jungfraujoch (JFJ)
Switzerland CH0001G 46.5475◦N, 7.985◦E
3578 Central Whole air TSI3563 07/1995–12/2015
Mt Cimone (CMN)
Italy IT0009R 44.1833◦N,
10.7◦E
2165 Central Whole air ECOTECH
Aurora M9003;
TSI 3563e
05/2007–12/2015
Hohenpeissenberg (HPB)
Germany DE0043G 47.8◦N, 11.0167◦E
985 Central PM10 TSI3563 01/2006–12/2015
Beo Moussala (BEO)
Bulgaria BG0001R 42.1667◦N, 23.5833◦E
2971 East Whole air TSI3563 03/2007–12/2015
Mt Chacaltaya (CHC)
Bolivia BO0001R −16.2000◦N,
−68.09999◦E
5240 South America
Whole air ECOTECH Aurora3000
01/2012–12/2015f
Coastal observatories Preila
(PLA)
Lithuania LT0015R 55.35◦N, 21.0667◦E
5 Nordic and
Baltic
PM10 TSI3563 12/2012–04/2014
Mace Head (MHD)
Ireland IE0031R 53.3258◦N,
−9.8994◦E
5 West Whole air TSI3563 07/2001–12/2013
Finokalia (FKL)2
Greece GR0002R 35.3167◦N, 25.6667◦E
250 South-east Whole air;
PM1; PM10g
RR M903;
Ecotech Aurora1000h
04/2004–12/2015
Regional/rural observatories Birkenes II
(BIR)
Norway NO0002R 58.3885◦N, 8.252◦E
219 Nordic and Baltic
PM10 TSI3563 07/2009–12/2015
Hyytiälä (SMR)
Finland FI0050R 61.85N,
24.2833◦E
181 Nordic and Baltic
PM10 TSI3563 05/2006–12/2015
Vavihill (VHL)3
Sweden SE0011R 56.0167◦N, 13.15◦E
175 Nordic and Baltic
PM10 ECOTECH
Aurora3000
03/2008–04/2014
Observatory Perenne (OPE)
France FR0022R 48.5622◦N, 5.505555◦E
392 West Whole air;
PM10i
ECOTECH Aurora3000
09/2012–12/2015
Cabauw (CBW)4
The Netherlands NL0011R 51.9703◦N, 4.9264◦E
1 West PM10 TSI3563 01/2008–12/2012
Montseny (MSY)
Spain ES1778R 41.7667◦N,
2.35◦E
700 South-west PM10 ECOTECH
Aurora3000
01/2010–12/2015
Košetice (KOS) Czech Republic CZ0007R 49.58333N, 15.0833◦E
534 Central PM10 TSI3563 03/2013–12/2015
Melpitz (MPZ)5
Germany DE0044R 51.53◦N, 12.93◦E
86 Central PM10 TSI3563 01/2007–12/2015
Ispra (IPR)
Italy IT0004R 45.8◦N,
8.6333◦E
209 Central PM10 TSI3563 01/2004–12/2014
K-Puszta (KPS)
Hungary HU0002R 46.9667◦N, 19.5833◦E
125 East PM1;
PM10j TSI3563 05/2006–12/2014 Urban/suburban observatories
SIRTA (SIR)
France FR0020R 48.7086◦N, 2.1589◦E
162 West PM1 ECOTECH
M9003
07/2012–12/2013
Madrid (MAD)
Spain ES1778R 40.4627◦N,
−3.717◦E
669 South-west PM2.5;
PM10k ECOTECH Aurora3000
01/2014–12/2014
Granada (UGR)
Spain ES0020U 37.164◦N,
−3.605◦E
680 South-west Whole air TSI3563 01/2006–12/2015
Athens (DEM)
Greece GR0100B 37.9905◦N, 23.8095◦E
270 South-east PM10 ECOTECH
Aurora3000
01/2012–12/2015
1Observatory codes from EBAS;2GAW code: FIK;3GAW code: VAV;4GAW code: CES;5GAW code: MEL;astart-end of measurements; total aerosol particle scattering was used as reference for measurement period;bPM5(2000–08/2005), PM2.5(08/2005–2007) and PM10(2008–2015);cwhole air (2007–2009) and PM10(2010–2015);dPM2.5 (2013–03/2014) and PM10(04/2014–2015);eECOTECH Aurora M9003 during 2007–2013 and TSI 3563 (2014–2015);fonly measurements taken during the year 2012 were used in this investigation;gwhole air (2004–2008), PM10(2009–2011), PM1(2011–2012), PM10(2013–2015);hRR M903 during 2004–2011, Ecotech AURORA1000 during
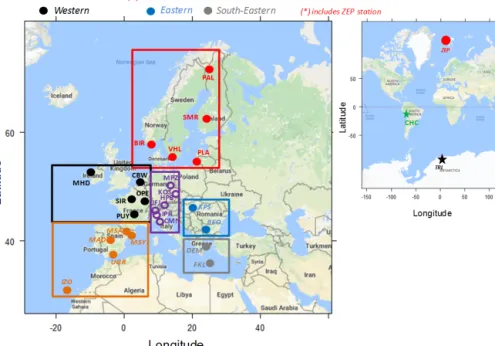
Figure 1.Locations of the 28 ACTRIS stations included in this work.
2 Experiment
2.1 Atmospheric observatories
Figure 1 shows the location of the observatories which are grouped according to their geographical locations, a group- ing employed in other European phenomenology studies (e.g. Putaud et al., 2010). Observatory information (coun- try, code, coordinates, altitude, geographical location, among others) and measurement periods are summarized in Ta- ble 1. The observatories are also divided into five different categories depending on their placement within each geo- graphical sector. The Arctic includes stations located in the Arctic/sub-Arctic region; mountains include those observa- tories located at more than 985 m a.s.l.(the lowest altitude among the mountain observatories included here); coastal re- gions include observatories located close to the coast (<1–
4 km); regional/rural areas include those observatories that are representative of large regional areas; and urban/suburban areas include observatories located in the background of an urban or suburban area. Two non-European stations are also included: one Antarctic site and one mountain site in Bolivia.
Given that this work mainly focuses on European ACTRIS observatories, the results from these two non-European sta- tions are reported in the Supporting Information.
The altitudes of the mountain stations considered here range between 985 m at HPB and 5240 m at CHC (see Ta- ble 1). Some of the mountain stations included in this inves- tigation have already been included in the work of Andrews et al. (2011), namely IZO, JFJ, CMN and BEO. Moreover, the FKL, HPB, JFJ, MHD and PAL stations have been in-
cluded in the study by Collaud Coen et al. (2013). Both stud- ies presented in situ aerosol particle optical measurements taken at these stations. The main results of these previous investigations are summarized in the Results section.
2.2 Scattering measurements 2.2.1 Instruments
The measurements ofσspandσbspincluded in this study were obtained from TSI and Ecotech integrating nephelometers (Table 1). These optical instruments measure the amount of light scattered by particles in the visible spectrum and pro- videσsp andσbsp coefficients of the sampled aerosols. The most common nephelometers in the ACTRIS programme are the TSI3563 and the Ecotech AURORA3000 nephelometers, both of which provide σsp and σbsp. The model TSI3563 measuresσspandσbspat 450, 550 and 700 nm, whereas the Ecotech AURORA3000 measures at 450, 525 and 635 nm.
Other models used are the M9003 from Ecotech (SIR and CMN) and the RR (Radiance Research) nephelometer model M903 (FKL) measuringσspat 520 and 532 nm respectively.
Due to the non-homogeneity of the angular distribution of the light intensity of model M9003 (see Müller et al., 2009), the light source was changed at SIR in 2013 with the AU- RORA3000 light source and at CMN in 2009 with an opal glass light source. After the change of the light sources, both nephelometers were examined at the World Calibra- tion Center for Aerosol Physics in Leipzig and performed very well (personal communication from Jean Sciare (SIR;
27 July 2017) and Angela Marinoni (CMN; 21 July 2017)).
The detailed description of the main characteristics and the working principle of the integrating nephelometers can be found in Müller et al. (2011) for the Ecotech AURORA3000 and in Anderson and Ogren (1998) for the model TSI 3563.
Recommended quality assurance procedures during an on- site operation, as described in GAW (WMO-GAW report, 2016), help to ensure the quality and comparability of the data. The nephelometers included in this investigation are regularly calibrated using span gas and are zero adjusted using particle-free air. Additionally, most of the integrat- ing nephelometers employed in ACTRIS have undergone a schedule of performance checks at the World Calibration Center for Aerosol Physics of ACTRIS/GAW.
2.2.2 Data treatment
Data used in this investigation include hourly averaged level 2 aerosol particle-scattering data downloaded from the ACTRIS/EBAS Data Centre web portals (http://actris.nilu.
no; http://ebas.nilu.no; last downloads August 2017). Theσsp and σbsp data reported to EBAS and used in this work are referenced to standardT (273.15◦C) andP (1013 hPa) con- ditions. Data consistency is critical when comparing many years’ worth of data from different stations. In this work, the level 2 scattering data were further reviewed in order to en- sure a high quality of presented data. There are, however, station-to-station differences (e.g. sizecut, RH control, wave- length and data processing), which are addressed below.
Truncation correction
Data from the integrating nephelometers used here are cor- rected for non-ideal illumination of the light source (devi- ation from a Lambertian distribution of light) and for trun- cation of the sensing volumes in the near-forward (around 0–10◦) and near-backward (around 170–180◦) directions (Müller et al., 2009 and Anderson and Ogren, 1998). Cor- rection schemes have been provided by Müller et al. (2009, 2011) for the RR M903 and Ecotech models M9003 and AURORA3000, and by Anderson and Ogren (1998) for the TSI3563. These schemes consist of a simple linear correc- tion based on the scattering Ångström exponent (SAE) de- termined from the raw nephelometer data to take account of the size-distribution-dependent truncation error. It has been demonstrated that these simple correction schemes are accu- rate for a wide range of atmospheric aerosols and that the uncertainties in the corrections are not expected to be larger than 2 % for an aerosol particle population with a single- scattering albedos (SSA) greater than 0.8 (Bond et al., 2009).
The majority of theσspdata in the EBAS database are cor- rected for non-ideal illumination and for truncation by the data providers. Exceptions are the scattering data submitted for KOS, MHD, PLA, CMN, FKL and SIR. Scattering data from KOS, MHD and PLA were corrected in this work us- ing the correction scheme provided by Anderson and Ogren
(1998) (see Table S1 in the Supplement). Theσsp data col- lected at CMN, FKL and SIR are not corrected because the nephelometers deployed at these three stations provide scat- tering only at one wavelength, thus preventing the estima- tion of the SAE. Given that the nephelometer correction fac- tors vary as a function of SAE, the assumption of a con- stant correction factor for the 1-λ scattering data could in- troduce undesired noise. Moreover, at SIR and CMN, theσsp is measured with the single-wavelength Ecotech nephelome- ter model M9003 (until 2013 at CMN). The correction curve from Müller et al. (2009; Fig. 4) provides a correction factor of around 0.97–1.0 for the M9003 for a SAE of around 1.5–2.
Using the TSI3563 scattering measurements taken at CMN during 2014–2015, we estimated a mean SAE of around 2 for CMN (see Table S5 in the Supplement). Thus, given the rather small effect of the correction factor estimated for the Ecotech M9003, scattering data from CMN and SIR were not corrected in this work. At FKL the nephelometer models RR M903 (until 2011) and Ecotech 1000 (from 2012) were used (see Table 1). To the best of our knowledge, no correction scheme has been provided for the Ecotech 1000. Moreover, at FKL, the inlet was changed many times (see Table 1) and the correction factors provided in the literature are a strong function of the size cut-off used. For these reasons, scattering data collected at FKL are not corrected in this investigation.
Relative humidity
The integrating nephelometer measurements within ACTRIS and WMO-GAW should be taken at a low relative humidity (RH<40 %) in order to avoid enhanced scattering due to wa- ter uptake of aerosol particles and in order to make the mea- surements comparable. For the Ecotech integrating neph- elometers, the RH threshold can be set by using a processor- controlled automatic heater inside the instrument. At some mountain sites, where whole air is sampled (see Table 1), the natural temperature difference between the outside and in- side air dries cloud droplets to the aerosol phase when a cloud is present at the station. RH is also controlled by dehumidi- fying the inlet pipe, as reported in GAW report 226, to ensure a sampling RH of less than 40 %. This recommendation is in- tended to ensure that the data are comparable across the net- work, as measurements would otherwise would be a strong function of the highly variable sample RH. Currently, at the majority of ACTRIS observatories, the aerosol particle light- scattering measurements are taken at a RH below 40 %. How- ever, given that at some stations the 40 % RH threshold is sometimes exceeded, in this work we selected a RH thresh- old of 50 % in order to improve the data coverage.
Estimating the aerosol particle light-scattering enhance- ment due to an increase in RH from 40 to 50 % is difficult using the data available here because theσspmeasurements at a RH>40 % are not evenly distributed over the measurement periods, with the majority of the stations registering a RH higher than 40 % during the summer. Moreover, the chemi-
cal composition of atmospheric aerosol particles is an impor- tant factor determining the magnitude of the scattering en- hancement due to water uptake, which can then change from one site to another (e.g. Fierz-Schmidhauser et al., 2010a, b;
Zieger et al., 2014, 2017). However, the scattering enhance- ment due to a change in RH between 40 and 50 % should be small and will not exceed few percent, even for more hy- groscopic particles (e.g. Fierz-Schmidhauser et al., 2010a, b).
Table S2 in the Supplement reports the percentage of hourly σspvalues collected in the range 40 %<RH<50 %, whereas the frequency distributions of the measured RH are shown in Fig. S1 in the Supplement.
Available wavelengths
In this work we present and discuss theσsp, backscatter frac- tion (BF) and asymmetry parameter (g) measurements ob- tained using the green wavelength of the integrating neph- elometers. The available wavelengths ranged from 520 nm (2 stations; CMN and VHL) to 550 nm (18 stations). Other wavelengths used are 525 nm (6 stations) and 532 nm (used at FKL until 2010; see Table 2). An exception is SIR, where onlyσsp values at 450 nm are available. The measurements of σsp reported here are not adjusted to 550 nm, which is generally the most common wavelength (e.g. Andrews et al., 2011) because of the different data availability of σsp and SAE at the measuring stations. As discussed in the follow- ing sections, the SAE is calculated for σspdata higher than 0.8 Mm−1, thus leading to different data coverage forσspand SAE and preventing the adjustment of all measured σsp to 550 nm. Moreover, the SAE is not available at FKL and SIR (or at CMN until 2014), thus preventing any wavelength ad- justment at these stations. Using the mean SAE calculated at stations where σsp is measured at wavelengths in addi- tion to 550 nm (see Tables S4 and S5 in the Supplement), we estimate differences in theσspvalues of less than 6 % af- ter adjusting to 550 nm. At FKL and SIR, where the SAE is not available, and assuming a reasonable SAE range between 1.5 and 1.0, the difference due to the adjustment to 550 nm is 4.9–3.0 % at FKL and 26–18 % at SIR. The higher difference at SIR is due to the fact that measurements at this station are taken at 450 nm. Finally, at CMN, the effect of the adjust- ment ofσspto 550 nm (from 520 nm) using a mean SAE of 2 (calculated using the 3-λnephelometer data from 2014; see Table S5) is below 10 %.
Inlet size cut changes
It should be noted that any comparison of theσspand SAE values among the different stations and the presented trend analyses could be slightly biased by the different particle size cuts upstream of the integrating nephelometers used in this work (see Table 1). Currently, all ACTRIS integrating neph- elometers measure whole air or PM10, with the exception of SIR, where the PM1inlet is used. Whole air is currently
measured at mountain observatories (BEO, CMN, JFJ, PUY, CHC), one coastal observatory (MHD) and one urban obser- vatory (UGR) (see Table 1).
At some stations, the inlet was changed from whole air to PM10 at some point, namely at OPE, FKL and TRL. Given the lower scattering efficiency of aerosol particles larger than 10 µm, no important differences in the aerosol particle opti- cal parameters should be expected between aerosol particles sampled with a whole air and a PM10 cut-off. At the other stations the inlet was changed during the measurement pe- riod from a cut-off lower than 10 µm (1 µm at KPS; 2.5 µm or 5 µm at PAL, MSA and MAD) to PM10. For PAL (where a median SAE of around 1.8 was measured; see Sect. 3.2 and Table S5), Lihavainen et al. (2015a) assumed that the inlet changes (from PM5to PM2.5in 2005 and from PM2.5
to PM10; see Table 1) had only minor effects on scattering because the number concentration of coarse particles is very low at PAL. Similarly, the KPS observatory registers among the highest SAE values observed in the network (median value of around 2; see Sect. 3.2 and Table S5), suggesting an aerosol particle size distribution dominated by fine particles.
Moreover, at KPS, the inlet was changed in April 2008, less than 1.5 years after the measurements commenced, and thus likely also has a minor effect on the trend analyses and clima- tology performed at this site over the period 2006–2014. Two stations (MSA and MAD) changed the inlet from a PM2.5 diameter cut-off to PM10. For these two southern European stations the inlet change may have had an effect on the SAE, especially during Saharan dust outbreaks, which are, how- ever, sporadic events. Finally, the FKL observatory was re- moved from the trend analysis because the inlet was changed from whole air to PM10in 2009, from PM10to PM1in 2011 and again from PM1 to PM10 in 2013 (see Table 1). These events likely had a major effect on the measured particle op- tical properties.
A sensitivity study (not shown) was carried out to assess the effect of the inlet changes on the SAE values measured at the aforementioned stations. We looked at the climatol- ogy of SAE for different inlet sizes and for different time periods (with and without inlet size changes) and we did not observe any obvious change in the climatology as a function of size cut due to interannual variability. Thus, despite the differences in the particle diameter cut-off, the comparison between the different stations seems feasible.
2.2.3 Calculation of aerosol particle intensive optical properties
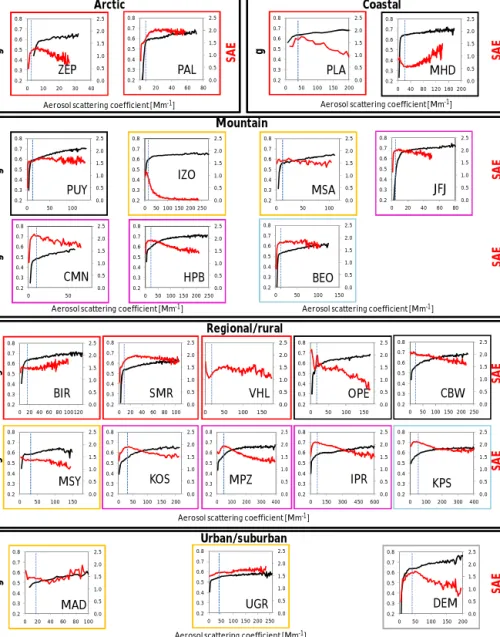
Starting from the spectral σsp measurements taken at the ACTRIS observatories, three intensive aerosol particle op- tical parameters can be estimated, namely the scattering Ångström exponent (SAE), the backscattering fraction (BF) and the asymmetry parameter (g). These intensive proper- ties do not depend on the PM mass concentration and are directly related to aerosol particle properties such as size,
shape, size distribution and chemical composition. The SAE can be considered a proxy for the aerosol particle size range with a higher (lower) SAE associated with predominance of fine (coarse) aerosol particles (e.g. Seinfeld and Pandis, 1998; Esteve et al., 2012; Valenzuela et al., 2015 among oth- ers). The BF andgparameters are calculated quantities that influence the variability in the radiative forcing efficiency and that represent the angular light scattering of aerosol par- ticles. For computational efficiency, the angular light scatter- ing is often represented by a single value (BF,σsp/σbsporg) (Andrews et al., 2006).
The SAE characterizes the wavelength dependency ofσsp
and it can be calculated as follows:
SAE = − log
σspλ1/σspλ2
log(λ1/λ2) . (1)
Here, the SAE is derived from a multispectral log linear fit based on the three nephelometer wavelengths. The SAE depends on the particle size distribution and takes values greater than 2 when the light scattering is dominated by fine particles (radii≤0.5 µm as in Schuster et al., 2006), while it is lower than one when the light scattering is dominated by coarse particles (Seinfeld and Pandis, 1998; Schuster et al., 2006).
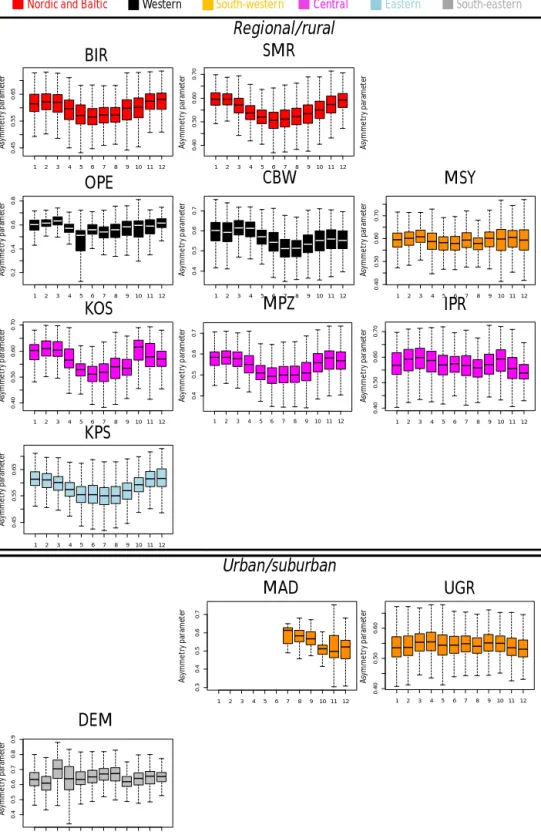
The asymmetry parameter (g) (Andrews et al., 2006; De- lene and Ogren, 2002) describes the probability that the ra- diation is scattered in a given direction and it is defined as the cosine-weighted average of the phase function. Thus, g yields information regarding the amount of radiation that a particle scatters in the forward direction compared to the backward direction. Theoretically, the values ofgcan range from−1 for only back scattering to+1 for complete forward scattering, with a value of 0.7 commonly used in radiative transfer models. Thegparameter can be estimated from the backscatter fraction (BF), which is the ratio ofσbspandσsp
(Andrews et al., 2006):
g= −7.14(BF)3+7.46(BF)2−3.96(BF)+0.9893. (2) 2.2.4 Data coverage
Table S3 in the Supplement reports the percentage (%) of data coverage at the 28 ACTRIS stations included in this study. Removed data include data flagged as non-valid by the data providers (instrument failure, calibration periods, un- specified contamination or local influence, etc.) or obtained at a RH of greater than 50 %. The data coverage for the ex- tensively measured aerosol particle optical properties (σsp andσbsp) is generally high, ranging from around 60 to 95 %.
Exceptions are the σsp measurements at CMN in the blue (450 nm) and red (700 nm) wavelengths, which have much less data coverage compared to the green wavelength be- cause the three-wavelength nephelometer was implemented at CMN in 2014. Consequently, also the SAE and g have
low data coverage at CMN. Moreover, lower data coverage (<40 %) was registered at PLA and VHL.
The data coverage for the intensive aerosol particle opti- cal properties (SAE andg) is generally lower compared to the data coverage ofσsp and σbsp. This is because the in- tensive optical properties are calculated from hourlyσspand σbspdata higher than 0.8 Mm−1to avoid noise in the calcu- lations. As a consequence, the data coverage of the intensive properties is lower at stations measuring low σsp and σbsp values (e.g. mountain and remote sites). For example, at JFJ, the SAE andgdata coverages are around 54 and 22 % re- spectively. At TRL, these values are even lower, at 21 and 1 %. However, as reported in Table S3, at the majority of the stations the data coverage of SAE andgis higher than 60 %.
3 Results and discussion 3.1 Variability ofσsp
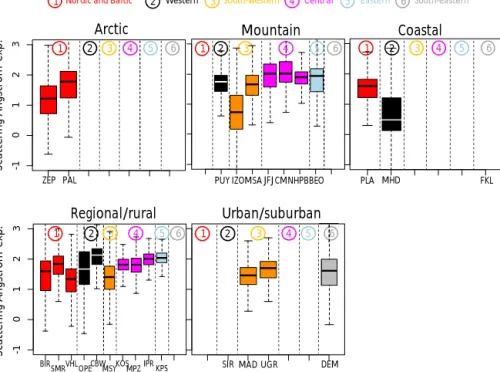
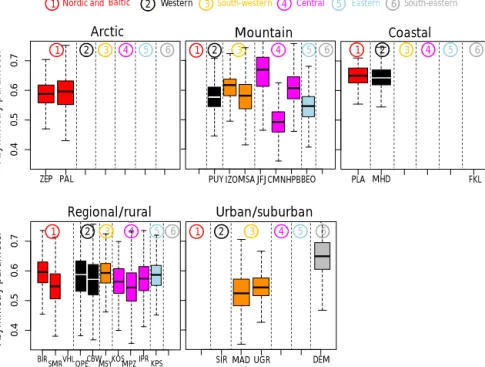
Figure 2 shows the box-and-whisker plots ofσsp measured at the stations included in this investigation. In Fig. 2, the observatories are grouped based on their placement and or- dered according to their geographical location. Table S4 and Fig. S2 in the Supplement respectively report the statistics ofσsp (mean, SD, minimum and maximum values and 5th, 25th, 50th, 75th and 95th percentiles) and frequency and cu- mulative frequency distributions.
In each geographical sector, an increasing gradient ofσsp
is generally observed when moving from mountain to re- gional and to urban sites. Thus, theσsp values measured at mountain sites are lower than the measurements made at other locations (coastal to urban), even if exceptions are ob- served in some sectors.
A large range ofσspcoefficients is observed across the net- work, ranging from median values lower than 10 Mm−1to values higher than 40 Mm−1. Overall, the lowestσspis on av- erage measured at remote stations because of either (a) their altitude (for example, JFJ is located in central Europe at more than 3500 m a.s.l. and CHC in Bolivia is at around 5300 m a.s.l.; see Fig. S3 in the Supplement) or (b) because of their large distance from pollution sources, for example the Arctic ZEP and PAL stations, TRL station (see Fig. S3) and some regional sites in the Nordic and Baltic sector such as BIR and SMR. Higherσsp values (medians>40 Mm−1) are on average registered at more polluted sites, such as some urban sites in southern Europe (UGR and DEM), some re- gional sites in eastern and central Europe (KPS and IPR re- spectively) and one coastal site in the Nordic and Baltic sec- tor (PLA).
The observed variation is consistent with the differences in particulate matter (PM) mass concentrations, PM chemical composition, particle number concentration and absorption coefficients observed across Europe, as described, for exam-
15505001550500
ZEP PAL 1
Nordic and Baltic
2 3 4 5 6
1 2 Western 3 South-western 4 Central 5 Eastern 6 South-eastern
PUY JFJ CMNHPB PLA
Arctic Mountain Coastal
IZOMSA BEO MHD FKL
Regional/rural
BIRSMRVHL OPECBW KOS
MPZIPRKPS MSY
1 2 3 4 5 6 1 2 3 4 5 6
1 2 3 4 5 6 1 2 3 4 5 6
SIR MAD UGR DEM
Total scattering[Mm-1]Total scattering[Mm-1]
Urban/suburban
Figure 2. Total aerosol scattering coefficients in the green divided by station setting. Different colours highlight different geographical locations. At SIR, aerosol scattering was available only at 450 nm. Medians (horizontal lines in the boxes), percentiles 25 and 75 (lower and upper limits of the boxes) and percentiles 5 and 95 (lower and upper limits of the vertical dashed lines) are reported. Hourly data were used for the statistics.
ple, by Putaud et al. (2010), Asmi et al. (2011) and Zanatta et al. (2016).
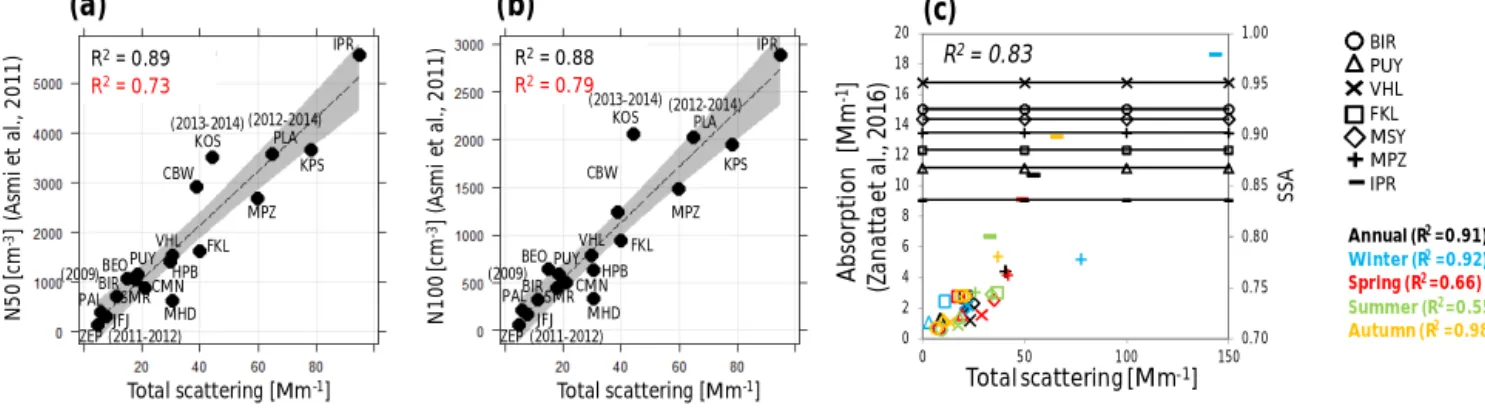
Figure 3a and b show the relationship between the mean particle number concentration measured at different stations from 2008 to 2009 (and reported in Asmi et al., 2011) and the meanσsp measured over the same period (where available).
As reported in Fig. 3, positive correlations are observed be- tweenN50 (Fig. 3a: mean/median particle number between 50 and 500 nm) and N100 (Fig. 3b: mean/median particle number between 100 and 500 nm) and mean σsp. Figure 3c shows the relationship (for some stations) between absorp- tion coefficients reported in Zanatta et al. (2016) and the total scattering. The positive correlations reported in Fig. 3c (es- pecially high for the winter and autumn periods) suggest an increase in both scattering and absorption coefficients with increasing aerosol loading. Figure 3c also reports the mean single-scattering albedo (SSA). On average lower SSA is ob- served at IPR, whereas higher SSA is observed at the Nordic and Baltic VHL and BIR observatories.
Finally, at all stations included in this work, the skewness of theσspdistributions (see Table S4) is higher than one and ranges between 1.4 at PLA and 10.6 at TRL (skewness calcu- lated from hourly averaged data). The skewness can be used to evaluate the asymmetry of a distribution. Positive skew- ness is usually observed for parameters which are defined to be positive and it indicates that the tail on the right side of the distribution is longer or fatter than that on the left side.
Thus, for a right-skewed distribution, the mass of the distri- bution is concentrated on the left, and there is a higher prob- ability of measuring a high value compared to a left-skewed distribution. For example, Querol et al. (2009) used the skew- ness to assess the importance of Saharan dust outbreaks on PM10 levels measured at different sites across the Mediter- ranean basin. They found a positive correlation between the calculated skewness and the net dust contribution to the mea- sured PM10concentration (i.e. the strength of dust pollution episodes; see Fig. 6 in Querol et al., 2009). Figure S2 in the Supporting Material shows the frequency and cumulative fre- quency distributions forσspfor each station, evidencing the presence of these right-skewed tails.
3.1.1 σspat Arctic/Antarctic observatories
The Arctic (ZEP and PAL; see Fig. 2) and Antarctic (TRL; see Fig. S3) monitoring stations are located in undis- turbed environments with minimal influence from the lo- cal settlement because they are located above the inver- sion layer. The mean σsp values measured at ZEP and TRL are by far the lowest across the network, whereas higher σsp values are measured at PAL. PAL is located in a remote continental area characterized by the absence of large local and regional pollution sources (e.g. Aalto- nen et al., 2006). However, Lihavainen et al. (2015a) re- ported that high values of the absorption coefficient and low values of the single-scattering albedo at PAL are re-
0.70 0.75 0.80 0.85 0.90 0.95 1.00
0 2 4 6 8 10 12 14 16 18 20
0 50 100 150
Total scattering [Mm-1] Total scattering [Mm-1] N50 [cm-3] (Asmiet al., 2011) N100 [cm-3] (Asmiet al., 2011)R2= 0.89
R2= 0.73
R2= 0.88 R2= 0.79
ZEP (2011-2012) PAL
JFJ BIR BEO
SMR PUY
CMNHPB MHD VHL
CBW
FKL (2013-2014)
KOS
MPZ (2012-2014)
PLA KPS
IPR
PAL JFJ BIR BEO
SMR PUY
CMNHPB MHD VHL
CBW
FKL MPZ
KPS IPR
ZEP (2011-2012)
(2009) (2009)
(2013-2014) KOS (2012-2014)
PLA
Total scattering [Mm-1] Absorption[Mm] -1 (Zanattaet al., 2016)
Annual (R2=0.91) Winter (R2=0.92) Spring (R2=0.66) Summer (R2=0.55) Autumn (R2=0.98)
R2= 0.83 BIRPUY
VHL FKL MSY MPZ IPR
(a) (b) (c)
SSA
Figure 3.Relationship between(a)N50 (mean particle number concentration between 50 and 500 nm),(b)N100 (mean particle number concentration between 100 and 500 nm),(c)absorption coefficient and mean aerosol particle total scattering coefficient.(a, b)Data averaged over the period 2008–2009. For ZEP, BIR, KOS and PLA aerosol particle-scattering measurements were not available during 2008–2009 and different periods were used.R2values, highlighted in red, were obtained using the median values.(c)Data averaged as in Zanatta et al. (2016). Panel(c)also reports the geometric mean of SSA.
lated to continental air masses from lower latitudes. De- spite this, the mean σsp at PAL is among the lowest in the ACTRIS network and is comparable to the mean σsp ob- served at the JFJ and CHC mountaintop observatories (see Table S4).
3.1.2 σspat mountain observatories
Differences can be observed among stations with similar en- vironments but different geographical locations. For moun- tain observatories, a clear gradient is not observed when moving from western to south-eastern Europe, because the altitude of the station is an important parameter contribut- ing to the σsp measured at these observatories. Among the mountain stations a higher meanσspis on average measured at HPB and IZO (see Table S4). The HPB station is likely to be more influenced by the PBL than other mountain stations due to its lower altitude (Nyeki et al., 2012; Collaud Coen et al., 2017), whereas IZO is largely influenced by Saharan dust outbreaks transporting dust toward the station (e.g. Ro- driguez et al., 2011), thus increasingσsp. In fact, at IZO, the median value ofσsp is among the lowest measured at these mountain sites (around 7 Mm−1; see Table S4), indicating that the sporadic but extremely intense pollution episodes due to Saharan mineral dust outbreaks strongly affect the meanσspat this station.
Despite their placement at higher altitudes, both CMN and BEO (more than 2 km a.s.l.) register similarσspvalues com- pared to PUY and MSA (around 1.5. km a.s.l.), likely be- cause of the effect of important regional pollution sources (i.e. the Po Valley for CMN) on these central and eastern Eu- ropean observatories under favourable meteorological con- ditions (i.e. Marenco et al., 2006). Conversely, the region around the MSA observatory is sparsely populated and the station is isolated from large urban and industrial agglomer- ations (i.e. Pandolfi et al., 2014a; Ripoll et al., 2014; Ealo
et al., 2016). The PUY observatory is surrounded by a pro- tected area with fields and forests, and previous works have shown that the influence of the Clermont-Ferrand city on the PUY measurements remains too small to be detected (i.e.
Asmi et al., 2011).
The lowest medianσsp values at mountain sites are on average measured at JFJ, probably due to the higher alti- tude of this station compared to other mountain stations in- cluded in this work and/or its distance from important pollu- tion sources. Moreover, Collaud Coen et al. (2017) reported a low PBL influence at this site due to the location of the station in a dominant position within the whole mountainous massif. CHC (see Fig. S3) registers higher medianσspvalues compared to JFJ despite its location at around 5300 m a.s.l., likely due to the influence of the emissions from the city of La Paz (3600 m a.s.l.), located around 30 km from the CHC site, and the local topography, which facilitates the uplift of air masses toward the CHC observatory (Collaud Coen et al., 2017).
3.1.3 σspat coastal observatories
The PLA coastal station registered σsp values, which are higher compared to both other Nordic and Baltic stations and other coastal sites (e.g. MHD and FKL) and which are among the highest in Europe. Kecorius et al. (2016) have shown that ship emissions in the Baltic Sea contribute strongly to pollu- tion levels at PLA and that up to 50 % of particles arriving at PLA are generated by processes and emissions, including shipping, taking place in areas upwind of the station. More- over, Asmi et al. (2011) presented a number of similarities in particle number concentrations measured at PLA to those measured at some central European sites, such as IPR, which are due to the influence of multiple source areas (see Fig. 3).
It should be noted, however, that the period with availableσsp measurements is very short at PLA (see Table 1 and Fig. 7)
and the data coverage is also low (see Table S3). Conse- quently, more measurements at this site are needed in order to confirm theσspvalues reported there. The other two coastal stations (MHD and FKL) register median σsp values in the upper range ofσspmeasured across the network, mostly due to the contribution of marine aerosols in winter and mineral dust in summer at MHD and FKL respectively (see Sect. 3.5).
3.1.4 σspat regional/rural observatories
Regional sites exhibit a large variability of σsp coefficients across Europe, with the lowest values measured at BIR and SMR (Nordic and Baltic) and the highest at IPR (central Eu- rope) and KPS (eastern Europe). Thus, a gradient is observed inσspwhen moving from western to eastern Europe. At both IPR and KPS, the frequent wintertime episodes, linked to stable air due to strong thermal inversions, affect the level of pollution at these sites (e.g. Putaud et al., 2014; Mol- nár et al., 2016). It is known that the IPR station, despite lying several tens of kilometres away from large pollution sources, is located in an area (the Po Valley) which is one of the most polluted regions in Europe (e.g. van Donkelaar et al., 2010). The VHL observatory registers on average a higher σsp compared to PAL and compared to the BIR and SMR regional sites, likely because VHL is located closer to the European continent and it is consequently more affected by polluted continental air masses. Moreover, the emissions from the densely populated areas of Helsingborg, Malmö and the city of Copenhagen, located 25 km to the west, 50 km to the south and 45 km to the south-east respectively, could also explain the relatively highσsp measured at VHL (Kecorius et al., 2016). The σsp values at a regional level in western Europe (OPE and CBW) are on average higher compared to those measured in the Nordic and Baltic regions and lower compared to those measured at a regional level in southern Europe (MSY). The relatively higherσspvalues measured at MSY are due to both the contaminated air transported by the sea breeze from the close metropolitan area of Barcelona to the mountains and the frequent Saharan dust outbreaks (i.e.
Pandolfi et al., 2011, 2014b).
3.1.5 σspat urban/suburban observatories
Among the urban background sites, lower σsp values are measured at MAD and SIR compared to DEM and UGR.
The lowσspat MAD during the period presented here (only 2014 data are available for MAD) could be related to the re- duced formation of secondary nitrate aerosols due to the lim- ited availability of ammonia in this urban environment (Re- vuelta et al., 2014). However, it should be noted that win- ter episodes with high secondary nitrate concentrations are not uncommon in Madrid and we are presenting here only 1 year of measurements for this station. On the other hand, secondary inorganic aerosol concentrations recorded at the SIR suburban observatory can be considered representative
of a large geographical zone, given the rather flat orography of the Parisian basin. At UGR, the accumulation, mainly in winter, of fine particles from traffic, domestic heating and the burning of biomass, explains the relatively higherσsp (e.g.
Lyamani et al., 2012; Titos et al., 2017). Traffic emissions, the high level of formation of secondary sulfate and organic aerosols in the summer and the transport of dust from Africa are the main contributory factors to the high σsp at DEM, where high PM2.5 and PM10 values are usually measured and compared to other important Mediterranean cities (e.g.
Diapouli et al., 2017; Eleftheriadis et al., 2014; Karanasiou et al., 2014; Querol et al., 2009).
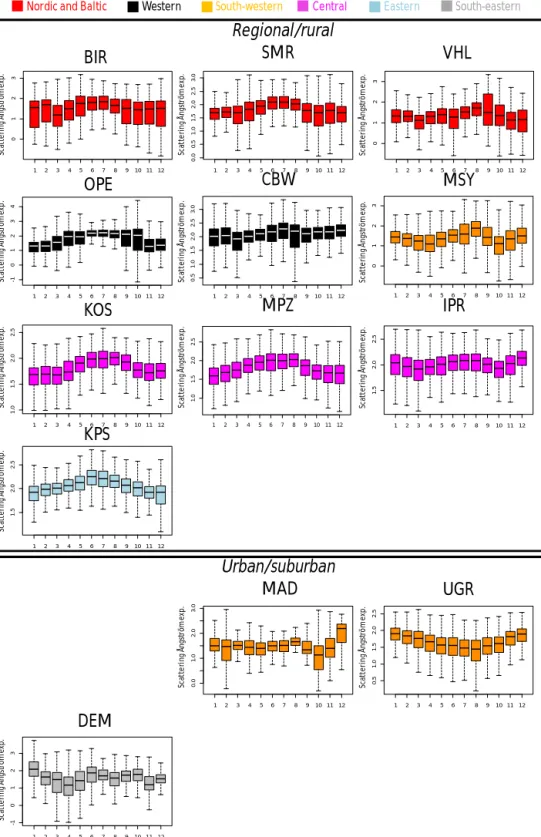
3.2 Variability of SAE
Figure 4 shows the box-and-whisker plots of the SAE cal- culated at the different stations. Table S5 and Fig. S4 in the Supplement report the statistics of the SAE and frequency and cumulative frequency distributions respectively.
3.2.1 Variability of SAE by geographical sector
The SAE shows a large variability across the geographical sectors considered in this study (Fig. 4). On average, in- dependently of the station setting, the highest SAE is ob- served at the central and eastern European observatories (see Table S5) with station-averaged values of 1.88±0.49 and 1.88±0.53. The high SAE values in central and eastern Eu- rope clearly indicate the predominance of fine particles. In fact, high PM2.5/PM10ratios, indicative of the presence of small particles, are typical for rural lowland sites in central Europe (e.g. Spindler et al., 2010; EMEP, 2008). Figure S4 shows that the frequency plots of SAE data have very sim- ilar unimodal delta-like distributions and the variability of the SAE within the 5th to the 95th percentile range is much lower than that of the other European regions, suggesting a greater homogeneity in some microphysical properties of atmospheric particles such as size. Exceptions are the CMN, JFJ and BEO mountain sites, where left-tailed SAE distribu- tions are observed, likely due to the reduced effect of fine particles from the PBL in winter and an increase in the rela- tive importance of coarse mineral dust, sea-salt particles and aged aerosols compared to lower-altitude stations in the same geographical sector.
On average, the SAE is lower for all other geographical sectors. Station-averaged mean SAE of around 1.60±0.61, 1.25±0.86 and 1.36±0.67 are observed in the Nordic and Baltic, western and south-western sectors respectively. Ex- ceptions are, however, observed, for example, at CBW (west- ern Europe) the median SAE reaches values of around 2.1.
Indeed, both polluted air masses from the industrialized zones of the Benelux countries and clean air masses from the sea contribute to the presence of aerosol particles at this site (Crumeyrolle et al., 2010). Moreover, CBW is surrounded by several large cities at distances of approximately 20–40 km