quaternary
Review
Speleothem Records from the Eastern Part of Europe and Turkey—Discussion on Stable Oxygen and
Carbon Isotopes
Zoltán Kern1,* , Attila Demény1, Aurel Per¸soiu2,3 and István Gábor Hatvani1
1 Institute for Geological and Geochemical Research, Research Centre for Astronomy and Earth Sciences, Hungarian Academy of Sciences, H-1112 Budapest, Hungary; demeny.attila@csfk.mta.hu (A.D.);
hatvaniig@gmail.com (I.G.H.)
2 Emil Racovit,ăInstitute of Speleology, Romanian Academy, Clinicilor 5, 400006 Cluj Napoca, Romania;
aurel.persoiu@gmail.com
3 Stable Isotope Laboratory, University of Suceava, Universităt,ii 13, 720229 Suceava, Romania
* Correspondence: kern.zoltan@gmail.com; Tel.:+36-70-253-8188
Received: 30 November 2018; Accepted: 6 September 2019; Published: 18 September 2019
Abstract:The region comprising of East Central Europe, South East Europe and Turkey contributed to the SISAL (Speleothem Isotopes Synthesis and AnaLysis) global database with stable carbon and oxygen isotope time-series from 18 speleothems from 14 caves. The currently available oldest record from the studied region is the ABA-2 flowstone record (Abaliget Cave; Hungary) reaching back to MIS 6. The temporal distribution of the compiled 18 records from the region points out a
~20 kyr-long period, centering around 100 ka BP, lacking speleothem stable isotope data. The regional subset of SISAL_v1 records displays a continuous coverage for the past ~90 kyr for bothδ13C and δ18O, with a mean temporal resolution of ~12 yr for the Holocene, and>50 yr for the pre-Holocene period. The highest temporal resolution both for the Holocene and the pre-Holocene was achieved in the So-1 record (Sofular Cave; Turkey). The relationship between modern day precipitationδ18O (amount weighted annual and winter season mean values; 1961–2017) and climatological parameters was evaluated. The strong positive correlation found in East Central Europe reinforces the link between modern day precipitationδ18O, temperature and large-scale circulation (North Atlantic Oscillation) expected to be preserved in the speleothemδ18O record; while a negative relationship was documented between precipitation amount and oxygen isotope compositions in South East Europe. Variations ofδ13C values are primarily interpreted as reflecting dry/wet periods across the region. Elevation gradients from three non-overlapping periods of the last ~5 kyr indicated elevation gradients around−0.26%per 100 m−1for calciteδ18O.
Keywords: speleothems; carbon and oxygen stable isotopes; paleohydroclimate
1. Introduction
Southeastern Europe is the cradle of karst research [1–3]. The Kras Plateau in Slovenia gave its name to the entire discipline, and the very first karst research [4] and speleological [5] institutes were established in this region. Extended karstic terrains are found in various climatic zones, across the studied region, ranging from the extreme humid coastal areas of the Dinaric Karst (annual precipitation
>4000 mm) to arid central Anatolia (annual precipitation<300 mm). Turkey and the southeastern part of Europe have a very diverse karst landscape, and a wide range of geochronological and geochemical investigations targeted the cave deposits in this region to infer information on past environments.
Quaternary2019,2, 31; doi:10.3390/quat2030031 www.mdpi.com/journal/quaternary
Quaternary2019,2, 31 2 of 26
Radiometric dating of submerged speleothems from the Dalmatian coast helped constrain periods of sea-level low- [6–8] and high-stands [9] during the Quaternary. Trace element variability in speleothems from the region provided a basis for paleohydroclimate implications [10–12], and supported the identification of historical flood events [13]. The Middle Bronze Age Minoan eruption of Santorini was associated with a sudden rise in rare earth elements in the Trióflowstone record [14] and the geochemical imprint (e.g., peaks in Br, Mo, S) in the So-1 record from Sofular Cave [15]. Changes in U concentration andδ234U variability associated with increased detrital material (e.g., Al, Si, Th) in the younger part of the Trióflowstone were used to detect pollution from historical mining activity [16].
Stable isotope investigations of calcareous speleothems began relatively late in this region, at the very end of the 20th century [17,18]. The first studies aimed to infer changes in paleoenvironmental conditions based on stable isotope composition of Late Pleistocene speleothems were carried out in Wierna Cave, southern Poland [17]. Nevertheless, this aim was first achieved in Lithophagus Cave, Romania [19].
Paleoclimatic interpretations of stable carbon- and oxygen isotope compositions of speleothem carbonate (δ13Cspelandδ18Ospel) require knowledge and quantitative estimation of the processes that affect the stable isotopic compositions of oxygen and carbon during the hydrologic cycle and calcite precipitation. We refer the reader to the introductory paper of this Special Issue [20] for an overview of these controlling mechanisms. In addition toδ13Cspelandδ18Ospel(the most frequently investigated and most abundant geochemical parameters in speleothems studies in the region), stable isotope ratios in certain non-calcareous cave deposits, such as cave ice [21] and guano deposits [22–24] have also been explored for their paleoclimatological potential.
Microscopic droplets from dripping water are enclosed in the precipitating carbonate during the speleothem formation in the form of fluid inclusions. Since H and O isotope compositions of the water are not fractionated during entrapment, initially both are considered to reflect the composition of dripwater directly [25,26]. However post-deposition recrystallization and calcite-water isotope exchange have been proved to compromise fluid inclusionδ18O [27], leaving hydrogen isotope composition to be the reliable paleoclimate proxy. Although it has been long recognized that stable isotope analysis of inclusion-hosted water has a great potential in speleothem-based paleoclimate reconstructions [28], the relatively large sample amount required for classical dual inlet mass spectrometry and the sophisticated technique for O isotope measurement precluded wide application of combined of H and O isotope analyses of inclusion-hosted water (further details in Demény et al. [28]). Fluid inclusion stable isotope data are also available in the region provided excess information for paleoclimatological studies; see Section6.
This paper uses the first global compilation of speleothem isotope records (SISAL_v1 database [29,30]) produced by the Speleothem Isotopes Synthesis and Analysis PAGES working group to describe and evaluate the spatiotemporal coverage of the speleothem derived stable isotope records for the last 160,000 yrs from the Eastern part of Europe and Turkey. We highlight areas and periods that are lacking data and how this could be mitigated. Special attention is given to the Holocene, for which we evaluate the availableδ18Ospelrecords and compare them with stable hydrogen isotope compositions (δ2H) of speleothem fluid inclusions in the region. The spatial distribution in the relatively well represented 5-1 ka BP (Before Present, with the present referring to 1950 of the Common Era) period, provided the opportunity to explore the spatial pattern ofδ18Ospeldata.
2. Study Region and Local Climate
The studied region, covering 3.03×10⁶km2, encompasses East Central Europe, South East Europe and Turkey and is hereafter referred to as the Eastern part of Europe and Turkey. The other parts of continental Europe not considered here are included in a companion paper of this Special Issue [31].
Generally, the studied region is characterized by wet continental climate, with increasing continentality eastwards (for details see Supplement Section 1 and Figure S1). Warm temperate/continental climate with warm summers and without a dry season prevails over the elevated terrains of the Balkan Peninsula stretching northward to the Baltic Coast. Areas with hot summers occur in the central part of the Balkan Peninsula and the south-eastern part of the Eastern European Plains (Figure S1). Boreal climate with warm summers without a dry season prevails over large part of the mountainous area (Carpathians, Dinarides, and Thracian Massive) and the northeastern parts of the Eastern European Plains up to the Gulf of Finland. Cool summers and cold winters are restricted to the highest regions of the Carpathian Range (Figure S1) [32]. The southern regions, from the Dalmatian Coast through the Peloponnesus, the plains north and west of the Black Sea and large part of Anatolia are characterized by dry, hot and warm summers. Details on the climate of the region [32] are found in the Supplement.
Warm season cyclones reach the northern part of the studied region originating from the Mediterranean and Black seas, as well as from the North Atlantic, while cold season cyclones originate almost exclusively from the North Atlantic [33]. In fall, frequent Mediterranean cyclones penetrate northeastwards, reaching the Carpathians and beyond. Mediterranean moisture is the dominant source for precipitation in the Balkan Peninsula [34,35]. SE Europe is the only region on the continent where the contribution of Mediterranean sourced moisture exceeds ~20% all year-round [36]. The Black Sea acts as an important moisture source for the surrounding coastal region (as far as the eastern Carpathians [37]) and for northern Turkey [38,39].
The high elevation mountain areas show the largest karstic groundwater recharge volumes (up to 700–800 mm y−1). However, the recharge rates are higher in the Mediterranean region (from ~20% to
~60% of total precipitation with a mean of ~40%) than in the high range mountains (from ~5% to ~65%
of total precipitation). The recharge rate of the humid hills and plains varies between ~5% and ~60%
with a mean of ~30%, being slightly lower than in the Mediterranean medium range mountains and high range mountains [40]. Overall, in the studied region, the maximum recharge rates can be observed in the Dinaric karst and western Anatolia, whereas the eastern Balkan Peninsula and central-east Anatolia has the driest karstic areas [40].
3. “Eastern Europe and Turkey” Records in SISAL_v1
At the time of the publication of this review, 43 speleothem stable isotope records from 29 caves have been identified in the Eastern part of Europe and Turkey, out of which 18 individual records from 14 caves are included in SISAL_v1 database [29,30] (Figure1, Table1).
3.1. Spatial Distribution of Speleothem Records
The Dinaric Karst is represented by only a 54-yr-long modern speleothem record from Postojna Cave [18] and a ca. 1700-yr long one from the Modriˇc Cave [41] in SISAL_v1 (Figure1; Table1), despite the area’s richness in caves. There are three records from two caves located in the Peloponnesus (Mavry Trypa Cave [42]; Kapsia Cave [13]) and another one from the Aegean Thasos Island (Skala Marion Cave [43]). Additional records come from the northern (Sofular Cave [38] and southern margins of Anatolia (Dim Cave [44]). The Carpathian karst regions is relatively better represented with records from Ceremosnja- [45], Ascunsă- [46], and Ur¸silor caves [47] and two records from Baradla Cave [48].
Three other speleothems are from the relatively small karstic area in the southern Transdanubia, the Mecsek Hills, two from the Abaliget- [49] and one from the TrióCave [11,14].
Quaternary2019,2, 31 4 of 26
Quaternary 2018, 2, x FOR PEER REVIEW 4 of 26
Figure 1. Map indicating the location of speleothem records from the Eastern part of Europe and Turkey. Purple circles show records in SISAL_v1 and green triangles note records not yet in the database. Background map show karst aquifers from the World Karst Aquifer Mapping Project [50].
Numbers next to the sites refer to the site names in Table 1.
Spatial coverage of records in the 41–44° N latitudinal belt (Figure 1) could be improved with recently published studies from Macedonia [51], Croatia [52] and Bosnia [53] (Table 1). Recently published records from Demänovska Valley [54], Cloşani [10], Tăuşoare-, and Ascunsă caves [55] are also expected to expand the data coverage for the Carpathian region.
Only a few speleothem stable isotope records from the extended karst regions in the northern part of the studied are have been published (e.g., [17,56]. An explanation for this is that the permafrost conditions prevailed around [57] and beneath [58] the former Fennoscandian Ice Sheet, thereby preventing speleothem growth [17] because there was no water movement in the frozen ground. This hypothesis is indirectly supported by a recent study showing flowstone deposition in the Kraków- Częstochowa Upland at 975–470 ka BP [59]), predating the major glaciations in the region. The thawing of this frozen ground could be a prolonged process after deglaciation [60], maintaining unfavorable conditions for speleothem formation. The current karstwater table is near the surface in the Baltic region, creating phreatic conditions (i.e., completely submerged, or partly flooded) already in near surface cavities and subaerial speleothem formation has not been observed in known karst caves [61]. Speleothems were presumably formed in the Baltic region during the pre-Pleistocene [62], but the former vadose zone was denudated by extensive Pleistocene glaciation [63].
Additional identified records (e.g., from the Romanian Carpathians [64,65] the Low Tatras [66]
or the Pontides [67–69]; Table 1) would help improving the spatiotemporal coverage of the region. A couple of records were not included to the SISAL database yet, either due to difficulties in obtaining data or due to the lack of essential metadata.
Figure 1.Map indicating the location of speleothem records from the Eastern part of Europe and Turkey.
Purple circles show records in SISAL_v1 and green triangles note records not yet in the database.
Background map show karst aquifers from the World Karst Aquifer Mapping Project [50]. Numbers next to the sites refer to the site names in Table1.
Spatial coverage of records in the 41–44◦N latitudinal belt (Figure1) could be improved with recently published studies from Macedonia [51], Croatia [52] and Bosnia [53] (Table1). Recently published records from Demänovska Valley [54], Clo¸sani [10], Tău¸soare-, and Ascunsăcaves [55] are also expected to expand the data coverage for the Carpathian region.
Only a few speleothem stable isotope records from the extended karst regions in the northern part of the studied are have been published (e.g., [17,56]. An explanation for this is that the permafrost conditions prevailed around [57] and beneath [58] the former Fennoscandian Ice Sheet, thereby preventing speleothem growth [17] because there was no water movement in the frozen ground.
This hypothesis is indirectly supported by a recent study showing flowstone deposition in the Kraków-Cz˛estochowa Upland at 975–470 ka BP [59]), predating the major glaciations in the region.
The thawing of this frozen ground could be a prolonged process after deglaciation [60], maintaining unfavorable conditions for speleothem formation. The current karstwater table is near the surface in the Baltic region, creating phreatic conditions (i.e., completely submerged, or partly flooded) already in near surface cavities and subaerial speleothem formation has not been observed in known karst caves [61]. Speleothems were presumably formed in the Baltic region during the pre-Pleistocene [62], but the former vadose zone was denudated by extensive Pleistocene glaciation [63].
Additional identified records (e.g., from the Romanian Carpathians [64,65] the Low Tatras [66]
or the Pontides [67–69]; Table1) would help improving the spatiotemporal coverage of the region.
A couple of records were not included to the SISAL database yet, either due to difficulties in obtaining data or due to the lack of essential metadata.
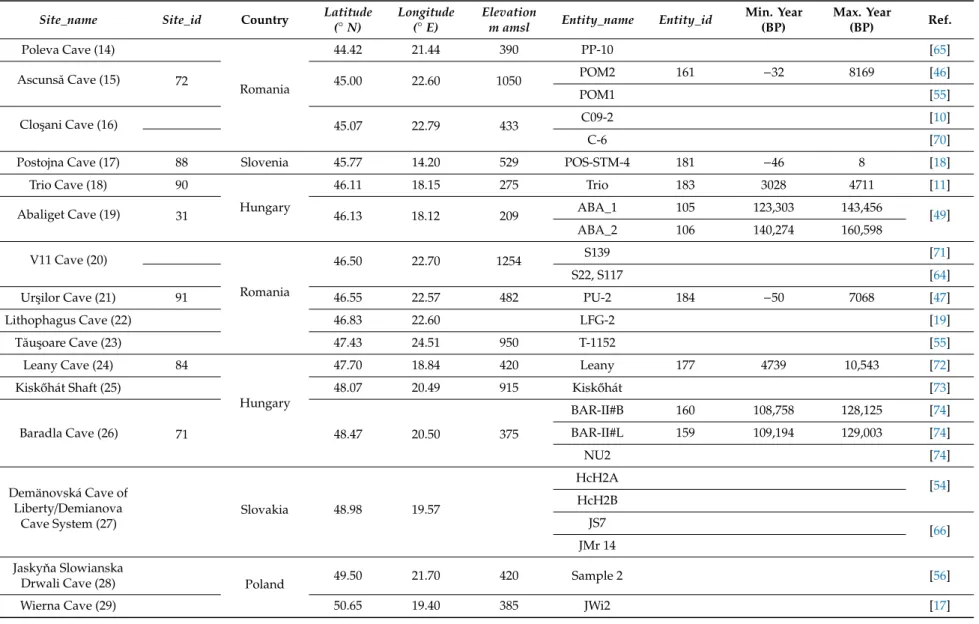
Table 1.Metadata of the speleothem records from the Eastern part of Europe and Turkey. Column headings in italics represent field names that can be queried in the SISAL database. The numbers in parentheses next to the site names identify the site locations in Figure1. Min/Max year correspond to the last/first ages of stable isotope data, respectively. BP is defined as years before present, where present is 1950 CE. Minimum and maximum age of stable isotope records were rounded to integer. Speleothems without an entity_id are not in SISAL_v1 [29,30].
Site_name Site_id Country Latitude
(◦N)
Longitude (◦E)
Elevation
m amsl Entity_name Entity_id Min. Year (BP)
Max. Year
(BP) Ref.
Dim Cave (1) 79 Turkey 36.53 32.11 232
Dim-E2 168 9738 13,094
[44]
Dim-E3 169 12,575 89,714
Dim-E4 170 12,020 14,555
Mavri Trypa Cave (2) 156
Greece 36.74 21.76 70 S1 347 1296 4687 [42]
Kapsia Cave (3) 44 37.62 22.35 700 GK-09-02 120 1115 2904 [13]
Akcakale Cave (4) Turkey 40.45 39.54 2p [67]
Karaca Cave (5) 40.54 39.40 1536 K1 [68]
Skala Marion Cave (6) 56 Greece 40.64 24.51 41 MAR_L 136 1481 5534 [43]
— (7) Macedonia 41.22 20.91 1130 OH2 [51]
Sofular Cave (8) 141 Turkey 41.42 31.93 700
So-1 305 −56 50,275 [38]
SO-2 [38]
SO-17 [69]
Mala Splilja Cave (9)
Croatia 42.76 17.48 60 MSM-1 [52]
Velika Spilja Cave (10) 42.77 17.47 90 VSM-1 [52]
Mraˇcna Cave (11) Bosnia and
Herzegovina 43.77 18.89 597 BS14, BS15 [53]
Modriˇc Cave (12) 86 Croatia 44.26 15.54 32 MOD-22 179 −58 1637 [41]
Ceremosnja Cave (13) 76 Serbia 44.40 21.65 530 CC-1 165 −48 2426 [45]
Quaternary2019,2, 31 6 of 26
Table 1.Cont.
Site_name Site_id Country Latitude
(◦N)
Longitude (◦E)
Elevation
m amsl Entity_name Entity_id Min. Year (BP)
Max. Year
(BP) Ref.
Poleva Cave (14)
Romania
44.42 21.44 390 PP-10 [65]
AscunsăCave (15) 72 45.00 22.60 1050 POM2 161 −32 8169 [46]
POM1 [55]
Clo¸sani Cave (16) 45.07 22.79 433 C09-2 [10]
C-6 [70]
Postojna Cave (17) 88 Slovenia 45.77 14.20 529 POS-STM-4 181 −46 8 [18]
Trio Cave (18) 90
Hungary
46.11 18.15 275 Trio 183 3028 4711 [11]
Abaliget Cave (19) 31 46.13 18.12 209 ABA_1 105 123,303 143,456
[49]
ABA_2 106 140,274 160,598
V11 Cave (20)
Romania
46.50 22.70 1254 S139 [71]
S22, S117 [64]
Ur¸silor Cave (21) 91 46.55 22.57 482 PU-2 184 −50 7068 [47]
Lithophagus Cave (22) 46.83 22.60 LFG-2 [19]
Tău¸soare Cave (23) 47.43 24.51 950 T-1152 [55]
Leany Cave (24) 84
Hungary
47.70 18.84 420 Leany 177 4739 10,543 [72]
Kisk˝ohát Shaft (25) 48.07 20.49 915 Kisk˝ohát [73]
Baradla Cave (26) 71 48.47 20.50 375
BAR-II#B 160 108,758 128,125 [74]
BAR-II#L 159 109,194 129,003 [74]
NU2 [74]
DemänovskáCave of Liberty/Demianova
Cave System (27)
Slovakia 48.98 19.57
HcH2A
[54]
HcH2B
JS7 [66]
JMr 14 Jasky ˇna Slowianska
Drwali Cave (28) Poland 49.50 21.70 420 Sample 2 [56]
Wierna Cave (29) 50.65 19.40 385 JWi2 [17]
3.2. Temporal Distribution of Speleothem Records
The oldest record in the region is the ABA_2 speleothem, collected from Abaliget Cave (Figure2;
Table1), which spans the period 160.6 to 140.2 ka BP. The period from ~161 to ~109 ka BP is represented by only four records with two overlapping segments. The first overlap occurs between the two Abaliget records from ~143.5 to ~140 ka BP, whereas the second overlap is seen between the Baradla records and the ABA_1 speleothem from 129 to ~123 ka BP. The two Baradla records stopped growing at ~109 ka BP, which is then followed by a ca. 20 kyr-long gap up to ~89.7 ka BP (Figure2). From ~90 ka BP onwards, there is continuous coverage of bothδ18O andδ13C in the region, although the available number of isotopic records for the period 90–10 ka BP is low. The Dim-E3 record spans from ~89.7 to ~12.6 ka BP overlapping with the So-1 record after ~50.3 ka BP (Table1). These two speleothems are the only records from the region until 10.5 ka BP, when the Leany record starts (Figure2). The Holocene is the best represented period in the region (Figures2–4), with the interval from ~2.05 to ~1.42 ka BP being covered by 7 records (PU-2, GK-09-02, MAR_L, POM2, CC-1, So-1 and S1). The speleothems Ur¸silor- and, Mavri Trypa caves’ did not grow between ~3 and ~2.2 ka BP. Their restart in growth falls close to the start of the deposition of CC-1 from cave Ceremosnja at ~2.4 ka BP. The previous observation of no-growth before cca. 2.3 ka in multiple speleothems (Figure4) might indicate a dry period in South East Europe, although the speleothems from caves Skala Marion, Kapsia and Ascunsă indicate otherwise.
The lack of data around 100 ka BP (from ~109 ka BP to ~89.7 ka BP in Figure2) has been pointed out in a previous study [75], although radiometric ages from the Carpathian karstic region have been reported for a couple of speleothems during this period (e.g., [76,77]). Moreover, a recent compilation of radiometric ages from more than 90 speleothems and flowstones from the Croatian karst show an even temporal distribution back to the onset of MIS 5 [7], suggesting a good opportunity to develop speleothem stable isotope records for this period. In addition, there is a good chance to further extend the regional dataset beyond MIS 6, as records predating the ones in SISAL_v1 have already been identified from Turkish [69], Macedonian [51], Croatian [78] and Hungarian [79] localities. Moreover, calcareous cave deposits exceeding the current limit of applicability of U-Th dating method (~600 kyr) and for which U-Pb dating methods [80,81] could be applied, have been found in the region [59].
Quaternary2019,2, 31 8 of 26
Quaternary 2018, 2, x FOR PEER REVIEW 8 of 26
Figure 2. Timeseries of individual speleothem records from the Eastern part of Europe and Turkey for (A) δ18O and (B) δ13C during the last 160 kyrs. Marine Isotope Stages (MIS [82]) are indicated by dashed horizontal arrows. Durations of Heinrich events (e.g., H1 [83]) are shown with black boxes between panels (A,B).
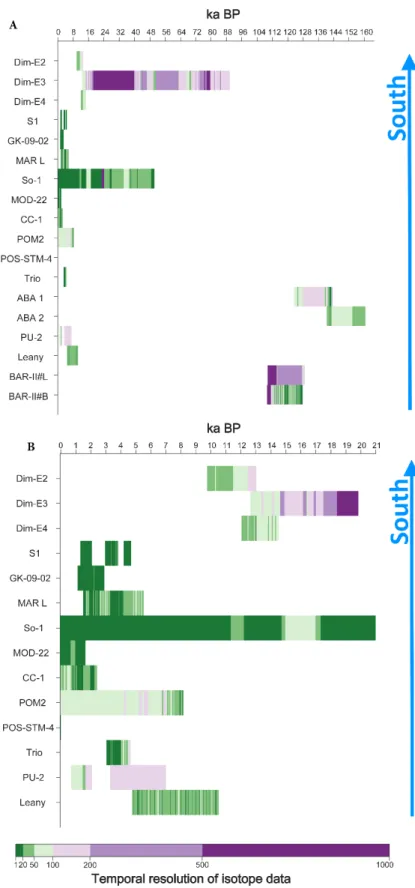
The average length of the records is ~13.8 kyr and the median is 4.9 kyr, including hiatuses. The shortest growth period was 54 yrs (POS-STM-4) and the longest ~77 kyr (Dim-E3). The temporal resolution of the SISAL stable isotope records ranges from sub-decadal (So-1, [38], S1 [42]; Trió, [11]
to >1000 yr (Dim-E3, [44]). The average temporal resolution of the records is ~12 yr for the Holocene, while it is generally >50 yr for the pre-Holocene period (Figure 4). The studies following the pioneering record of PU-2 in 2002 [47] achieved characteristically finer temporal resolution (Figure 4), illustrating that both the sampling [84] and dating methods have highly improved over the past decades [85].
Figure 2. Timeseries of individual speleothem records from the Eastern part of Europe and Turkey for (A)δ18O and (B)δ13C during the last 160 kyrs. Marine Isotope Stages (MIS [82]) are indicated by dashed horizontal arrows. Durations of Heinrich events (e.g., H1 [83]) are shown with black boxes between panels (A,B).
The average length of the records is ~13.8 kyr and the median is 4.9 kyr, including hiatuses.
The shortest growth period was 54 yrs (POS-STM-4) and the longest ~77 kyr (Dim-E3). The temporal resolution of the SISAL stable isotope records ranges from sub-decadal (So-1, [38], S1 [42]; Trió, [11] to
>1000 yr (Dim-E3, [44]). The average temporal resolution of the records is ~12 yr for the Holocene, while it is generally>50 yr for the pre-Holocene period (Figure4). The studies following the pioneering record of PU-2 in 2002 [47] achieved characteristically finer temporal resolution (Figure4), illustrating that both the sampling [84] and dating methods have highly improved over the past decades [85].
Quaternary 2018, 2, x FOR PEER REVIEW 9 of 26
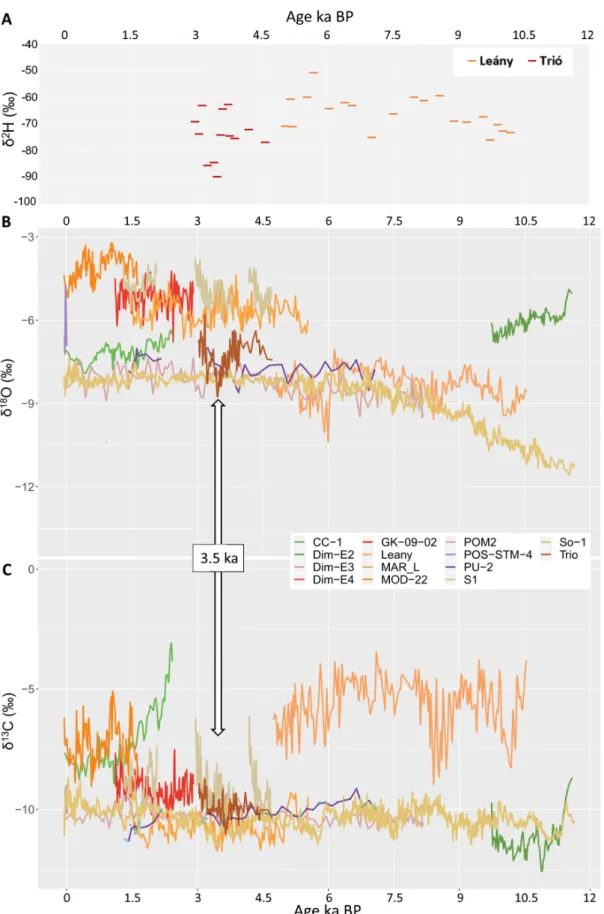
Figure 3. Stable isotope records of individual speleothems in the Eastern part of Europe and Turkey SISAL region for the Holocene: (A) Fluid inclusion δ2H, (B) δ18Ospel and (C) δ13C. The vertical arrow marks 3.5 ka BP.
Figure 3.Stable isotope records of individual speleothems in the Eastern part of Europe and Turkey SISAL region for the Holocene: (A) Fluid inclusionδ2H, (B)δ18Ospeland (C)δ13C. The vertical arrow marks 3.5 ka BP.
Quaternary2019,2, 31 10 of 26
Quaternary 2018, 2, x FOR PEER REVIEW 10 of 26
Figure 4. Temporal coverage of the records included in SISAL_v1 from Eastern part of Europe and Turkey (A) back to 160 ka BP, and (B) back to 21 ka BP. Hiatuses in individual records are shown by blank spaces. Records are sorted by latitude, with the southernmost site at the top.
Figure 4. Temporal coverage of the records included in SISAL_v1 from Eastern part of Europe and Turkey (A) back to 160 ka BP, and (B) back to 21 ka BP. Hiatuses in individual records are shown by blank spaces. Records are sorted by latitude, with the southernmost site at the top.
4. Environmental Controls onδ13C andδ18O Values in the Eastern Part of Europe and Turkey
4.1. Availability of Cave Monitoring Data
Monitoring of climatic variables and stable isotope compositions of dripwater has been performed for at least one season in seven caves out of 14. In comparison to the whole SISAL_v1 database [30], the proportion of the monitored caves in the region is higher, ~38% vs. ~50%, respectively.
Monitoring of key in-cave variables (e.g., cave temperature, ventilation regime) influencing dripwater hydrology and carbonate saturation conditions provides the basis for a process-based understanding of modern environmental controls on stable isotope composition of speleothem and their growth conditions (e.g., [86–88]. In the lack of site-specific information (e.g., infiltration processes, calcite precipitation conditions), most of the paleoclimatic inferences of the early studies, e.g., [17,45], were not able to provide more than simplistic explanations. However, recently this knowledge-gap began to be filled as monitoring studies became abundant in the region [10,86,89–94]. This predicts that much more experimental experience is being made available to help the interpretation of the speleothem recorded geochemical signatures over the region in the forthcoming studies.
For example, detailed monitoring enabled a recent study comparing modeled and measured dripwaterδ18O values in Postojna Cave [95]. Monthly precipitation amount,δ18O data and monthly evapotranspiration were the input parameters, while mixing and delay processes taking place during infiltration were statistically simulated in the model. Authors found an excellent agreement between the measured δ18Ospel data and the ones calculated using the modeled dripwater δ18O between 1984 and 2002. This argues that the effects and processes governing theδ18Ospelvariations are well understood, thus theδ18Ospelsignal in that particular system can reliably be interpreted.
4.2. Environmental Controls on Speleothemδ18O
Theδ18O values in the surface waters of the Mediterranean Sea are higher than in the Black Sea, and much higher than in the Atlantic Ocean [96]. Together with the distinct evaporative conditions in the Mediterranean, this feature imprints the resultant atmospheric moisture with asource-specific isotopic signature, e.g., [97]. A key driver of changes in moisture transport trajectory in Europe during boreal winter (where most precipitation occurs) is the sea-level pressure (SLP) difference between the Arctic and the subtropical North Atlantic, the North Atlantic Oscillation (NAO; [98]). When the SLP difference is large (positive NAO mode), the main storm-track shifts to the north, transporting moisture and heat to western and northern Europe. When the SLP difference is weak (negative NAO mode), the North Atlantic jet is weakened and shifted to the south, bringing less heat, allowing an excess of Siberian cold air intrusions to the European continent, and bringing more moisture to southern Europe and its surroundings [99], including practically the entire study area. Besides the primary marine sources, recycled moisture from the Eurasian landmass at the eastern part of the region also becomes significant driver in continental areas [37,100,101]. Further, given the moisture transport trajectories from the ocean, weather systems travel a greater distance over land and are therefore affected by the processes of rainout, re-evaporation and moisture mixing in a positive NAO-mode. If precipitation is delivered from a more-distant moisture source (see above), then a larger fraction of the original moisture content is removed via subsequent precipitation events resulting in the continuous and progressive depletion of heavy isotopes in the remaining vapor, and lowerδ18O (and alsoδ2H) in the fallen precipitation [102]. Thesource specific isotopic signature, modified by the previously mentioned driving processes imprinted into meteoric waters, is then transferred to cave dripwaters, providing the opportunity to use the water stable isotopes of speleothem archives (δ18Ospel,δ2H of speleothem hosted fluid inclusions) as tracers for the intermittent moisture sources in different paleoclimatic conditions, assuming that the speleothem growth rate and the temporal persistence of atmospheric patterns bringing moisture from a given source renders it possible.
Quaternary2019,2, 31 12 of 26
A recent global analysis on the oxygen isotope composition of cave drip water showed a pronounced seasonal bias toward the precipitationδ18O (δ18Oprec) of recharge periods in European caves located in a relatively warm and dry climate [103]. Based on the experience gathered from case studies of the study region, the stable isotope compositions of dripwater reflect the amount-weighted annual meanδ18O (andδ2H) of local precipitation, or display a winter dominance, depending on the site-specific infiltration conditions [90,92]. The results of a large-scale simulation model of karstic groundwater recharge over Europe and the Mediterranean have also pointed out that winter half year is the main period of effective infiltration in the study region [40]. Hence the effectiveδ18O/T slope relevant for the infiltrated water may be expected to fall between the annual and cold seasons’ modern dayδ18O/T slopes.
To conduct an analysis of modern dayδ18O/T slopes in the region, monthlyδ18Oprecvalues were collected from the Global Network of Isotopes in Precipitation (GNIP [104]) stations of the study region along with monthly gridded precipitation amount, surface air temperature (E-OBS [105]) from the nearest grid cell to the GNIP stations. The time series of the Hurrell PC-Based NAO Index [106] were also gathered for the analysis. Amount-weighted annual and winter (October to March) meanδ18O values were computed. Only years for which GNIPδ18Oprecdata is available for enough months to represent>80% of the total annual precipitation and that had at least six years of evaluable data were used. The GNIP data provide a non-continuous coverage of 1961–2017; with an average of 23 and 24 years available for the annual and winter seasons respectively. Arithmetic means of air temperature (◦C), total amount of precipitation (mm) and NAO index were also computed for the same intervals. However, for the NAO index only the winter seasonal average was computed and used, because the annual aggregation of the NAO index may mask other atmospheric patterns [107].
The linear regression of the amount weightedδ18Oprecdata and meteorological parameters defined their long-term slopes/gradients. Spearman correlation coefficients (rs) betweenδ18Oprecdata and the NAO index was used to evaluate the strength of the relationships.
As a result, a regional pattern may be observed from the modern dayδ18O/T slopes (so-called
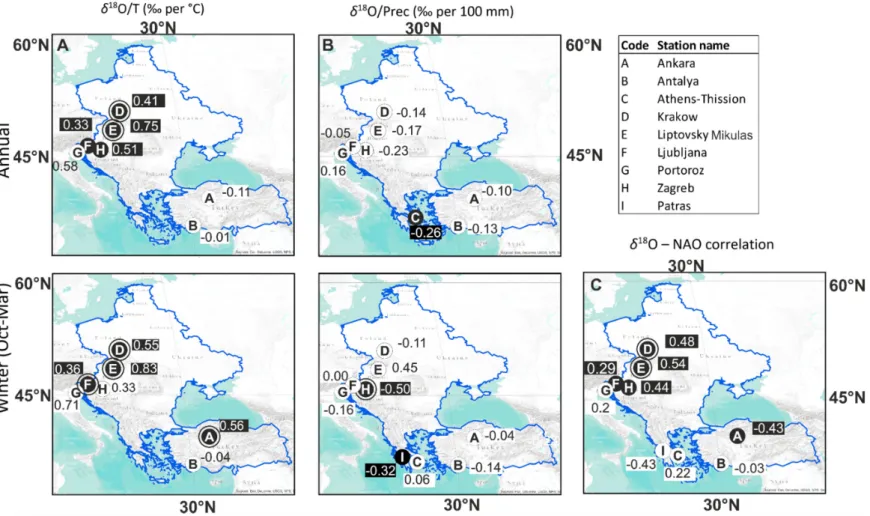
“temperature effect”), making it possible to distinguish between the warm Mediterranean coastal sites and the continental ones. A progressive increase in theδ18O/T slope was detected as moving inland from the Mediterranean to Central Europe (Figure5a). The temperature effect for annual precipitation ranges from−0.11%per◦C for Mediterranean sites, and up to 0.75%per◦C for continental locations (Figure5a). For the winter half of the year, the values range between−0.04 and 0.83 %per ◦C, with the steepest gradients again found at the inland sites (Figure5a). As for theδ18O/precipitation, the relationship is mostly negative, and just occasionally significant in the Aegean region (p<0.1), and at Zagreb in winter (p<0.05) (Figure5b).
According to additional observations, at lower latitudes (<45◦N) theδ18Oprecvariability negatively correlates with the winter NAO index, though to a rather insignificant degree, except for Ankara (rs=−0.43p=0.06; Figure5c). On the contrary, north of the Adriatic Sea (>45◦N), the rank correlation relationship betweenδ18O and the NAO index is quite strong, and its significance increases towards the central parts of the continent in winter (Figure5c).
The observed modern dayδ18O/T slope is well above the temperature dependence of water-calcite isotopic equilibrium fractionation (−0.24%per◦C [108]) at the continental locations of the Eastern part of Europe, while a different –insignificant- relation is observed at the coastal sites (Figure5a).
Thisδ18O/T difference implies that the oxygen isotope composition of speleothems from continental locations from the Eastern part of Europe may well reflect temperature variations, provided that the δ18Oprecsignal is transferred to the speleothem carbonate. As a supportive example, an excellent agreement has been found between speleothemδ18Ospelof a modern stalagmite from Postojna Cave (Slovenia) and the regional record of O isotope composition of precipitation between 1984 and 2002 [95].
On the other hand, the lack of significantδ18O/T relationship, together with the occasionally negative correlation with the amount of precipitation in the southern part of the study region (Figure5a,b) is in line with speleothem-based paleoclimate studies from the same area, which have found that δ18Ospelstrongly reflects fluctuations in precipitation amount [13,42,43]. Moreover, the correspondence between the interannual variability of total amount of October–January precipitation andδ18Ospel
from the Akcacale Cave (not yet in the database; Table1) was sufficiently strong to allow the first quantitative reconstruction of amounts of precipitation in late fall and early winter [67,109].
A previous study assessed the spatial variability in European winterδ18Oprec–NAO relationship using GNIP data available at that time [110]. No significant relationship was found for most of the stations analyzed in Eastern part of Europe and Turkey, and this study suggested a weak positive correlation (rs) across this region [110]. However, the current re-evaluation, using an updated GNIP dataset has pointed out a significant and stronger relationship (rsdifference>0.35) between winter δ18Oprecand NAO (avg.n=24) across East Central Europe. A more recent research also documented positive correlations (δ18Oprecand winter NAO) for Central Europe (GNIP sites west of 17◦ E and north of 45◦N) [111], which are in agreement with the ones obtained from GNIP stations located in the western part of our study area (station codes D, E, F, H in Figure5c). This provides a new insight into winterδ18Oprecand NAO relationship in Europe.
Besides this continental sub-domain with significant positive correlation, the insignificant δ18Oprec–NAO relationship is more restricted to the southernmost coastal areas (Figure 5c) than previously supposed. This spatial pattern revealed by the present analysis implies that the core region of the positiveδ18Oprec–NAO correlation mostly located in Central Europe [110] also extends eastwards.
The significant negative correlation ofδ18Oprec–NAO in winter season found in Central Anatolia (station code A in Figure5c) is an additional identified feature compared to the previous results [110].
This positive correlation in and around the Pannonian Basin, however, contradicts expectations.
On the basis of the region’s moisture source dynamics, in the case of a negative NAO mode, more Mediterranean18O-enriched (i.e., higherδ18O) moisture (see Gat et al. [97]) is to be expected at the inland locations, travelling via a shorter transport route that results in less negativeδ18Oprec. On the other hand, a positive NAO mode would deliver a dominantly18O-depleted (i.e., lowerδ18O) Atlantic moisture to the continental locations along a relatively longer route that results in more negative δ18Oprec. Since the observed relationship is contrary to the expected, other factors must be considered.
A positive NAO state would not only be associated with Atlantic moisture dominance, but also with increased heat transport to Central Europe, with an inverse response (reduced heat transport) in Anatolia [99].
It follows from these considerations that the observed positiveδ18Oprec–T andδ18Oprec–NAO relationships at the inland sites, along with the combination of positiveδ18Oprec–T and negative δ18Oprec–NAO correlations in central Anatolia, can be attributed to the complex interplay of temperature-related oxygen isotope fractionation along the moisture transport route, plus the effect of moisture source composition. At the inland sites, temperature-related fractionation dominates over the source effect and the NAO influence appears via the heat transport. At the Anatolian site the moisture source effect exceeds the temperature-related isotope shift, inducing a negative δ18Oprec–NAO correlation.
Quaternary2019,2, 31 14 of 26
Quaternary 2018, 2, x FOR PEER REVIEW 14 of 26
Figure 5. Map of Eastern part of Europe and Turkey, with the modern day δ18O/T (‰ per °C) (A) and δ18O/precipitation slopes (‰ per 100 mm) (B) in precipitation, and the δ18O–NAO Spearman correlations (C) for the whole year (upper row) and winter half year (October–March; lower row) for the GNIP stations indicated by letters in the circles with the corresponding station names in the inset table in panel (A). The circles with a black background indicate significance level p ≤ 0.1; while the ones with a double circle indicate p ≤ 0.05. The blue line shows the border of the studied region. The background is the Ocean Basemap is taken from Esri, GEBCO, NOAA, National Geographic, DeLorme, HERE, Geonames.org, and other contributors.
Figure 5.Map of Eastern part of Europe and Turkey, with the modern dayδ18O/T (%per◦C) (A) andδ18O/precipitation slopes (%per 100 mm) (B) in precipitation, and theδ18O–NAO Spearman correlations (C) for the whole year (upper row) and winter half year (October–March; lower row) for the GNIP stations indicated by letters in the circles with the corresponding station names in the inset table in panel (A). The circles with a black background indicate significance levelp≤0.1; while the ones with a double circle indicatep≤0.05. The blue line shows the border of the studied region. The background is the Ocean Basemap is taken from Esri, GEBCO, NOAA, National Geographic, DeLorme, HERE, Geonames.org, and other contributors.
4.3. Environmental Controls on Speleothemδ13C
Based on the review of the speleothem-based paleoclimate studies from the region, it could be deduced that variations ofδ13C values are primarily interpreted as a proxy for paleohydrological changes in the studied karstic areas although the highlighted effective/dominant responsible mechanism might be different. Lowδ13C values indicate enhanced soil biological activity, which occurs in the case of a rather positive soil water balance (i.e., subsurface water recharge exceeds evapotranspiration) (Abaliget Cave [49], AscunsăCave [46], Baradla Cave [74], Trio Cave [11], Skala Marion Cave [43], Mavri Trypa Cave [42], Kapsia Cave [13]) or simplified to corresponding low (high) δ13C values with dry (wet) periods (Ur¸silor Cave [47], Modriˇc Cave [41]). The phosphorus contents of the Trió speleothem further support that theδ13C values reflect changes in soil biological activity induced by changes in soil hydro-balance [11]. Unlike in the majority of the area, in the warm semi-arid environments of the Anatolian karst, the secular changes inδ13C may track changes in the dominance of C3 vs. C4 in the vegetation type (Dim Cave [44], Sofular Cave [38]).
The situation can be more complicated for well ventilated caves, where degassing-related kinetic fractionation causes an increase inδ13C values, which partly overprints the paleohydrological signals.
Two examples in the region are the Dim E3 and Leány records, which indicated enriched carbon isotope compositions (δ13C>−5%) compared to the others in the region (Figure2b) likely due to a ventilation effect; see also Section5. However, minima in speleothemδ13C curves even in these cases can be regarded as largely unaffected by such kinetic processes [49] and likely reflect wet periods (i.e., positive soil water balance).
5. Regional Patterns in Carbon- and Oxygen Isotope Records
Prior to assessing the regional patterns, the records most prone to kinetic effect must be identified to avoid using records that may not be clear indicators of an environmental change [112]. A weak or no correlation betweenδ13C andδ18Ospeldata is conventionally indicative of deposition of calcite in isotopic equilibrium with the dripwater [113], therefore, the lack of significant correlation between the C and O isotope compositions, as in the case of the ABA_1 (p=0.044), PU-2 (p= 0.251) and Dim-E4 (p=0.089) records (Figure S2, Table S1), suggest a quasi-equilibrium carbonate precipitation.
In cases where theδ13C andδ18O values are positively correlated with a slope exceeding a value of 1, strong kinetic isotope fractionation effect can be expected to have occurred during carbonate precipitation [114]. The highest positive slope (2.64) with a significant correlation (adjusted R2=0.45;
p<6.5×10⁻¹⁵) betweenδ13C andδ18Ospel values was observed in the CC-1 record. However, this is because the samples were gathered along a radial transect [45], rather than along the growth axis of the speleothem so that the kinetic effect is exaggerated as sampling points are closer to the edge.
The strongest correlation (adjusted R2=0.64) although with a less steep slope of 0.35 (p<0.003) is seen in the short dataset of Pos-STM-4 record (Figure S2, Table S1). This kinetic effect was not an issue in the original study, because its primary scope was to detect the increase in14C activity due to nuclear tests and to model the dynamics of soil carbon pools producing soil CO2[18]. In addition, other exposed records to kinetic effect were the Dim-E2, E3 and S1 records with significant positive δ13C-δ18Ospel slopes (>1.4; p<1.7 ×10⁻¹⁵), which have to be handled with caution in advanced (paleo)climatological studies.
Nowadays, however, a weak correlation betweenδ13C andδ18Ospelvalues is less taken to indicate isotopic equilibrium conditions. The replication test which investigates a high degree of coherence between individualδ18O and/orδ13C profiles from different speleothems from the same cave over the common period is a more stringent test of suitability for paleoclimatic studies [115]. Moving from the cave level (speleothems from the same cave [115]) to a regional level (speleothems from a cave system or nearby caves), the SISAL_v1 database and future versions provides a good opportunity for regional replication tests. On the one hand, if the records share common patterns, it might confirm a regional environmental signal, as in the case of e.g., South American Monsoon System [116]. On the other hand, trends and/or anomalies in stable isotope composition of speleothems occurring exclusively in an
Quaternary2019,2, 31 16 of 26
individual record may be owed to site specific factors. For example, the pronounced13C enrichment prevailing in the older section of the CC-1 record and preceding the growth stops of S1 is hardly replicated in the coeval speleothems from the region (Figure3b). This suggests that at least some of their sections carry a strong kinetic effect and should be also treated with caution. It is worth mentioning, that these records (e.g., CC-1, S1) were also among the ones, possibly most affected by kinetic fractionation according to theδ18Ospelvs.δ13C correlation.
5.1. Major Patterns of Speleothemδ13c andδ18o Records in the Eastern Part of Europe and Turkey from the Sisal_V1 Database
An abrupt increase inδ18Ospel values marks the transition from MIS 5e to MIS 6, recorded both in the Abaliget- and Baradla caves’ speleothems (Figure2a). Positive shifts inδ18Ospelvalues corresponding to Heinrich events were documented in South Anatolian (Dim Cave [44]) speleothems, and inverse sudden changes in a north Anatolian (Sofular Cave [38]) record. The negative shift in So-1 resonates to a decreased heat transport from the cooled Atlantic inland. The mirrored pattern ofδ18O from the Dim speleothems is in agreement with the Levantine records [117]. Hence, these variations can similarly be linked to hydroclimatological changes, i.e., less precipitation.
Regarding the full interval covered by the region’s records, the negative peaks inδ13C at ~120 ka BP and ~43 ka BP are most profoundly replicated by two pairs of records: BAR-II#L and BAR-II#B and So-1 and Dim-E3 respectively (Figure2b). However, the one at ~43 ka BP is not associated with a concomitant18O peak (Figure2).
Comparing late-MIS 6 and MIS 2 glacial patterns,δ18O behave systematically (lowδ18Ospelvalues in glacial and highδ18Ospelvalues in interglacial times), while the averageδ13C of the ABA-1 record (Hungary) in the late-MIS 6 is lower and less variable than the average carbon isotope composition during MIS 2 in Anatolian records (Figure2). This difference may derive from locally influenced carbon isotope values (e.g., related to ventilation and variable host rock contribution), but it may also be attributed to climatic conditions. Supporting the latter, paleoglaciological reconstructions argue for significantly more extended ice cover in the Dinarides and Hellenides in the MIS 6 compared to MIS 2 [118,119] suggesting more humid conditions. Paleoglaciological and paleobiological evidence argue for a similar MIS 2 vs. MIS 6 contrast regarding hydroclimate in the western Mediterranean (e.g., [120]). This hydroclimatological contrast might be partially reflected in speleothem isotopic records. Following the last glacial maximum (~20 ka BP) all available records (except Dim-E2) indicate an increase inδ18Ospel. The highest change is displayed by the So-1 (~5%between 12 ka BP and 8 ka BP). This gradual drift inδ18Ospel was linked to the long-term change in Black Sea moisture contribution [38].
In the Holocene, most of the records’δ13C values scatter around -10%and do not show any common trend or shift (Figure3b). Important Holocene climate swings in Europe (e.g., 8.2 and 4.2 ka BP events) have been reported in some speleothem records of European subregions [31,121], however such records are not included in the regional—Eastern Europe and Turkey—subset of the current version of the SISAL_v1 database [30]. Negativeδ13C anomalies around 3.5 ka BP were recorded in the Sofular- and the Trio cave records, which were attributed to regional climate-change events [14]. The climate change starting at ~3.7 ka BP with shifting to wetter conditions (lowerδ13C values), was interrupted by a positiveδ13C peak at ~3.6 ka BP (Figure3c). This prominentδ13C shift has been interpreted as a sign of environmental deterioration induced by the Thera volcanic eruption [14], which was later challenged on the basis of a significant time lag between the deposition of volcanic material and the positiveδ13C shift [15].
The strong negative shift inδ13C around 3.6–3.5 ka BP is associated with a negativeδ18Ospelpeak in both Trio- and So-1 records, likely related to a cold and wet phase [11]. Notably, the MAR_L record [43]
replicates thisδ13C pattern, although with different pattern in itsδ18O values. The low sampling resolution of other currently available records covering the 4 to 3 ka BP period (PU-2, POM2; Figure4) makes these records unsuitable for contributing to this issue. In the meanwhile, the high-resolution
d-excess [122] record of the cave ice deposit from Scări¸soara Ice Cave (Romania) shows an abrupt increase at that time, likely suggesting more Mediterranean moisture contribution, accompanying wetter conditions [21].
5.2. Assessment of Spatial Patterns of Speleothemδ18O in the Holocene
The SISAL_v1 database contains 12 records from the Eastern part of Europe and Turkey covering the past 11.7 kyr, withδ18Ospelvalues ranging between -3 and -12%(Figure3a). The meanδ18O values tend to follow a latitudinal trend, albeit, two records stand out from this pattern. MOD-22 has the highestδ18Ospelvalues despite not being at the southernmost location, while the So-1 has relatively low δ δ18Ospel values (Figure3a) despite its host cave not being the northernmost one (Figure 1;
Table1), thus contradicting a putative latitudinal gradient. These low values of So-1 could be driven by moisture, derived from the less evaporated nearby Black Sea [38,39], compared to the strongly evaporated surface waters of the Mediterranean Sea feeding other areas of the region [36].
The relatively higher abundance of data from the mid-Holocene (Figure3a) provides an additional insight into the spatial trends of δ18Ospel values. Average δ18Ospel values were calculated for contemporarily formed deposits from three separate semi-millennial periods from the Holocene (Figure6). Unlike previous observations [123] continental trends could not be observed probably due to the limited spatial extent of the available data (latitudinal extent<12◦, longitudinal extent<18◦; Figure1). Additionally, the infiltration of precipitation water at individual cave sites is seasonally biased [90,92], resulting in drip waters with varying winter/summer precipitation contributions and consequently changingQuaternary 2018, 2, x FOR PEER REVIEW δ18O values. 18 of 26
Figure 6. Elevation gradient of δ18Ospel for three semi-millennial time horizons for the past 5000 yrs for SE Europe. The italic numbers above the dots refer to the site names found in Table 1.
However, we found negative correlations between δ18Ospel records from eastern and southeastern Europe and site elevation (Figure 6). This stands even though “elevation m amsl” (Table 1) in the database corresponds to the cave entrance elevation [29,30] rather than the elevation of dripwater recharge area, the latter being the actual controlling factor. It can be assumed that the difference in site elevation primarily represents the difference in infiltration area elevations.
Despite this uncertainty regarding the elevation of the actual recharge area, estimated δ18Ospel
elevation gradients for SE Europe calculated for three non-overlapping semi-millennial periods (and excluding records with high risk of kinetic effects as pointed out in Section 5) during the past ~5 kyr suggests that this elevation trend is characteristic of the Holocene. Computed elevation gradients were significant (at p < 0.1 level) in all but one cases and scatter around −0.26‰/100 m.
The documented negative shift in δ18Ospel values with increasing elevation is regulated by two main factors. Depletion of meteoric precipitation in heavy isotopes with elevation is expected [124]
and isotopic “elevation effect” in precipitation has been measured in this region as ranging from
−0.24‰ per 100 m to −0.39‰ per 100 m [37,88,125–127] transferring with a less steep gradient to shallow groundwater (e.g., −0.24 ‰ per 100 m, [128], interquartile margins: −0.11 and −0.24‰ per 100 m, ref. [129] and dripwater (e.g., −0.11‰ per 100 m, [88]). This process may account for most of the variance. Mean surface temperature also decreases with elevation, which is reflected in cave air temperature. Temperature dependent calcite-water fractionation—with a gradient of −0.24‰ per °C [108]—likely plays an additional role.
Whether the δ18Ospel—elevation gradient (Figure 6) prevails over geological timescales, especially under distinct climate settings such as the LGM, can be better explored with an increased number of records, providing a much-improved replication in this specific period. The robustness of these empirical gradients can be further explored extending the study region towards nearby regions [31,117].
6. Stable Isotopic Composition of Fluid Inclusions of Speleothems from South East Europe and Turkey to Complement Paleoenvironmental Implications of δ18Ospel
Figure 6.Elevation gradient ofδ18Ospelfor three semi-millennial time horizons for the past 5000 yrs for SE Europe. The italic numbers above the dots refer to the site names found in Table1.
However, we found negative correlations betweenδ18Ospelrecords from eastern and southeastern Europe and site elevation (Figure6). This stands even though “elevation m amsl” (Table1) in the database corresponds to the cave entrance elevation [29,30] rather than the elevation of dripwater recharge area, the latter being the actual controlling factor. It can be assumed that the difference in site elevation primarily represents the difference in infiltration area elevations.
Quaternary2019,2, 31 18 of 26
Despite this uncertainty regarding the elevation of the actual recharge area, estimatedδ18Ospel
elevation gradients for SE Europe calculated for three non-overlapping semi-millennial periods (and excluding records with high risk of kinetic effects as pointed out in Section5) during the past ~5 kyr suggests that this elevation trend is characteristic of the Holocene. Computed elevation gradients were significant (atp<0.1 level) in all but one cases and scatter around−0.26%/100 m.
The documented negative shift inδ18Ospelvalues with increasing elevation is regulated by two main factors. Depletion of meteoric precipitation in heavy isotopes with elevation is expected [124]
and isotopic “elevation effect” in precipitation has been measured in this region as ranging from
−0.24%per 100 m to−0.39%per 100 m [37,88,125–127] transferring with a less steep gradient to shallow groundwater (e.g.,−0.24 %per 100 m, [128], interquartile margins: −0.11 and −0.24%
per 100 m, ref. [129] and dripwater (e.g.,−0.11%per 100 m, [88]). This process may account for most of the variance. Mean surface temperature also decreases with elevation, which is reflected in cave air temperature. Temperature dependent calcite-water fractionation—with a gradient of
−0.24%per◦C [108]—likely plays an additional role.
Whether theδ18Ospel—elevation gradient (Figure6) prevails over geological timescales, especially under distinct climate settings such as the LGM, can be better explored with an increased number of records, providing a much-improved replication in this specific period. The robustness of these empirical gradients can be further explored extending the study region towards nearby regions [31,117].
6. Stable Isotopic Composition of Fluid Inclusions of Speleothems from South East Europe and Turkey to Complement Paleoenvironmental Implications ofδ18Ospel
Stable isotope analyses of inclusion-hosted water were performed on about a third of the speleothems records (n=18) included in the SISAL_v1 database from the region; six speleothems belonging to four caves. Note, that the fluid inclusion data of the ABA 1 and ABA 2 flowstone cores [49]
are unpublished. Out of the 371 speleothem records in the entire SISAL_v1 database, the isotopic composition of fluid inclusions was analyzed only in 27; 6 out of 18 in the study region. Despite the relatively small number of locations studied, stable isotope composition of inclusion-hosted water as a complementary parameter is well represented in the region.
This regional database provides an opportunity to illustrate the auxiliary information of fluid inclusion δ2H in interpreting carbonate stable isotope compositions for paleoclimate inferences.
The sub-regional Middle Bronze Age (~3.5 ka BP) climate swing recorded by certain Hungarian, Turkish and Greek speleothems’δ13C andδ18O records (Section5.1) coincides with a ~15%negative shift of fluid inclusionδ2H of the Trióspeleothem peaking at 3.5 ka BP (Figure3a). This was interpreted as a combined effect of temperature change and an increased contribution of winter precipitation to the infiltration [11]. Detailed paleoclimatological reconstruction for this period is important because archaeological evidence points to substantial societal-changes in the European–Mediterranean region occurring at the same time [11,130,131]. A similar series of temperature and precipitation seasonality changes were inferred for the last interglacial on the base of coupled negative shifts inδ13C,δ18Ospel and fluid inclusionδ2H [48]. These complex paleoenvironmental changes could not have been revealed without the combined assessment of carbonate and fluid inclusion stable isotope compositions illustrating that latter serves as an important paleotemperature proxy.
7. Conclusions and Outlook
The diverse karst landscapes of the Eastern part of Europe and Turkey offer a great potential for reconstructing past environmental changes based on isotope records from speleothems. The regional subset of the first global database on carbonate stable isotope composition (SISAL_v1 [29,30]) includes 18 speleothem records. The number of overlapping records in this subset is generally low, with the most represented period spanning from 5–1 ka BP with 5 to 8 records. The Sofular Cave So-1 record is the only one in the region covering the last glacial cycle and extending into the Holocene. This is an obvious weakness in temporal coverage that should to be improved in the future. Thus, there is a strong


![Table 1), thus contradicting a putative latitudinal gradient. These low values of So-1 could be driven by moisture, derived from the less evaporated nearby Black Sea [38,39], compared to the strongly evaporated surface waters of the Mediterranean Sea feedi](https://thumb-eu.123doks.com/thumbv2/9dokorg/1324962.106887/17.892.165.730.583.992/contradicting-putative-latitudinal-gradient-moisture-evaporated-evaporated-mediterranean.webp)
