Full Terms & Conditions of access and use can be found at
https://www.tandfonline.com/action/journalInformation?journalCode=cpce20
Post-Communist Economies
ISSN: 1463-1377 (Print) 1465-3958 (Online) Journal homepage: https://www.tandfonline.com/loi/cpce20
Quality of governance and varieties of capitalism in the European Union: core and periphery
division?
Beáta Farkas
To cite this article: Beáta Farkas (2019) Quality of governance and varieties of capitalism in the European Union: core and periphery division?, Post-Communist Economies, 31:5, 563-578, DOI:
10.1080/14631377.2018.1537740
To link to this article: https://doi.org/10.1080/14631377.2018.1537740
© 2019 The Author(s). Published by Informa UK Limited, trading as Taylor & Francis Group.
Published online: 11 Jan 2019.
Submit your article to this journal
Article views: 1883
View related articles
View Crossmark data
Citing articles: 2 View citing articles
Quality of governance and varieties of capitalism in the European Union: core and periphery division?
Beáta Farkas
Department of Finance and International Economic Relations, University of Szeged, Szeged, Hungary
ABSTRACT
A growing body of literature suggests that the quality of govern- ance has a significant effect on economic development.
Investigations highlight that the quality of government institutions varies substantially in the European Union. These differences raise the question of whether they comply with the various models of capitalism. However, the various approaches of institutional ana- lyses either neglect the role of the state or consider only the welfare function and the extent of state intervention. This article uses the databases of the World Bank and the World Economic Forum to classify the members of the European Union into clusters based on the quality of governance. Cluster analysesfind notably clear-cut clusters in both cases. These clusters do not coincide with the usual varieties of capitalism; instead, they indicate a gap between the northern and western vs. the southern and eastern European countries, which is a core vs. periphery division. This gap indicates a long-lasting challenge in the deepening of European integration.
ARTICLE HISTORY Received 17 April 2018 Accepted 16 October 2018 KEYWORDS
Quality of governance;
varieties of capitalism;
European integration;
central and eastern Europe;
southern Europe
Introduction
Before the 2008 global crisis, economic convergence with western Europe seemed successful in both the Mediterranean countries and central and eastern European (CEE) new member states of the European Union (EU).1 As the Eurostat database demonstrates, the Mediterranean countries have substantially diverged from the EU-28 average of per capita GDP since the 2008 crisis. After the second dip of the crisis in 2012, economic convergence has regained momentum in the CEE member states.2However, it is obvious that these countries will not return to the same, pre-crisis track because several factors slow convergence. The productivity increase during the transition from a planned economy to a market economy was a non-recurrent effect.3 In the coming years, the speed of population ageing will accelerate in the CEE member states, imped- ing growth. Despite the great FDI influx since the systemic change, the CEE systems of innovation have remained weak (Galgóczi & Drahokoupil, 2017). Under these circum- stances, special attention should be paid to the role of institutions in growth and development. The European Commission’s Seventh report on economic, social and territorial cohesion highlights the importance of improving institutions, especially of
CONTACTBeáta Farkas bfarkas@eco.u-szeged.hu 2019, VOL. 31, NO. 5, 563–578
https://doi.org/10.1080/14631377.2018.1537740
© 2019 The Author(s). Published by Informa UK Limited, trading as Taylor & Francis Group.
This is an Open Access article distributed under the terms of the Creative Commons Attribution-NonCommercial-NoDerivatives License (http://creativecommons.org/licenses/by-nc-nd/4.0/), which permits non-commercial re-use, distribution, and reproduction in any medium, provided the original work is properly cited, and is not altered, transformed, or built upon in any way.
high-quality government (European Commission [EC], 2017a). Government institutions are the decisive elements of institutional setting. This fact begs the question of how the differences in the quality of governance comply with models of capitalism.
This article proceeds as follows. The next sections review the approaches found in the literature regarding how the quality of governance relates to economic growth and the role of the state in the varieties of capitalism. In the following section, cluster analysis classifies the 28 EU member states into clusters based on the last available Worldwide Governance Indicators of the World Bank and the indicators of the World Economic Forum (WEF). To discover the changes over time, standard deviation is calculated for the years, which can be compared by unmodified methodology. These one- and two-decade -long trends suggest that the differences in the quality of governance cannot be identified with the usual classification of capitalism models. The final section discusses the implications of the gap between the northern and western vs. the eastern and southern European countries.
Quality of governance and economic growth
The idea that institutions affect economic development is very old. Adam Smith noticed that Marco Polo’s thirteenth-century descriptions of agriculture and industry in China and those by eighteenth-century travellers were very similar. Smith’s explanation was that China ‘had perhaps, even long before his time, acquired that full complement of riches which the nature of its laws and institutions permits it to acquire’(Smith, 1776/
1979, p. 89). As early as a century ago, sociologists had no doubt that institutions matter for economic development (cf. Max Weber’s work). At that time, neoclassical theories exiled the investigation of institutions from the field of economics. Consequently, the neoclassical growth framework overlooked the relationship between growth and institu- tions. In the mid-1980s, endogenous growth theory began to incorporate innovation and education. In subsequent years, many aspects of institutions have been added to traditional factor endowments, and the significance of institutions has become generally accepted, even in mainstream economics.4
A wide range of research has attempted to identify the types of institution which have an impact on growth. Acemoglu and Robinson (2008) grasp this issue in a broad historical context by modelling the relationship between economic and political institu- tions and political power. Hall and Jones (1999) define institutions and government policies as social infrastructure. They document empirically that output per worker is driven by differences in the social infrastructure across countries. Over the last two decades, many studies have linked the role of informal institutions, especially social capital, to economic development (Doh,2014). Tabellini (2005, pp. 1–2) suggests a wider concept of institution:‘In a narrow interpretation, institutions can be thought of as the formal rules of the game that shape individual incentives and constraints. In a broader interpretation, institutions also include systems of beliefs or social norms that sustain specific equilibria’. This researcher’s empirical testing indicates a causal effect of culture on economic development. However, this paper does not address the complex relation- ships of institutions, culture and development.
The factors that seem crucial in explaining economic performance in cross-country tests are often related to governance, e.g. property rights (Knack & Keefer, 1995),
political freedom (Piątek, Szarzec, & Pilc, 2013) and corruption and state capture (Blagojević & Damijan, 2013). La Porta, Lopez-de-Silanes, Schleifer, and Vishny (1999) investigate the determinants of the quality of governance and find that exogenous historical factors (e.g. religion, distance to equator) are significant. Rodríguez-Pose and Di Cataldo (2015) demonstrate that quality of government shapes innovation capacity, which is a channel for influencing economic performance. Rothstein and Teorell (2008) argue for the utmost importance of the impartiality of institutions that exercise govern- ment authority. All of the abovementioned studies assume that the quality of govern- ance affects growth. Using regression analysis, Glaeser, La Porta, Lopez-de-Silanes, and Schleifer (2004) suggest a reversed causal link, namely, that poorer countries emerging from poverty (often pursued by dictators) are more likely to improve their institutions.
These researchers examine a global sample in the long run, which includes very different cultures and political systems. In a more homogeneous context, in the EU, Rodríguez- Pose and Garcilazo (2015) underline the role of high-quality government in economic growth. These researchersfind that above a threshold of cohesion expenditure, govern- ment quality improvements are more important for regional development than is additional public investment.
A complete overview of the literature would go far beyond the scope of the present study. Considering the arguments on the quality of governance, it can be summarised
‘that government effectiveness, rule of law, impartiality, and professionalism may be key features or important aspects of the governmental quality’(Doh,2014, p. 108).
These insights are reflected in the concept behind the well-known database of the World Bank, the Worldwide Governance Indicators (WGI). World Bank researchers Kaufmann, Kraay, and Zoido-Lobatón (1999)find a strong causal relationship from better governance to better development outcomes. These researchers define governance as traditions and institutions by which authority in a country is exercised, which includes the selection, monitoring and replacement processes of governments, the policy forma- tion and implementation capacity of governments, and the respect of citizens and the state towards economic and social institutions. This structure is followed in data collec- tion. Measurement is one of the most contested points in the investigation of govern- ance quality. WGI are created from data on perceptions of governance built on expert surveys and polls. Both subjectivity and aggregation suggest severe methodological problems. Kaufmann, Kraay, and Mastruzzi (2010) argue that there are few alternatives of measurement in this field and that perception is important because agents base their decisions on perception. Furthermore, several studies have demonstrated that objective data, such as de jure regulations, are often misleading and differ substantially from reality. The methodology of WGI seeks to avoid information biases using over 30 data sources and careful aggregation techniques.
Role of the state and varieties of capitalism
There remains interest in institutional comparisons after the collapse of the socialist system. In the literature, two particular trends could be distinguished in the 2000s. On the one hand, the approach known as the varieties of capitalism (VoC) examines the institutional system of developed countries from a political-economic point of view, searching for alternatives to the neoliberal system of the United States. On the other
hand, another group of researchers analyses the transition of socialist countries, search- ing for analogies to be able to classify the VoC literature or to refuse this possibility.
Hall and Soskice (2001) launched the dual classification of liberal and coordinated market economies. These researchers placed thefirm, along with the most important spheres in which firms develop relationships, at the centre of their investigation.
Although Hall and Soskice connect their models to various states (United States and Germany), the role of the state is missing. This deficiency is recognised by Soskice (2007), who examines how production regimes are complementary to welfare state regimes and political systems, maintaining the dual classification of market economies into liberal and coordinated market economies. There is another point where Hall and Soskice (2001) accept the role of the state. These researchers find it possible that southern European countries constitute another type of capitalism, the Mediterranean type, with its distinctive features being a large agrarian sector and extensive state intervention.
Several authors have used plural classifications to identify models of capitalism. By the beginning of the 2000s, in spite of the various content based and methodological approaches, it has been largely accepted that the old EU member states are classified into four models (the Anglo-Saxon, Nordic, continental and Mediterranean), which are comple- mented by the Asian model in some studies. The extension of state intervention is why the Mediterranean model is named ‘state-driven’ (Boyer, 2005), ‘state capitalism’ (Schmidt, 2002) or ‘compensating state’ (Hancké, Rhodes, & Thatcher, 2007). In the description of the distinct Nordic and Asian models, the different regulation and welfare functions of the state play a decisive role (Amable, 2003; Coates, 2000; Ebbinghaus, 1999; Sapir, 2006;
Schröder,2013). It is remarkable that these authors do not address the CEE countries even though 10–15 years have passed since the change in their political systems.
Thefirst attempts which compared the CEE countries with existing models covered only a few countries, or the scope of the applied data and viewpoints was not as wide as in the case of the old capitalist countries. Nölke and Vliegenthart (2009) argue for the existence of a new model of capitalism, which they term a ‘dependent market economy’, but their investigation only covers the Visegrád countries. The authors apply FDI unilaterally as a single, universal explanatory factor and the role of the state is neglected. The first comprehensive examination, by Bohle and Greskovits (2012), proves that after the fall of the socialist system, three versions of capitalism emerged in central and eastern Europe:
a purely neoliberal type in the Baltic States, an embedded neoliberal type in the Visegrád countries, and a neo-corporatist system in Slovenia. These researchers take the specific features of the socialist legacies into account, with the different regulation and welfare functions of the state being the distinctive factors of the three versions. Farkas (2011,2016) elaborates a common framework for all of the EU member states, adding the CEE model to the old models of capitalism in which the same state functions are considered.
Since the spread of globalisation and the collapse of the Soviet Union the institutional comparison has implied the question, of whether countries are headed towards one single liberal model of capitalism, due to international competition, or whether there are several competitive institutional arrangements. Despite the increasing literature on the relationship between the quality of governance and economic performance, models of capitalism embrace the extension of state intervention and of state welfare functions but not the quality of governance.
Clusters of the different quality of governance
In this paper, the governance indicators of international databases are used to form clusters to reveal the relationship between the models of capitalism and the quality of governance. The clusters based on the quality of governance are compared to the classification of countries by the models of capitalism. Considering several studies (Amable,2003; Farkas, 2011; Hall, 2018), five models of capitalism can be identified in the EU: the Nordic (Denmark, Finland and Sweden), the Anglo-Saxon (Ireland and the United Kingdom), the northwestern continental (Austria, the Benelux states, France and Germany), the Mediterranean (Cyprus, Greece, Italy, Malta, Portugal and Spain) and the central and eastern European (Baltic States, Bulgaria, Croatia, Czech Republic, Hungary, Poland, Romania, Slovakia and Slovenia). In the cited studies, the minor differences in grouping and the borderline cases have no significance in this research.
To measure the quality of governance, the most complex indicators are the WGI, which synthetise the perception of commercial business providers, non-governmental organisations, multilateral organisations and other public sector bodies. Taking into account the uncertainties of the indicators based on perception, it is reasonable to apply another database for control measurement. The database of the WEF Global Competitiveness Report seems to be the most appropriate because that dataset includes the indicators which are developed to measure the institutions’ contribution to the competitiveness of countries and thereby to their economic performance. In addition, these indicators are created by surveys of business people and do not merely reflect the opinion of some experts. Although these WEF surveys are also used among the data sources of the WGI, their average weight is only 4–5%. Therefore, they are appropriate for a control measurement.
Cluster analyses reflect the classification of country groups in a given year. It is more informative if the standard deviation of those indicators which established the clusters is also measured among and within the clusters in a time series. This can express whether the clusters become more homogenous or heterogeneous over time. In the WGI negative scores are also used in addition to positive ones, making it impossible to calculate coefficient variation. WEF surveys measure the responses on a positive scale, but to apply the same method, standard deviation is calculated in this database as well.
Due to the different scales, the values of standard deviation cannot be compared between the two databases.
Clusters of EU members by the WGI
In the dataset of the WGI, two of the six composite indicators (voice and accountability, and political stability and absence of violence/terrorism) capture perceptions of the quality of democratic institutions. The other four indicators relate to government effec- tiveness, professionalism (government effectiveness, regulatory quality) and rule of law, impartiality (rule of law, control of corruption) more closely. In the EU, the basic requirements of democratic institutions can be assumed, and the differences in govern- ment effectiveness, professionalism, rule of law and impartiality indicate more directly the contribution of the quality of governance to economic performance. It can also be assumed that opinion on the general institutional framework may be influenced by
actual political conflicts and partisan biases to a greater extent than perception of the issues closer to everyday experiences.
To form clusters, the values of indicators are used because these values measure the differences more precisely than the ranking of a country. The values of indicators range from around−2.5 to 2.5 in all of the cases. In the computation, government effective- ness, regulatory quality, rule of law and control of corruption are applied from the latest available WGI (2016). The tasks were run with the Statistical Package for the Social Sciences (SPSS version 24) software using hierarchical clustering with Ward’s variance method.5
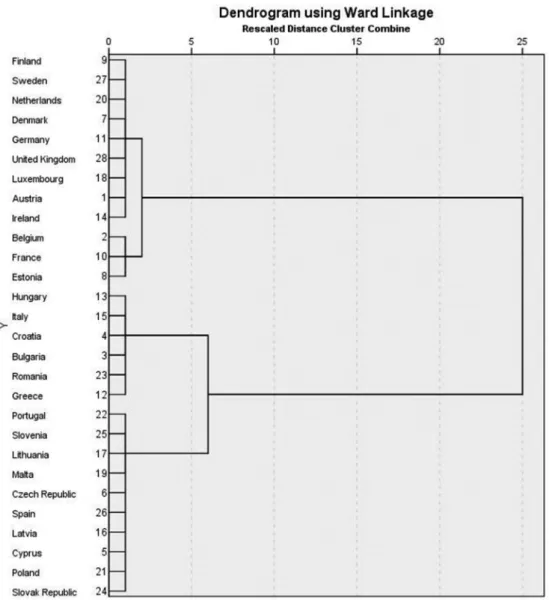
The hierarchical cluster analysis shows a very clear-cut picture (Figure 1andTable 1).
There is a deep division between the northern and western vs. the eastern and southern countries. Estonia is the only eastern European country which belongs to the countries with good quality of governance. The cluster of countries with the best quality of governance comprises all of the northern and western European member states with the exception of France and Belgium. The southern and eastern European countries belong to one of two clusters. The eastern and southern countries’cluster with medium quality of governance includes Cyprus, Czech Republic, Latvia, Lithuania, Malta, Poland, Portugal, Slovakia, Slovenia and Spain.
The difference in cluster means is very significant, even between the populous northern and western cluster vs. the eastern and southern cluster with its medium quality of governance. However, the difference between the two eastern and southern clusters means is also remarkable. The cluster of countries with low quality of govern- ance includes the southeastern European countries (Bulgaria, Croatia, Greece and Romania), Italy and Hungary.
One can raise the objection that the cluster analysis based on the data of a given year does not highlight changes over time. Thus, the four indicators are aggregated to investigate their standard deviation. As the indicators are scaled in the same way, and as there is no reason to give them different weights, their average value is applied. The WGI were measured from 1996 to 2002 in every second year, and annually after that. The indicators are built on many information sources; therefore, methodological changes cannot be excluded. However, none of the information sources has so large a weight in the WGI database that it could cause significant distortion.
The standard deviation is measured among the 28 countries, the four clusters and within the clusters (Figure 2). This shows that three clusters (with good, medium and weak quality of governance) have become more homogenous over time. The cluster of northern and western countries with the best quality of governance seems to be the most homogenous. In the crisis years, the standard deviation increased slightly, but overall its volatility was small across two decades.
The stable position of Belgium and France over this period and the increasing scores of Estonia created a converging cluster of good governance quality. Surprising conver- gence happened in the cluster of countries with low quality governance. The scores of country indicators suggest that the preparation for accession and EU membership in the southeastern European post-socialist countries has resulted in the improvement of governance quality. Meantime, in contrast, the quality of governance deteriorated in Italy and Greece, and this process has accelerated since the 2008 global crisis. Hungary is a special case, which had the best scores up until 2002, not only in this cluster but
among all of the post-socialist countries. However, since 2006 there has been a continuous and rapid deterioration.
The degree is smaller but the direction is similar in the cluster of medium quality of governance. The impact of deterioration in the Mediterranean countries and of improve- ment in Latvia and Lithuania has increased the homogeneity of the cluster. This improvement is smaller and/or more volatile in the Czech Republic, Poland, Slovakia and Slovenia.6
The convergence within the clusters is accompanied by divergence among clusters. In the last 2 or 3 years the standard deviation of clusters has been catching up with that of the 28 countries.
Figure 1.Clusters of EU-28 based on selected Worldwide Governance Indicators, 2016.
Source: Own calculation from World Bank’s Worldwide Governance Indicators (retrieved from:http://info.worldbank.
org/governance/wgi/#home, accessed December 2017).
Clusters of EU members in the WEF Global Competitiveness Report
In the WEF Global Competitiveness Report (GCR) one pillar of indexes measures the quality of institutions from the viewpoint of competitiveness. This sub-index contains some indicators which relate to the general framework of democracy and which focus on the efficiency and impartiality of governance. The latter indicators are chosen in order to conduct a control cluster analysis: diversion of public funds, public trust in Table 1.Description of the clusters based on selected Worldwide Governance Indicators, 2016.
Northern and wes- tern countries with the best quality of
governance
Northern and wes- tern countries with good quality of
governance
Eastern and south- ern countries with low quality of
governance
Eastern and south- ern countries with medium quality of
governance Total Number of
countries 9 3 6 10 28
Control of corruption
Mean 1.9615 1.3945 0.0179 0.6471 1.0148
Std. Deviation 0.26786 0.19628 0.12106 0.20974 0.79195
Government effectiveness
Mean 1.6974 1.2829 0.2983 1.0106 1.1079
Std. Deviation 0.17727 0.15026 0.25944 0.14776 0.54692
Regulatory quality
Mean 1.7450 1.3697 0.5107 0.9746 1.1652
Std. Deviation 0.15739 0.31492 0.21516 0.15441 0.50652
Rule of law
Mean 1.7905 1.3510 0.2788 0.9434 1.1169
Std. Deviation 0.18309 0.09265 0.19303 0.17623 0.59362
Source: Own calculation from World Bank’s Worldwide Governance Indicators (retrieved from:http://info.worldbank.
org/governance/wgi/#home, accessed December 2017).
Figure 2.Standard deviation of selected Worldwide Governance Indicators among and within the clusters of EU-28, 1996–2016.
Note: From 1996 to 2002 data are available in every second year.
Source: Own calculation from World Bank’s Worldwide Governance Indicators (retrieved from:http://info.worldbank.
org/governance/wgi/#home, accessed December 2017).
politicians, irregular payments and bribes, favouritism in decisions of government offi- cials, transparency of government policymaking, burden of government regulation, efficiency of government spending, efficiency of legal framework in settling disputes and efficiency of legal framework in challenging regulations. These indicators are not composite ones but rather derived from surveys and always expressed as scores on a 1–7 scale, with 7 being the most desirable outcome. The latest GCR was published in 2017, and its data are applied in the hierarchical clustering with Ward’s variance method.
The result of the calculation is very similar to the previous one. There is a division between the northern and western vs. the eastern and southern countries (Figure 3).
In this clustering, a smaller group of best performers (Finland, Germany, Luxembourg and the Netherlands) constitutes one cluster. The other northern and western countries plus Estonia form the cluster of good performers. Again, Estonia is the only central and eastern European country that belongs to the cluster of good performers. The distribution of eastern and southern countries between the clusters of moderate and weak performers is slightly different from the WGI-based classification. Latvia and Slovakia are absent from the group of moderate performers and appear among the weak performers, which consist of the southeastern European member states, Italy and Hungary. The difference of cluster means between best and good performers is smaller than between the good and moderate performers (Table 2). Thisfinding suggests a deeper divide between the north- ern and western vs. the eastern and southern countries than the WGI indicated.
To discover the changes over time the same method is used as in the case of the WGI, and the values of indicators are used, not the ranking of a country. In GCR, the values of indicators range from 1 to 7 in all cases. The investigated period must be reduced by one decade because the methodology has remained unchanged since 2008, and the list of indicators can be compared in these years. The general trend is similar to what the WGI shows, that is, that the clusters have become more homogenous and there has been no convergence among them (Figure 4).
The cluster of best performer countries seems to be fairly homogenous and stable with some volatility. The scores of good performers converged to 2013 and since then they have maintained roughly the same level. The cluster of moderate performer countries has exhibited convergence over the last decade because some of them were severely hit by the global crisis (Cyprus, Slovenia and Spain) and lost their favourable initial positions. The cluster of weak performers was the most homogenous group at the beginning of the crisis. The decrease in the scores for Croatia, Greece, Italy and Slovakia increased heterogeneity temporarily but eventually the cluster remained quite homo- genous. According to these indicators, Hungary shows permanent low governance quality but not such a decline as that in the WGI.7
The standard deviation among clusters’means increased over the last decade, and in 2012–2013, it caught up with the standard deviation of all of the countries’scores.
Conclusions
The message of the VoC literature from the 2000s was that there is not only one competitive model of capitalism which promotes economic development (e.g. Amable, 2003; Hall & Soskice, 2001; Sapir, 2006). In Europe, the Nordic model appeared to be a successful alternative to the neoliberal Anglo-Saxon model. The empirical
investigations based on pre-crisis data (Farkas,2011; Sapir,2006) have already indicated that the institutional setting of the Mediterranean model is not competitive. The institutional deficiencies of the Mediterranean countries remained hidden by a favourable period of economic growth and by an abundance of capital in international markets that coincided with the introduction of the euro and low interest rates. The 2008 global crisis revealed the vulnerability of these economies.
The analysis of institutional changes since the crisis exhibits remarkable phenomena in the EU. The institutional systems of the Anglo-Saxon, northwestern continental and Nordic countries are moving along the path of hybridisation. The CEE countries could survive the global crisis in better shape than the Mediterranean ones because they are Figure 3. Clusters of EU-28 based on selected government quality indicators of WEF Global Competitiveness Report, 2017–2018.
Source: Own calculation from the database of Schwab and Sala-i-Martin (2017).
better incorporated into global value chains. However, the Mediterranean and CEE countries share similar weaknesses in those areas (e.g. innovation systems, education systems and the competitiveness of domestic corporate sectors) which are crucial for long-term economic growth. Recently, deep institutional differences have ceased to exist between the old and new EU member states but emerged between the northern and western vs. the eastern and southern EU member states (Farkas, 2016). It is noteworthy that Próchniak et al. (2016) and Rapacki and Czerniak (2018) suggest similar division in their investigations of socio-economic systems in the EU.
This kind of division is especially pronounced in the difference of the quality of governance, which is one of the decisive factors in economic development. The two analyses of this paper, based on the WGI and WEF GCR databases, led to similar results in which either composite indicators were applied, after being collected from several information sources, or where simple indicators were applied, derived from the survey responses of business people. Both highlight the significant divisions between the northern and western vs. the eastern and southern EU member states.
Table 2.Description of the clusters based on selected government quality indicators of WEF Global Competitiveness Report, 2017–2018.
Good performer northern and wes-
tern countries
Weak performer eastern and south-
ern countries
Moderate performer eastern and southern
countries
Best performer northern and wes-
tern countries Total Number of
countries 8 8 8 4 28
Diversion of public funds
Mean 5.263 2.963 3.625 5.875 4.225
Std. Deviation 0.5097 0.3114 0.4713 0.4717 1.2149
Public trust in politicians
Mean 4.425 2.163 2.663 5.525 3.432
Std. Deviation 0.5922 0.2200 0.3292 0.2986 1.3174
Irregular payments and bribes
Mean 5.988 3.975 4.800 6.225 5.107
Std. Deviation 0.2532 0.2915 0.1604 0.5439 0.9490
Favouritism in decisions of government officials
Mean 4.438 2.263 2.925 5.250 3.500
Std. Deviation 0.5263 0.3068 0.2964 0.3512 1.1826
Efficiency of government spending
Mean 3.600 2.400 3.200 5.025 3.346
Std. Deviation 0.5182 0.4000 0.4536 0.2630 0.9383
Burden of government regulation
Mean 3.638 2.538 3.075 4.550 3.293
Std. Deviation 0.5317 0.4809 0.4773 0.2380 0.8069
Efficiency of legal framework in settling disputes
Mean 4.775 2.600 3.263 5.550 3.832
Std. Deviation 0.5701 0.5182 0.3623 0.3109 1.2022
Efficiency of legal framework in challenging regulations
Mean 4.325 2.388 3.013 5.300 3.536
Std. Deviation 0.3370 0.2997 0.4998 0.2160 1.1136
Transparency of government policymaking
Mean 5.088 3.350 4.088 5.800 4.407
Std. Deviation 0.4257 0.2673 0.4549 0.2160 0.9541
Source: Own calculation from the database of Schwab and Sala-i-Martin (2017).
These results suggest that no direct relationship can be revealed between the quality of governance and the models of capitalism. The dual classification (liberal versus coordinated market economy) has no relevance. We can say that the Nordic, Anglo- Saxon and northwestern continental models are characterised by better quality of governance and the Mediterranean and central and eastern European by poorer quality.
However, the clusters within the basic division do not cover these models, neither in the case of northern and western groups nor in the case of eastern and southern ones. For example, the best performers of GCR, Finland, Germany, the Netherlands and Sweden include countries of both the Nordic and continental models. The division indicates, instead, a core vs. periphery relation in the EU. The distribution of the northern and western countries in the two cluster analyses does not exhibit a characteristic trend. The separation of the southeastern European countries, as with Italy and Hungary, in both clusters is more remarkable. Further investigation is required to determine the factors causing the poor performance beyond the‘Balkan effect’, especially in the case of Italy and Hungary, where the historical legacy is not as burdensome as that of the Balkans.
Perceptions of the achievement of northern and western governments have been fairly stable over the last two decades. The preparation for accession and EU member- ship promoted the improvement of governance quality. With the exception of Estonia, this improvement was substantial in the cases where the initial scores of governance quality were very low (Bulgaria, Croatia, Latvia, Lithuania, Romania and Slovakia). In the Czech Republic, Poland and Slovenia the changes were meagre, and in Hungary, the improvement has reversed. The GCR provides a slightly different picture of the investi- gated shorter period. Business people noticed more improvement in the Czech Republic and Poland and less improvement in the other countries listed above. Overall, EU membership gave impetus to the development of governance quality, the results of which could stabilise, but a substantial gap compared to core countries remained. It is noteworthy that the Baltic States, Bulgaria and Romania maintained the improvement of Figure 4. Standard deviation of selected government quality indicators of WEF Global Competitiveness Reports among and within the clusters of EU-28, 2008–2018.
Source: Own calculation from WEF Global Competitiveness Reports (Schwab & Porter,2008; Schwab & Sala-i-Martin, 2009,2010,2011,2012,2013,2014,2015,2016,2017).
governance quality despite the very serious recession caused by the 2008 global crisis, similar to Ireland.
This was not the case in the Mediterranean countries. In the small countries, as in Cyprus and Malta, an improving trend has reversed since the crisis. The previous stable position of Greece, Portugal and Spain has worsened since the crisis, and in the case of Greece, it worsened dramatically. Italy already experienced a downturn in 2004 and a rapid and continuous deterioration ever since.
Even if prejudices and stereotypes can bias the perception of actors whose opinion is considered in surveys and polls, the results are instructive for European policy formation and multilevel governance. Both databases suggest not only a division between the northern and western (core) vs. the eastern and southern (periphery) countries within the EU, but that convergence has come to a halt, especially since the crisis. Simultaneously, clusters have become more homogenous.
As mentioned in the introduction, the European Commission’s Cohesion Report describes the weak quality of governance as a severe obstacle in the utilisation of EU support. However, the difference in governance quality imposes persistent con- straints on the deepening of integration and the efficiency of multilevel governance.
If the same regulation is implemented by governments of varied quality, then the impacts and results will be different. For example, the differences in the changes of governance quality were conspicuous in the management of the crisis, despite the similar austerity packages of creditor organisations (EU and IMF) in some eastern and southern countries.
This insight seems to be missing from current reform concepts, which focus on political will and willingness. The discussion on the future of the EU is based on the scenarios offered by the European Commission, which differ from one another in terms of how deep the integration would be (EC, 2017b, 2017c). Whether it is the experts or politicians who argue, they speak as if the choice among scenarios were a matter of political will. The Commission paper introduces the scenario of multi- speed integration: ‘In a scenario where the EU27 proceeds as today but where certain Member States want to do more in common, one or several “coalitions of the willing” emerge to work together in specific policy areas’ (EC,2017c, p. 20). The empirical findings described in this paper suggest that the differences in governance quality have at least as much importance as political will for the reform capacity of the EU.
Notes
1. After their radical restructuring, the market economies of the post-socialist CEE countries, which are now EU members, stabilised by 1995. Between 1995 and 2008 all of them converged to the old member states, that is, to the EU-15 by the following percentage points: Czech Republic 10, Bulgaria 11, Hungary and Poland 13, Slovenia 16, Croatia 18, Romania 20, Slovakia 23, Latvia 27, Lithuania 28 and Estonia 32. Data are calculated using the AMECO database, retrieved from http://ec.europa.eu/economy_finance/ameco/user/
serie/SelectSerie.cfm(accessed July 2018).
2. See Eurostat online database, retrieved from http://ec.europa.eu/eurostat/data/database (accessed January 2018).
3. Privatisation, the release of private initiatives, market liberalisation, the change of obsolete technologies of the communist era via FDI inflows, the quick redirection of trade relations from the Soviet Union to the developed western countries, the introduction of the institu- tions of market economies (commercial banks, stock exchanges, etc.) and legal regulations conforming to markets triggered substantial productivity increases. These structural and institutional changes were one-offevents and their positive impact on productivity is built in the baseline data of the next period.
4. For a more detailed literature review, see Rodríguez-Pose (2013).
5. Hierarchical cluster analysis is an algorithm that groups similar objects into clusters. The endpoint is a set of clusters, where each cluster is distinct from each other cluster, and the objects within each cluster are broadly similar to each other. The main output of hierarchical clustering is a dendrogram, which shows the hierarchical relationship between the clusters.
Ward’s method uses minimum variance criterion to minimise the total within-cluster var- iance in order tofind relatively homogenous groups.
6. For detailed data, see Online Appendix.
7. For detailed data, see Online Appendix.
Disclosure statement
No potential conflict of interest was reported by the author.
Funding
This research was supported by the project nr. EFOP-3.6.2-16-2017-00007, titled Aspects on the development of intelligent, sustainable and inclusive society: social, technological, innovation networks in employment and digital economy. The project has been supported by the European Union, co-financed by the European Social Fund and the budget of Hungary.
References
Acemoglu, D., & Robinson, J. (2008). The role of institutions in growth and development.
(Commission on Growth and Development Working Paper No. 10). Washington, DC: The World Bank.
Amable, B. (2003).The diversity of modern capitalism. Oxford: Oxford University Press.
Blagojević, S., & Damijan, J. P. (2013). The impact of corruption and ownership on the performance offirms in central and Eastern Europe.Post-Communist Economies,25(2), 133–158.
Bohle, D., & Greskovits, B. (2012).Capitalist diversity on Europe’s periphery. Ithaca: Cornell University Press.
Boyer, R. (2005). How and why capitalisms differ.Economy and Society,34(4), 509–557.
Coates, D. (2000).Models of capitalism. Cambridge: Polity Press.
Doh, S. (2014). Social capital, economic development, and the quality of government: How interaction between social capital and economic development affects the quality of government.Public Administration,92(1), 104–124.
Ebbinghaus, B. (1999). Does a European social model exist and can it survive? In G. Huemer, M. Mesch, & F. Traxler (Eds.), The role of employer associations and labour unions in the EMU.
institutional requirements for European economic policies(pp. 1–26). Aldershot: Ashgate.
European Commission. (2017a).My region, my Europe, our future. Seventh report on economic, social and territorial cohesion. Brussels: European Union. Retrieved October, 2017, from http://ec.
europa.eu/regional_policy/sources/docoffic/official/reports/cohesion7/7cr.pdf
European Commission. (2017b).Reflection paper on the deepening of the economic and monetary union. (COM(2017) 291). Brussels: Author, Retrieved July, 2017, fromhttps://ec.europa.eu/com mission/sites/beta-political/files/reflection-paper-emu_en.pdf
European Commission. (2017c).White paper on the future of Europe. (COM(2017)2025). Brussels:
Author. Retrieved July, 2017, from https://ec.europa.eu/commission/sites/beta-political/files/
white_paper_on_the_future_of_europe_en.pdf
Farkas, B. (2011). The central and Eastern European model of capitalism. Post-Communist Economies,23(1), 15–34.
Farkas, B. (2016).Models of capitalism in the European Union. London: Palgrave Macmillan.
Galgóczi, B., & Drahokoupil, J. (Eds.). (2017).Condemned to be left behind? can central and Eastern Europe emerge from its low-wage model?Brussels: European Trade Union Institute.
Glaeser, E., La Porta, R., Lopez-de-Silanes, F., & Schleifer, A. (2004). Do institutions cause growth?
Journal of Economic Growth,9, 271–303.
Hall, P. A. (2018). Varieties of capitalism in light of the euro crisis.Journal of European Public Policy, 25(1), 7–30.
Hall, P. A., & Soskice, D. (Eds.). (2001). Varieties of capitalism: The institutional foundations of comparative advantage. Oxford: Oxford University Press.
Hall, R. E., & Jones, C. I. (1999). Why do some countries produce much more output per worker than others?Quarterly Journal of Economics,114(1), 83–116.
Hancké, B., Rhodes, M., & Thatcher, M. (2007). Introduction: Beyond varieties of capitalism. In B. Hancké, M. Rhodes, & M. Thatcher (Eds.), Beyond varieties of capitalism. Conflicts, contra- dictions, and complementarities in the European economy(pp. 3–38). Oxford: Oxford University Press.
Kaufmann, D., Kraay, A., & Mastruzzi, M. (2010). The worldwide governance indicators.
Methodology and analytical issues. (Policy Research WP Series No. 5430). Washington, DC:
The World Bank.
Kaufmann, D., Kraay, A., & Zoido-Lobatón, P. (1999).Governance matters. (Policy Research Working Paper No. 2196). Washington, DC: The World Bank.
Knack, S., & Keefer, P. (1995). Institutions and economic performance: Cross-country tests using alternative institutional measures.Economics and Politics,7(3), 207–227.
La Porta, R., Lopez-de-Silanes, F., Schleifer, A., & Vishny, R. (1999). The quality of government.The Journal of Law, Economics and Organization,15, 222–279.
Nölke, A., & Vliegenthart, A. (2009). Enlarging the varieties of capitalism. The emergence of dependent market economies in East Central Europe.World Politics,61(4), 670–702.
Piątek, D., Szarzec, K., & Pilc, M. (2013). Economic freedom, democracy and economic growth:
A causal investigation in transition countries.Post-Communist Economies,25(3), 267–288.
Próchniak, M., Rapacki, R., Gardawski, J., Czerniak, A., Horbaczewska, B., Karbowski, A., . . . Towalski, R. (2016). The emerging models of capitalism in CEE11 countries – A tentative comparison with Western Europe.Warsaw Forum of Economic Sociology,7(2), 7–70.
Rapacki, R., & Czerniak, A. (2018, March 15). Emerging models of patchwork capitalism in CEE11 countries–Empirical results of subspace clustering.Paper presented at the Conference Diversity of Patchwork Capitalism in Central and Eastern Europe – Institutional Perspectives. Warsaw: SGH Warsaw School of Economics.
Rodríguez-Pose, A. (2013). Do institutions matter for regional development?Regional Studies,47(7), 1034–1047.
Rodríguez-Pose, A., & Di Cataldo, M. (2015). Quality of government and innovative performance in the regions of Europe.Journal of Economic Geography,15, 673–706.
Rodríguez-Pose, A., ., & Garcilazo, E. (2015). Quality of government and the returns of investment:
Examining the impact of cohesion expenditure in European regions. Regional Studies, 49(8), 1274–1290.
Rothstein, B., & Teorell, J. (2008). What is quality of government? A theory of impartial government institutions.Governance: an International Journal of Policy, Administration, and Institutions,21(2), 165–190.
Sapir, A. (2006). Globalization and the reform of European social models. Journal of Common Market Studies,44(2), 369–390.
Schmidt, V. A. (2002).The futures of European capitalism. Oxford: Oxford University Press.
Schröder, M. (2013).Integrating varieties of capitalism and welfare state research: A unified typology of capitalisms. Basingstoke–New York: Palgrave Macmillan.
Schwab, K., & Porter, M. (2008). The global competitiveness report 2008–2009. Geneva: World Economic Forum.
Schwab, K., & Sala-i-Martin, X. (2009).The global competitiveness report 2009–2010. Geneva: World Economic Forum.
Schwab, K., & Sala-i-Martin, X. (2010).The global competitiveness report 2010–2011. Geneva: World Economic Forum.
Schwab, K., & Sala-i-Martin, X. (2011).The global competitiveness report 2011–2012. Geneva: World Economic Forum.
Schwab, K., & Sala-i-Martin, X. (2012).The global competitiveness report 2012–2013. Geneva: World Economic Forum.
Schwab, K., & Sala-i-Martin, X. (2013).The global competitiveness report 2013–2014. Geneva: World Economic Forum.
Schwab, K., & Sala-i-Martin, X. (2014).The global competitiveness report 2014–2015. Geneva: World Economic Forum.
Schwab, K., & Sala-i-Martin, X. (2015).The global competitiveness report 2015–2016. Geneva: World Economic Forum.
Schwab, K., & Sala-i-Martin, X. (2016).The global competitiveness report 2016–2017. Geneva: World Economic Forum.
Schwab, K., & Sala-i-Martin, X. (2017).The global competitiveness report 2017–2018. Geneva: World Economic Forum.
Smith, A. (1776/1979).An inquiry into the nature and causes of the wealth of nations. Oxford: Oxford University Press.
Soskice, D. (2007). Macroeconomics and varieties of capitalism. In B. Hancké, M. Rhodes, &
M. Thatcher (Eds.),Beyond varieties of capitalism. conflicts, contradictions, and complementarities in the European economy(pp. 89–121). Oxford: Oxford University Press.
Tabellini, G. (2005).Culture and institutions: Economic development in the regions of Europe. (CESifo Working Paper No. 1492). Munich: CESifo Group.