50 Years of Real Convergence – Without Extractives Dependency and Tax Havens
Róbert Csoma
Budapest Business School Csoma.Robert@uni-bge.hu
Summary
In the world economy real convergence cannot be detected in the long term and lack of convergence is discussed in this article. The analysis is based on results and debates of economic growth theory and development studies. Special focus is placed on extractives dependent and tax haven countries and the article concludes that these countries considerably contribute to the partial real convergence process, limited only to some regions of the world economy. This paper also studies some common criteria of the catching-up process of emerging countries to developed economies. It concludes that although the factors of catching-up can be very unique in countries at different levels of development, yet there are some factors without which catching-up is hardly feasible nowadays in any country.
keywords: real convergence, extractives dependency, tax havens JEl codes: o47, P52, Q32
DoI: https://doi.org/10.35551/PFQ_2021_4_3
E
Economic catching-up or convergence is a process with many components, including nominal, real, social, cyclical and structural convergence. This article primarily analyses real convergence, perhaps the most important type of convergence over the last few decades, which of course interacts with other types of convergence. The approach is essentially long-term and empirical, also touching on connections with both formal growth theories and less formal development studies.Growth theories and converGence
The most famous view of neoclassical growth theory is expressed in Solow’s (1956) model.
Here technology determines the efficiency of production exogenously. Differences in the growth rates of countries are due to differences in their capital stock. The model assumes a high return on investment in capital-poor countries and a lower return in developed countries due to decreasing returns to scale.
This stimulates capital flows from rich to poor countries, thus accelerating their catching-up.
Subsequent theories have made technological progress from capital stock accumulation endogenous. For instance, Lucas (1988) included investment in human capital in his model, and according to Romer’s (1986) model, a country can develop better if it spends more on innovation.
It follows logically from the endogenous models that economic policy interventions can be used to increase productivity and foster innovation, thus providing opportunities for convergence in the less developed countries.
The third group of growth models explains the differences in development between countries by differences in their institutions.
This trend goes back all the way to the work of North (1990), who considered stable property rights as a crucial factor for the efficiency of productive investment and the achievement
of economic outcomes. according to this line of thinking, economies will prosper if their institutions support innovation, the accumulation of factors of production and the efficient allocation of resources.
In contrast to neoclassical theory, endogenous growth theories therefore do not assume a decline in economies of scale but, on the contrary, they assume a constant or increasing marginal product of capital, therefore developed countries can grow faster than the developing countries, with catching up always being conditional.
If there were no additional conditions for catching up other than a decreasing scale factor, it would create absolute/unconditional beta convergence. If country-specific factors (e.g. education, investment, government expenditure as a share of GDP, the ratio of foreign trade to GDP, etc.) are included in the model, and the catching-up of poorer countries can be shown, then we can speak of relative/
conditional beta convergence. The growth rate of GDP per capita is negatively correlated with the initial level of income per capita when convergence is achieved. according to the sigma convergence measure, the countries concerned converge with decreasing dispersion of real GDP per capita. In practice, within conditional convergence, club convergence is also distinguished (Baumol, 1986), where countries converge to their group-specific growth paths. according to this interpretation of convergence, only groups of countries with adequate human capital and similar well- functioning institutions can achieve economic growth that also leads to convergence.
Growth performance in the world economy in recent decades
This article draws on World Bank and Penn World tables databases for empirical analysis,
which allow us to look back over a long period of time, five decades, and draw conclusions about the growth trends experienced. although not for the world economy as a whole, but for the developed countries, simple analytical methods show fairly stable correlations in the databases.
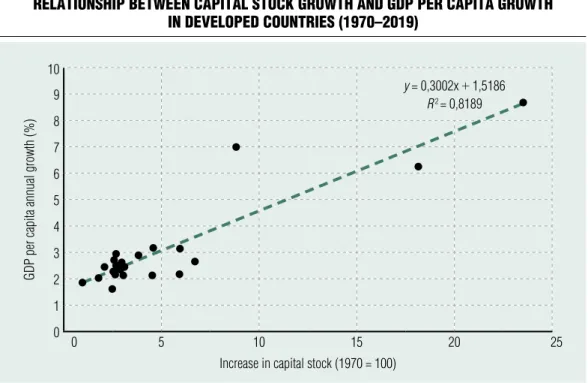
Both capital stock and export growth in countries now considered developed show a close relationship with GDP per capita growth, as illustrated in Figures 1 and 2.
In addition to this close relationship, the outperformance of 3 countries is noteworthy: Singapore, Thailand and Ireland have multiplied their wealth in recent decades, therefore it is worth making some further observations about their individual development paths in the following sections of this article.
In his work on economic history, which is considerably longer than the time span of this article, Maddison (2001) shows that GDP per capita in the uS has been substantially higher than in other major economies since the end of the 19th century, with an annual growth rate of around 2 per cent, which has ensured uS leadership in the world economy.
Beyond the increase in the capital stock and exports, there are of course other factors for economic catching-up (such as an acceptable level of public debt). Sorting these factors into some general model is beyond the scope of this article, which concentrates on two factors that affect real convergence and are less frequently studied in this context.
real converGence in detail
The relationships outlined above form the basis of our views on economic growth and competitiveness, but do not in themselves explain whether there is convergence in economic development across countries. The
presence or absence of real convergence is most often analysed in terms of real GDP per capita at purchasing power parity (and its change).
This indicator provides a good measure of the wealth of each country. However, it is generally not a good measure of prosperity and quality of life, as it does not measure, for example, income differences within countries, the state of the environment, the extent of corruption and crime, institutional differences, etc.
For the world economy as a whole, researchers are strongly divided on the extent to which real convergence is taking place. one dominant view is that the countries follow their own long-term growth paths and that there is no real convergence between them. But there is a place for activist economic policies, to reduce structural heterogeneity between countries. (Dufrénot, Sanon, 2014). a similar view is taken by Johnson and Papageorgiou (2020), who argue that the developing countries have collectively failed to converge and catch up with the developed countries over the long run.
Patel et al. (2021), on the other hand, argue that a period of weak, unconditional convergence in the world economy started again from 1990, the beta coefficient changed sign, and the divergent processes of the earlier period turned into convergence. The reason, they argue, was rapid growth in the developing countries and slow growth in the developed countries. They also argue that the ‘middle- income trap’ condition often mentioned in development studies does not exist, with the middle-income countries growing faster than the poor countries over the period of their study.
using the ‘Penn World tables’ database, which is often used for international comparisons, I also examined real convergence over the last fifty years. Data were available for 158 countries for the period 1970–2019.
(The omitted countries include the successor
Figure 2 Relationship between expoRt gRowth and annual peR capita gdp gRowth
in developed countRies (1970–2019) 10
Gdp per capita annual growth (%)
8
y = 0,078x + 1,629 R 2 = 0,9025
6
4
2
00 10 20 30 40 50 60 70 80 90
increase in export volume (1970 = 100) Source: world Bank development indicators
Figure 1 Relationship between capital stock gRowth and gdp peR capita gRowth
in developed countRies (1970–2019) 10
Gdp per capita annual growth (%)
9 y = 0,3002x + 1,5186
R 2 = 0,8189 8
7 6 5 4 3 2 1
00 5 10 15 20 25
increase in capital stock (1970 = 100) Source: world Bank development indicators
states of the Soviet union and yugoslavia, and in Central and Eastern Europe the Czech Republic and Slovakia, whose data are only available in this database from 1990 onwards.) on this basis, Figure 3 shows that there is no real convergence, and the initial level of GDP per capita does not explain its annual growth rate in the world economy as a whole. (For a clearer graphical representation, the logarithm of the 1970 GDP levels is shown on the horizontal axis.)
shorter periods of real
converGence and some economic policy lessons
Despite the fact that real convergence in the world economy as a whole cannot be shown in the long term, it is worth presenting shorter
periods of convergence in a nutshell, based on the research of others, because the temporal and spatial delineations provide an opportunity to identify some convergence patterns and also to draw conclusions about the role of the state in supporting economic growth.
Between 1950 and 1970, developed countries converged to each other and toward the uS. The first oil crisis halted this process and there was no significant convergence until the late 1990s. Thereafter, divergence was observed, with the uS growing faster than the oECD average. In the uS, convergence was also observed at the level of individual member states until 1980, after which the convergence process between the member states stagnated, with neither convergence nor divergence (kauryha, Valdivieso, 2015).
as a reason for the lack of real convergence in the world economy, researchers also point to the
Figure 3 lack of Real conveRgence in the woRld economy (1970–2019)
8
Gdp per capita annual growth rate 1970-2019 (%)
6
y = –0,0033x + 0,0493 R 2 = 0,0406
4 2 0 –2 –4 –6
–86 7 8 9 10 11 12 13
ln Gdp per capita (1970) Source: penn world tables
Beta convergence 1970-2019
fact that the accumulation of macroeconomic imbalances before the 2007–2009 crisis, such as private and public sector debt and rapid growth in the non-tradable sector, slowed down the convergence processes, especially in the Eurozone (Coutinho, turrini, 2020).
While there was nominal convergence in the inflation and interest rates among the Eurozone founding members, there was no real convergence in the per capita income levels, and divergence was observed after the 2007–
2009 crisis. Business cycles have become more synchronised across countries, but the amplitude of the cycles is diverging (Franks et al., 2018).
In Europe, the Eu member countries have converged at approximately the same growth rate as the non-Eu countries since 1950, therefore Eu membership does not imply automatic convergence. nor has Eurozone membership brought a different convergence path for the countries concerned, so a common currency is not a sufficient condition for real convergence (Rama, 2019; Gál, 2015; Pelle, Végh, 2019).
Since 2011, the Eurozone’s GDP per capita growth has lagged behind that of the uS and even Japan, which has generally experienced moderate GDP growth rates due to its declining population. However, there are large differences between Eurozone member States in this respect. Germany is growing even faster than these two countries, but the southern member States are underperforming. There has been no convergence over the last decade or more among the early adopters of the euro, and there is even talk of Greece and Italy breaking away (del Hoyo et al., 2017).
The Eu member States in Central and Eastern Europe, on the other hand, achieved real convergence in the 2000s relative to the development of the Eurozone member States, regardless of whether they adopted the euro or not. of these, the Baltic member States, Romania and Slovakia have achieved the highest levels of convergence. Between 2000 and 2007,
the period before and immediately after the major enlargement of the Eu, these countries converged fastest towards the Eu average. This shows that the process of economic integration stimulated convergence, while the economic crisis of 2007–2009 slowed down their catching-up (matkowski et al., 2016). However, looking at the regions within the countries, Bulgaria, Poland, Romania, Slovakia, the Czech Republic and Hungary all show a pattern of strong β-divergence. according to Alcidi et al (2019), capital regions (regions with above- average capital intensity, typically metropolitan agglomerations) show outstanding values, while the relative position of the regions with still below-average income performance in 2000 has continued to deteriorate.
In parallel with the situation experienced in the developed countries, the catching-up of the developing countries has also slowed down. The exceptions include China and the countries of South-East asia, where the catching-up process is ongoing.
Based on the above, and in the light of the facts for shorter time horizons, it is clear that there is no evidence of absolute convergence at the level of the world economy. Conditional convergence, on the other hand, can be defined in terms of space and time. Growth is an idiosyncratic phenomenon, resulting in different outputs of economic performance, and not necessarily leading to convergence.
For some countries it causes a growth disaster (divergence even from a low initial level), for others it can lead to low growth and rapid convergence (Dufrenot et al., 2009).
which countries could or should Be cauGht up with?
time series analysis of convergence processes is the subject of much research. a number of studies also look at the time it takes for a poorer
country to catch up with a richer one. But less often do researchers ask which countries could a country with a given economic structure realistically catch up to, and whether it is worth catching up to them at all?
Table 1 shows the 10 richest countries in the world in terms of GDP per capita in 1970 and 2019.
It is striking that in 2019 the top 10 only includes resource-rich countries and even more so some countries known as tax havens. For the poorer countries, the first type of wealth is unattainable without changing the national borders, while the second type of catching-up is a feasible option in some cases, but certainly not desirable for the world economy as a whole. It is therefore also worth examining the convergence process from the point of view of the trends that would have prevailed over the last five decades without these two types of wealth, i.e. whether there is any catching-up among the countries with a ‘normal’ economic structure that represent a majority.
The difficulty with addressing resource wealth for analytical purposes is that, in addition to the many countries that have built their wealth around their raw material resources, there are also some countries that have a diversified economic structure in addition to sectors based on extractive industries (e.g. norway, uSa, australia, etc.). Therefore, treating all the resource-rich countries together would be unjustified in an analysis that seeks to understand the different potential paths of convergence. It would seem fortunate to use a method based on indexation that disallows the lumping together of countries that are rich in raw materials but otherwise have very different economic structures.
Such a method was developed, for example, by Hailu and Kipgen (2015), which uses 3 components to create the ‘Extraction Dependence Index’ (EDI), which is suitable to validate this aspect.
Its components are:
Table 1 Ranking of countRies by gdp peR capita
1970 2019
1 united arab emirates luxembourg
2 Brunei macau
3 Qatar Qatar
4 Kuwait ireland
5 cayman islands singapore
6 switzerland Bermuda
7 luxembourg switzerland
8 united states of america cayman islands
9 Bermuda united arab emirates
10 sweden Brunei
Source: penn world tables
value of raw material exports in total exports
a higher share of raw material exports causes higher volatility in export earnings and economic growth rates, so economies with a high component value have high extraction dependence.
share of budget revenue from raw material extraction
Volatility in raw material prices can strongly change the country’s budget position. When prices rise, some countries build up income reserves, and others finance government spending. However, in the event of a fall in prices, the inability to finance budgetary spending obligations could lead to a financial crisis.
value added to raw materials
The added value that a country adds to its extracted raw materials is important for the diversification of economic activities.
Whichever adds more, it depends less on its own resources.
using these three indicators, the authors rated each country’s extraction dependence on a scale of 100. on this basis, the 26 countries that scored above 50 on the scale were considered highly extraction dependent.1 The scale allowed the exclusion of countries that have a diversified economic structure in addition to sectors based on the extraction of their raw materials.
a paradoxical situation, often analysed in relation to extraction dependency, can arise, which is also known as the ‘resource curse’.
The majority of resource-rich countries cannot take advantage of their favourable starting position and are unable to create overall prosperity for their citizens. The exceptions to this are usually only 4 countries: Canada, Chile, norway and Botswana.2
according to the World Bank’s World Development Indicators database, 20 countries in the list of extraction dependent
countries for which GDP per capita data at purchasing power parity are available for the period 1990–2019 have achieved an average annual GDP per capita growth of only 0.3 percent, compared to a world average of about 1.6 percent.
tax havens do not have a uniformly accepted definition, but low corporate tax rates are certainly one of their characteristics.
They also provide secrecy for the owners of the capital that flows there, which is why the term offshore financial centre has become common.
While the offshore activities of their companies represent a major drain on the budgets of many developed countries, a number of the developed countries themselves are prominent targets for offshore activities. For example, in the 1970s and 1980s, alongside the inflow of capital in the form of loans to many indebted, capital-poor, middle-income or peripheral countries, there was also a large outflow of capital from these countries to offshore centres linked to developed countries (Vargha, 2017).
The Hines list3 (2010) identifies 52 countries as tax havens, to which more recent research (Boffey, 2017; millar, 2017; Buchanan 2017) has added 3 more developed countries. Thus, not only small (often island) countries with mostly good administrations that provide a safe environment for investment (Dharmapala, Hines, 2006) can become tax havens, but also large economies, as is the trend today.
nearly 40 percent of corporate investments that go to tax havens also ‘travel’ through the united kingdom or the netherlands. The united kingdom is the second largest offshore financial centre and Switzerland also plays a bigger role in the flow of money to other tax havens than previously thought.
of the tax haven countries, GDP per capita data at purchasing power parity are available for 29 countries for the period 1990–2019.
This shows that tax haven enrichment was around 1.9 percent per year over this period,
faster than the world average. as these include a number of advanced and upper middle- income countries, the growing importance of tax havens is also hampering the convergence processes.
converGence of countries with a ‘normal’ economic structure
In the world economy as a whole, no real convergence can be observed among the countries with what can be described as a diversified economic structure. However, it is worth looking at the convergence processes at the level of smaller geographical units since, despite the undoubted global virtualisation of the economy, geographical distance remains a significant factor in the intensity of economic relations. If we look at real convergence by continent, we find convergence in Europe and asia, with the latter even including a specific (pseudo)convergence.
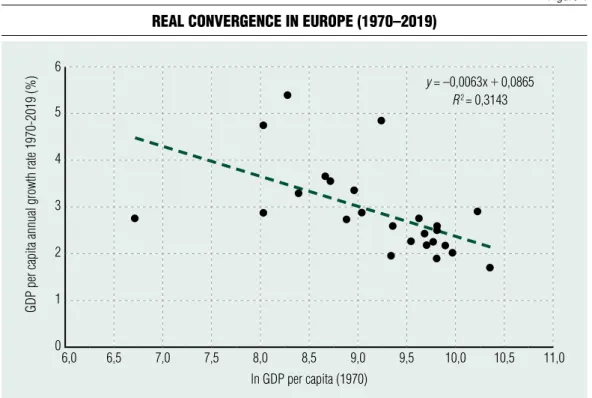
For Europe, apart from the absence of countries heavily dependent on extractive industries, some real convergence can be observed even with the countries that can be considered tax havens, as shown in Figure 4.
However, the degree of correlation between the initial GDP per capita and the long-term annual growth rate of a country increases significantly when some tax haven countries are removed from the analysis, as shown in Figure 5. one could argue that, if it were not for the deviating force of tax havens from normal growth, a medium-strong long-term real convergence could be observed across the continent.
For other continents, however, no stable real convergence can be observed when controlling the model for extraction dependence and tax havens. [a very weak relationship (R2 = approximately 20 percent) can be detected in the americas, but not at all in africa.] In asia,
on the other hand, we find a peculiar inverse convergence, with extraction dependent and tax haven countries converging more closely on the basis of the beta convergence indicator in Figure 7 than all the countries studied on the continent in Figure 6.
Because of their oil wealth, many middle Eastern countries were considered rich countries in terms of GDP per capita 50 years ago, while the countries of the Far East were largely poor. Since then, however, the countries of the middle East have in many respects been left out of the globalisation process, with their economies dominated by state and military enterprises and reliance on oil revenues. They also have intensive relations with the Far East, mainly as oil exporters. The countries of the Far East, on the other hand, have made significant economic progress by becoming diversely integrated into the world economy. Thus, the Far East cannot be said to have caught up with the economies of the middle East, and indeed the growth characteristics of the two regions have developed largely independently of each other. This also highlights the fact that a formal calculation of real convergence could be misleading to researchers as to the actual causal links, and that a more reliable assessment of convergence can be hoped for when analysed together with other types of convergence.
The typical East asian model was based on the developing state building an export-led manufacturing industry. There has also been a diffusion of the export-oriented model in the Far East from Japan, taiwan, South korea, Hong kong and Singapore towards malaysia, Thailand, China, Indonesia and Vietnam. The already not too slow growth of the countries also moving into tax haven status (Singapore, taiwan, Hong kong, macao) has been accelerated by this privileged position, and it is one of the reasons why, formally, the Far East countries show considerable real convergence
Figure 4 Real conveRgence in euRope (1970–2019)
Gdp per capita annual growth rate 1970-2019 (%)
6
5
y = –0,0063x + 0,0865 R 2 = 0,3143
4
3
2
1
6,00 6,5 7,0 7,5 8,0 8,5 9,0 9,5 10,0 10,5 11,0
ln Gdp per capita (1970) Source: penn world tables
Figure 5 Real conveRgence in euRope without tax havens (1970–2019)
Gdp per capita annual growth rate 1970-2019 (%)
6
4
y = –0,0094x + 0,114 R 2 = 0,687
2
0 8,0 8,5 9,0 9,5 10,0 10,5
ln Gdp per capita (1970) Source: penn world tables
Figure 6 Real conveRgence in asia (1970–2019)
7
Gdp per capita annual growth rate 1970-2019 (%)
6 y = –0,0093x + 0,1067
R 2 = 0,4497 5
4 3 2 1 0 –1 –2 –3
–46 7 8 9 10 11 12 13
ln Gdp per capita (1970) Source: penn world tables
Figure 7 Real conveRgence in asia among extRaction dependent
and tax haven countRies (1970-2019) 7
Gdp per capita annual growth rate 1970-2019 (%)
6 y = –0,0128x + 0,1423
R 2 = 0,5933 5
4 3 2 1 0 –1 –2 –3
–4 6 7 8 9 10 11 12 13
ln Gdp per capita (1970) Source: penn world tables
when examined together with the middle East, while structurally there is no significant convergence between the two regions.
social converGence
GDP per capita is not an indicator of the extent of income inequality within countries, therefore it is worth including some indicators that allow comparisons of the convergence processes also in this respect.
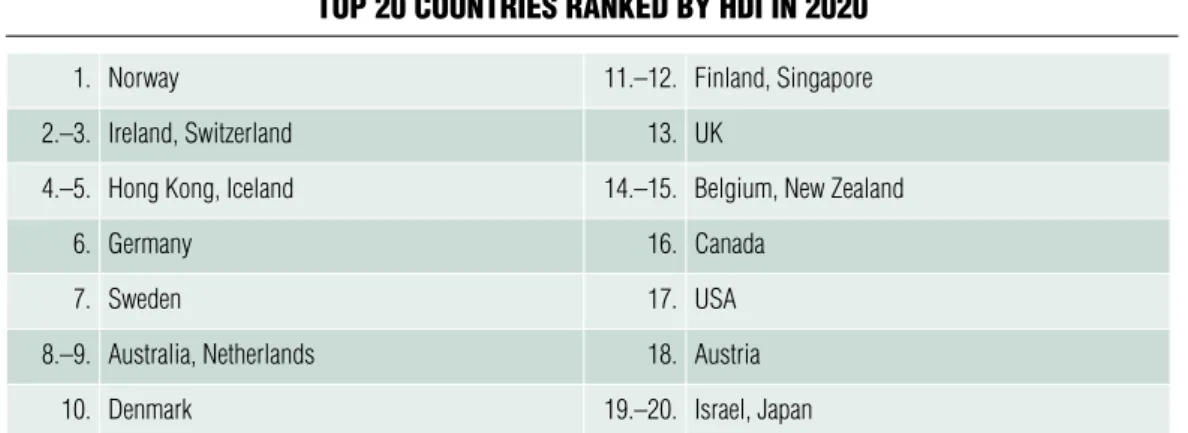
The World Bank’s Human Development Index (HDI) in Table 2 provides a suitable and complex way of illustrating the impact of economic development on quality of life. The basic version of the HDI ranks the countries according to life expectancy, years of schooling and GDP per capita, while the extended version takes income inequality into account too.
However, if we look at the inequality- adjusted Human Development Index, Hong kong, Singapore and the uS are ranked more than 10 places lower, indicating the higher population income dispersion of these countries (essentially all countries in the Far East).
looking at the dynamics of human development, it is worth noting that over the long term, from 1990 to 2019, the average annual increase in HDI was higher than 0.7%
in the following countries: Singapore, Ireland, South korea, Thailand, united arab Emirates, Croatia, malaysia, mauritius and turkey.
Indeed, a good number of these countries have also been able to use their tax haven status for human development.
lessons learned from the practices of countries with spectacular achievements
Ireland has successfully tapped into a key sector for the coming decades by attracting largely american computer companies to the country. much of Ireland’s R&D has also been linked to the activities of uS companies. It has been mainly through tax incentives and the designation of a free trade area, as well as through workforce training and infrastructure development, that domestic companies have been encouraged to do business with foreign companies. as a result, they were sometimes able to achieve double-digit economic growth
Table 2 top 20 countRies Ranked by hdi in 2020
1. norway 11.–12. finland, singapore
2.–3. ireland, switzerland 13. uK
4.–5. hong Kong, iceland 14.–15. Belgium, new Zealand
6. Germany 16. canada
7. sweden 17. usa
8.–9. australia, netherlands 18. austria
10. denmark 19.–20. israel, Japan
Source: united nations development programme: human development report 2020
rates in the 1990s. There is also no doubt that the development path based on uS capital also created a one-sided dependence on the uS economy, which was felt during the 2007–2009 global economic crisis, but the economy recovered quickly after the crisis years (Breznits, 2011).
Singapore has followed a different path, and its successes are enhanced by the fact that they have been achieved from a rather backward and peripheral position, without hydrocarbon and raw material resources, and with a small domestic labour force and a small domestic market.
at the beginning of this rapid development process, in the 1960s, state-owned companies were created to promote industrialisation. In addition to restrictions on foreign capital and imports, the population was encouraged to save through high interest rates on deposits in order to finance development from domestic sources. Firms were organised into conglomerates and entered the world market in the 1970s and 1980s financed by soft loans from the banks within the group (kumar, Siddique, 2010).
However, with the acceleration of globalisation, Singapore, like other Far Eastern countries pursuing similar development policies based on domestic resources, was not spared the asian financial crisis of ‘97.
Reforms to adapt the country to globalised markets have made it competitive again. The role of state-owned groups has been reduced and the country has become more open, allowing foreign investor to enter the domestic market. Corruption has been successfully tackled, and Singapore now has one of the lowest corruption indices in the world, with no rent-seeking behaviour.
Education has been a priority sector all along to ensure success. as in other East asian countries, society is organised on a meritocratic basis. moreover, social norms and
consensus on development directions have been critical to its spectacular progress (tan, Bhaskaran, 2018).
Thailand is less often discussed as a country that has also achieved significant wealth.
The country is open to foreign investment and development is supported by advanced infrastructure. From the 1980s onwards, it was able to achieve average annual economic growth of almost 10 per cent, except during periods of recession, thanks to heavy Japanese and american investment, mainly in electronics and the automotive industry.
The export orientation is very high, and there is hardly any sector in the economy that is incapable of significant export performance (Hays, 2020).
although China is not one of the top performers in terms of GDP per capita due to its huge population, it has shown a very rapid catching-up performance due to its double- digit economic growth over many years.
In order to stabilise food supplies, agricultural restructuring took place in the late 1970s to preserve collective land ownership while increasing the financial stake of agricultural workers. This was followed by an increase in the decision-making autonomy of industrial companies and the authorisation of mass-scale creation of private enterprises.
Foreign capital was also allowed to return into China’s economy.
The oil booms of 1973 and 1979 led to a massive increase in production costs worldwide. It was at this time that China, with its many untapped resources and huge potential market, became a new target for capital untapped elsewhere. The key to its success was the industriousness and cheapness of Chinese labour, and the fact that low wage levels persisted for a long time (Gyuris, 2017). Catching-up has always been achieved at extremely high investment rates, often exceeding 40 percent (Székely-Dobi, 2017).
conclusions
The development practice of the emerging countries indicates that it is not absolutely essential to create national industries, but that a strategy based on attracting foreign capital or joining an existing value chain, initially with a technology acceptance policy, can be successful.
neither high investment rates nor a low tax burden are necessary for rapid development, although the former, especially when translated into investment efficiency, undoubtedly makes rapid development very likely.
If the various models emerging from the development studies were to be ranked, the nordic model (plus Germany and austria) is perhaps the most promising, as it scores well for all the development indicators examined
here (human development, competitiveness, absence of corruption). This high level of development is coupled with social solidarity and environmental sustainability, whereas in the anglo-Saxon and, even more so, the Far Eastern model, economic efficiency is achieved with a weaker social safety net.
There is therefore no single set of conditions for successful catching-up, but in the current situation it seems that without a mixture of education, strong development of health care, ability-based selection, competent and autonomous bureaucracies, competing elites and development paths accepted by the majority of society no lasting convergence can be achieved. and a generally high standard of living can give legitimacy to a country’s leadership for taking individual paths. ■
notes
1 Extraction dependent countries: mauritania, Guinea, Bolivia, Sudan, Venezuela, Dem. Rep.
of the Congo, kazakhstan, Qatar, united arab Emirates, Botswana, Iran, mongolia, kuwait, Bahrain, Chad, Gabon, oman, Saudi arabia, timor-leste, yemen, algeria, Brunei, azerbaijan, nigeria, Congo, angola, libya, Equatorial Guinea, Iraq, Hungarian spelling: mauritánia, Guinea, Bolívia, Szudán, Venezuela, kongói Demokratikus köztársaság, kazahsztán, katar, Egyesült arab Emirátusok, Botswana, Irán, mongólia, kuvait, Bahrein, Csád, Gabon, omán, Szaúd-arábia, kelet-timor, Jemen, algéria, Brunei, azerbajdzsán, nigéria, kongó, angola, líbia, Egyenlítői Guinea, Irak
2 https://globalriskinsights.com/2014/04/four- countries-that-beat-the-resource-curse/although Botswana is on the list of extraction dependent
countries, it is a middle-income country, which is rather an exception on the african continent, especially in Sub-Saharan africa
3 tax havens: andorra, anguilla, antigua and Barbuda, aruba, Bahamas, Bahrain, Barbados, Belize, Bermuda, British Virgin Islands, Cayman Islands, Cook Islands, Costa Rica, Curaçao, Cyprus, Djibouti, Dominica, Gibraltar, Grenada, Guernsey, Hong kong, Ireland, Isle of man, Jersey, Jordan, lebanon, liberia, liechtenstein, luxembourg, macao, maldives, malta, marshall Islands, mauritius, micronesia, monaco, montserrat, nauru, netherlands & antilles, niue, Panama, Samoa, San marino, Seychelles, Singapore, St. kitts and nevis, St. lucia, St. martin, St. Vincent and the Grenadines, Switzerland, taiwan, tonga, turks and Caicos, united kingdom, Vanuatu
References alcidi, C., núñez Ferrer, J., Di Salvo, m. et al.
(2019). Income Convergence in the Eu: a tale of two speeds. online: https://www.ceps.eu/ceps-publications/
income-convergence-eu-tale-two-speeds/
https://doi.org/10.1007/s10272-019-0783-6 Baumol, W. J. (1986). Productivity Growth, Convergence, and Welfare: What the long-run Data Show. American Economic Review, Vol. 76 no.
5, pp. 1072-1085
Boffey, D. (2017). netherlands and uk are biggest channels for corporate tax avoidance. The Guardian, online: https://www.theguardian.com/
world/2017/jul/25/netherlands-and-uk-are-biggest- channels-for-corporate-tax-avoidance
Breznits, D. (2011). Ideas, Structure, State action and Economic Growth: Rethinking the Irish miracle.
Review of International Political Economy 19(1), https://doi.org/10.1080/09692290.2010.514260
Buchanan, m. (2017). tax Havens Can Be Surprisingly Close to Home. Bloomberg View.
online: https://www.bloomberg.com/opinion/
articles/2017-04-11/tax-havens-can-be-surprisingly- close-to-home
Coutinho, l., turrini, a. (2020). Real Convergence across the Euro area. Intereconomics, Volume 55, number 5, pp. 301-311,
https://doi.org/10.1007/s10272-020-0920-2 Dharmapala, D., Hines Jr., J. R. (2006). Which Countries Become tax Havens? nBER Working Paper no. 12802, December,
https://doi.org/10.3386/w12802
Dufrénot, G., Sanon, G. (2014). testing Real Convergence in the ECoWaS countries in Presence of Heterogeneous long-Run Growths. CREDIt Research Paper no. 05/14, Centre for Research in
Economic Development and International trade, university of nottingham
Dufrénot, G., mignon, V., naccache, t.
(2009). The slow convergence of per capita income between the developing countries: 'growth resistance' and sometimes 'growth tragedy'. CREDIT Research Paper no. 09/03
Franks, J., Barkbu, B., Blavy, R., et al. (2010).
Economic Convergence in the Euro area: Coming together or Drifting apart? WP/18/10 ImF Working Papers,
https://doi.org/10.5089/9781484338490.001 Gál Z. (2015). Financial Globalisation and the Spatial limitations of Financial-monetary Integration in the Eurozone Pénzügyi Szemle (Financial Review), 2015/1
Gyuris F. (2017). The Causes and limits of the Chinese Economic miracle. Földrajzi Közlemények (Geographical Publications), 141/3, pp. 275-287
Hays, J. (2008). Economic history of Thailand:
Post-war boom and the Thaksin and post-Thaksin years. online: https://factsanddetails.com/southeast- asia/Thailand/sub5_8g/entry-3310.html
Hines Jr., J. R. (2010). treasure Islands. Journal of Economic Perspectives. 4 (24), pp. 103-125, https://doi.org/10.1257/jep.24.4.103
del Hoyo, J. l., Dorrucci, E., Heinz, F. F. et al. (2017). Real convergence in the euro area: a long- term perspective. occasional Paper Series no. 203/
December
kauryha, a., Valdivieso, P. (2015).
Economic convergence as natural evolutionary path. online: https://www.revistaespacios.com/
a15v36n05/15360516.html
Johnson, P., Papageorgiou, C. (2020). What Remains of Cross-Country Convergence? Journal of Economic Literature, Vol. 58, no. 1, pp. 75-129, https://doi.org/10.1257/jel.20181207
kumar, S., Siddique, S. (2010). The Singapore success story: public-private alliance for investment attraction, CEPal – Serie Comercio internacional, no. 99
lucas, Jr., R. E. (1988). on the mechanics of Economic Development. Journal of Monetary Economics 22, pp. 3-42, north-Holland,
https://doi.org/10.1016/0304-3932(88)90168-7 maddison, a. (2001). The World Economy: a millennial Perspective, Paris. oECD, Development Studies Centre,
https://doi.org/10.2307/20050348
matkowski, Z., Prochniak, m., Rapacki, R.
(2016). Real Income Convergence between Central Eastern and Western Europe: Past, Present, and Prospects. 'Ekonomista', nr. 6
millar, H. (2017). 'Is the u.k. already the kind of tax Haven It Claims It Won’t Be?' Bloomberg News, 31, July, online: https://www.bloomberg.
com/news/articles/2017-07-31/is-the-u-k-already- the-kind-of-tax-haven-it-claims-it-won-t-be
north, D. C. (1990). Institutions, Institutional Change and Economic Performance. Cambridge university Press,
https://doi.org/10.1017/cbo9780511808678 Patel, D., Sandefur, J., Subramanian, a. (2021).
The new Era of unconditional Convergence. ashoka university Economics Discussion Paper 54, February, https://doi.org/10.1016/j.jdeveco.2021.102687
Pelle a., Végh m. Z. (2019). How Has the Eurozone Changed Since its Beginnings. Pénzügyi Szemle (Financial Review), 2019/1
Rama, m. (2019). Converge and European Value Chains: How Deep Integration Can Reignite Convergence in the Eu. CID Research Fellow and Graduate Student Working Paper Series 116, Harvard university
Romer, P. m. (1986). Increasing Returns and long-Run Growth. Journal of Political Economy, Vol.
94, no. 5, pp. 1002-1037, https://doi.org/10.1086/261420
Solow, R. m. (1956). a Contribution to the Theory of Economic Growth. Quarterly Journal of Economic,s 70, pp 65-94,
https://doi.org/10.2307/1884513
Székely-Doby, a. (2017). Challenges of the Chinese Development State. Közgazdasági Szemle (Bulletin of Economics), volume lXIV, June, pp. 630- 649,
https://doi.org/10.18414/ksz.2017.6.630
tan, k. S., Bhaskaran, m. (2015). The role of the state in Singapore: Pragmatism in pursuit of growth. Singapore Economic Review. 60, (3), pp.
1-30
Vargha B. (2017). tax base withdrawal symptoms?
Pénzügyi Szemle (Financial Review), 2017/2
united nations Development Programme:
Human Development Report 2020. online: http://
hdr.undp.org/en/2020-report,
https://doi.org/10.18356/978921005516