Róbert Magda, Norbert Bozsik
Competitiveness of the European Union in Light of Foreign Trade
Summary
The main aim of this study is to analyse and present competitiveness in order to evalu- ate trends in the Member States of the EU.
Competitiveness is explained at a corpo- rate, national and regional level. Two im- portant statistical indicators are considered for its calculation: the Commodity terms of trade (C), also known as the net barter terms of trade (N), and the Income terms of trade index (I), which communicates the correlation between changes in quantity and price. A stable economy requires sur- plus in the trade balance and improvement in exchange rate. The primary purpose of the goods export indicator is to capture the knowledge capital available in a country in order to provide characteristics and map the structure of trade for use as gauging tools. The three nations in which export surplus to GDP is very high are the Neth- erlands, Switzerland, and Ireland. Nega- tive trade balances have been recognised in Romania, France, and the United King- dom. As a result of changes in prices and volumes, nominal trading values were seen to rise continuously in 2018. Global com-
modity exports globally increased by 10 per cent, predominantly propelled by 20 per cent increase in oil prices. Rapid growth and development in innovation triggers in- crease in GDP and exports. Additionally, it is observed that export grows significantly faster in the Euro Area Member States than in non-EEA Member States.
Journal of Economic Literature (JEL) codes:
F1, F31, F4, O24
Keywords: economic structure, export sur- plus, high-quality products, exchange rate, Euro Area Member States
Introduction
Two major phenomena: globalisation and competitiveness dominate global economy at present. Competitiveness is often de- fined as the analysis of the macroeconomic position of a country, and it is examined at all levels, namely the corporate, regional and national level. As in an economy, these levels influence one another’s performance through several economic agents, a sharp difference between them is not advisable.
This concept corresponds to the complex
Róbert Magda, Professor, Szent István University, Gödöllő, Hungary; North-West University, Vanderbijlpark, South Africa (rmagda72@gmail.com); Norbert Bozsik, Professor, Szent István University, Gyöngyös, Hungary (bozsik74@gmail.com).
analysis of and systematic approach to each level, but it is also crucial to assess sub-areas.
The concept of competitiveness has been defined in various approaches, including the classical and the neoclassical approach.
Recent theories have suggested and devel- oped regional competitiveness concept by a combination of applied economics with classical theories (Martin, 2005; Voinescu and Moisoiu, 2015). The policy goals set for regional competitiveness have been adopted by the European Commission (EC) as key incentives to global market performance, the export capacity of the economy, and economic growth as a whole (Martin, 2005). The most common con- cept of competitiveness has recently been defined by OECD documents as “the abil- ity of companies, industries, regions, na- tions and transnational regions to create relatively high incomes and relatively high levels of employment over time while be- ing exposed to foreign (global) competi- tion” (Magda et al., 2017; Lengyel, 2012;
Magda, 2017). The concept of competitive- ness is widely used in the economic litera- ture, and various perspectives, approaches and meanings are presented (Porter, 2000;
Wijnands et al., 2007; Krugman, 1991; Qi- neti et al., 2009; Krugman, 1994; Andrei et al., 2020). Governments and policymakers have been pushed to enter into this wave of competition at all levels. Increased interest in competitiveness is attributable to the fact that each and every country has to compete by raising the standards of economic com- petence as an outcome of the globalisation of factor markets and other goods (Vahalík and Staníčková, 2016). According to This- sen and co. (2013), the discussion of com- petitiveness has been raised to the new level as far as international competitiveness is concerned. The authors claim that a mere
sizing up of the assets of a region is insuffi- cient for clarifying which regions compete with each other, and so it is necessary to set up and apply an analytical framework for the analysis of the contending systems of re- gions and assets. Hence, in any country, the measurement of competitiveness is affected by two factors: the structure of the market for which it is calculated and the region where it is calculated (Durand and Giorno, 1987). For the purpose of this study, re- search was done to analyse the competitive- ness of Hungary and the EU-28 on the basis of the effects of foreign trade.
The main objective of the study is to analyse and present competitiveness in the Member States of the EU by evaluating forecasts and trends. To this end, the WEF Evaluation Report and the World Bank’s database were used. Goods and services are considered as marketable in the global mar- ket and in the single market of the EU on the basis of the producer’s competitiveness, and depend on consumers’ propensity to purchase. The sales revenues and export sales revenues naturally and highly depend on the volume of regional value added and on the level of processing semi-finished or unfinished goods.
Material and methods
International trade is transacted in a variety of products, which cannot be aggregated in their natural state. However, international exchange rates changes can be detected in each country with the help of two common- ly used indicators:
1. The commodity terms of trade (C), or oth- erwise known as net barter terms of trade (N).
C = Px / Pm
The numerator consists of the export price index, which represents the average
change in the value of goods exported by a country. In the denominator the import price index can be construed in the same way. Obviously, the exchange rate of a coun- try improves if the value of C is more than 1, which implies that the country needs to produce less on an average per export product.
2. The income terms of trade index (I) ex- presses the correlation between changes in prices and quantities.
I = (Px / Pm) x Qx = C x Qx
The average export volume change is indicated by the Qx factor in the formula, and the change is from one year to the next. It is revealed that if a country’s export earnings are completely spent on imports, the country’s export earnings could pur- chase more or less import products than in the previous year. It is also important to comprehend the C-related factors and its evolution. Increase in the Qx factor might be triggered by a decrease in C, which can raise I above 100 per cent (1). However, in this case a decrease in C might be beneficial and the imports can be boosted (Wilson et al., 1969; Vizdák, 2002).
These two trade ratios need to be ana- lysed concurrently. In a country in a given year C may be less than 1, while I may in- crease. Such a situation may take place if, for instance, the price elasticity of export prod- ucts is greater than 1, which results in faster increase in the export volume by a relative decrease in export prices. These foreign trade ratio changes also imply the evolution of comparative advantages achieved by the economy of a country. Progress or decline in the indicators implies relative decrease or increase in the comparative advantages.
In the scenario of open economies, this is considered as important evidence (Wilson et al., 1969; Porter, 2000; 2001).
The value and quantity of the commodi- ties determine the raw monthly data, which is processed in a highly comprehensive manner to attain elementary unit value in- dices. The latter are divided by the preced- ing and average unit values in order to ob- tain elementary unit value indices to form the basis of the analysed and then eliminat- ed outliers. Subsequently, the elementary unit value indices are aggregated into com- modities and countries by the Laspeyres, Paasche and Fisher index formulas, and then the Fisher unit value indices are relat- ed back to the base year (2000). The result- ing indices describe fluctuations in export and import prices and the changes in the exchange rates of imports and exports in the European Union.
Results and discussion
This analysis considers the EU-28 Member States on the basis of their foreign trade competitiveness. The selected countries are Austria, Belgium, Bulgaria, Cyprus, Czech Republic, Denmark, United Kingdom, Esto- nia, Finland, France, Greece, Netherlands, Croatia, Ireland, Poland, Latvia, Lithuania, Luxembourg, Hungary, Malta, Germany, Italy, Portugal, Romania, Spain, Sweden, Slovakia and Slovenia.
The significance of the study lies in the fact that foreign trade relations between the Member States of the European Union is crucial in strengthening global and local economic integration and hence assuring a leading role of the EU in the world econo- my. A 14-year trend is analysed in light of the key indicators set in the principles of the EU, based on a large database.
Hungary’s competitiveness is presented in detail for the 12 pillars to highlight the significance of networking for business and
organisations and the responsibility of the cluster system in enhancing and improving competitiveness. The framed hypotheses of the present study have been proved based on literature data and they evidence that Hungary is far behind most of the Member States of the EU in competitiveness, and even performs below the average of the Visegrád 4 countries.
In order to speed up growth and en- courage development, new approaches should be embraced, such as,
– Hungary may benefit from the inter- nationalisation of trade.
– The improvement and intensification of capital flows may improve the situation.
– In light of worldwide competition, competitive business advantages are of- fered in knowledge transfer, innovation and competitiveness.
In an economy, improvement in com- petitiveness requires a stable economic structure that allows surplus in the trade balance between countries, and improve- ment in the exchange rate. These presup- pose increase in the innovation and knowl- edge content of the services and goods meant for export. Surplus in Hungarian trade with the EU is in part due to the im- port-export carried out in the value chains of Germany. The value-added sections of the value-chains should also be located in Hungary. On the other hand, Hungary’s trade with Asian countries shows a deficit, which implies an insufficient number of products that can be sold to Asian countries to obtain good profit.
It is well-known that the export of low- processed products cannot generate major gains on export, and high-quality export re- quires high-quality products. Additionally, the national management and financial strategy need to be expanded in the same
way to the corporate level through govern- ance, planning, organising and controlling based on set goals, and the attraction of capital owners, among others, in agricul- ture (Széles et al., 2014; Grubb and Neu- hoff, 2006; Lentner, 2018).
Agricultural producers’ principal aim in the EU, in Hungary and in Germany is to increase capital accumulation in order to employ improve the production technol- ogy they apply and thus their competitive- ness in the regional markets and worldwide (Szabó and Zsarnóczai, 2004; Andrei et al., 2020; Powell and Gianella, 2010). The subsidies granted for production purposes were focused on technology improvement through subsiding fixed capital consump- tion in the EU. In general, in 2016 subsi- dies made 87 per cent of the consumption value of fixed capital. Improvement in the competitiveness of EU exports was due in part to the concentration of fixed capital subsidies in the EU-28.
The fundamental aim of the global val- ue chain is to slice up the production pro- cess into different stages and establish each stage in different countries. For instance, in car manufacturing complex tasks, like the manufacturing of complicated parts, have been performed in Germany, while assem- bling is outsourced to Hungary. Similarly, the marketing of the products and after- sales services are performed in by a third party, usually in another country, as it is not necessary for a single country to own the entire value chain. It is important to under- stand that assembling is considered as the lowest value-added production, and under- employment, i.e. highly skilled employees doing simple jobs, is regarded as a major disincentive to competition and an indica- tion that the human capital is mismanaged.
In today’s scenario foreign trade is becom-
ing crucial. Service providers and tourism have the largest share in the import and export of services.
The Economic Complexity Index (OEC, 2018) is an indicator surveyed in 128 coun- tries on an annual basis. It shows competi- tiveness because it efficiently responds to the anticipated rate of closing the gap in economic development and complexity.
The indicator also shows the complexity of using international trade data by a country.
According to this indicator, Hungary was ranked 8th among 128 countries in 2015, showing steady improvement since 2011, while the position of the other V4 countries remained broadly unchanged or slightly de- clined relative to the European Union aver- age. Hungary preceded Finland, Belgium, the UK and the USA. The top three coun- tries in the list included Japan, Germany and Switzerland. The purpose of the indica- tor is to capture the knowledge capital avail- able in a country through the characteristics and the structure of trade. The indicator is calculated from the UN Comtrade (2018) database, adjusted for distorting factors based on objective data obtained by mathe- matical methods. The indicator reflects the economic strength of a country in terms of products quality and the diversity of exports (Samuelson and Nordhaus, 1992; Schwab and Sala-i-Martín, 2017).
The United Nations’ recommendations define the concepts and principles of con- ducting foreign trade. Regulation (EC) No.
638/2004 of the European Parliament and of the Council and Commission Regula- tion (EC) No. 1982/2004 of the European Parliament and of the Council regulate trade with Member States of the European Union, while non-EU trade statistics are produced in accordance with Regulation (EC) No 471/2009 of the European Parlia-
ment and of the Council as amended and with Commission Regulations (EC) No.
92/2010 and (EU) No. 113/2010. Out- standing growth rates were recorded in 2018 for Russia (5.7%), the United States (4.1%) and China (5.4%).
In 2018, the export volume increased by 3 per cent in the 28 Member States of the EU, while the volume growth rate declined.
In Hungary, the volume of exported was 4.3 per cent higher for goods, and 6.3 per cent higher for services. In some key countries, the foreign trade balance is presented as a ratio to GDP, which dropped in most Mem- ber States of the EU, including Hungary. In Switzerland, Ireland, and the Netherlands the surplus to GDP is exceptionally high.
Negative trade balances were recognised by France, the United Kingdom, and Romania (UN Comtrade, 2018; Eurostat, 2018).
Price and volume changes caused a rise in nominal trade in 2018. Global commod- ity exports increased by 10 per cent, driven mainly by a 20 per cent rise in oil prices.
The main oil producers, including Russia (26%) and Saudi Arabia (35%) achieved the highest increase in sales. The value of goods import increased fastest in Brazil (20%), In- donesia (20%), Vietnam (15%) and China (16%, see: IMF, 2018; World Bank, 2018).
Slower increase was due to a number of uncertainties, including:
– Retaliatory measures against certain goods,
– Weaker growth in the global economy, – The implementation of strict financial restrictions,
– Other risk factors (e.g. Brexit).
There are several other factors that in- fluence growth in an economy. More effort need to be made at development in the fol- lowing areas:
– The efficient operation of institutions
– Primary education
– Training according to the actual demand for labour
– Effective preparation for technologi- cal development (4th industrial revolution)
– Upgrading the business sector – Fast development of innovation These factors may also have a significant impact on competitiveness. In 2018, the export and import data of the EU Mem- ber States increased. Exports totalled EUR 1955.7 billion, up 4.1 per cent on 2107. Im- ports closed at 6.6 per cent at EUR 1980.4 billion. The external trade balance of the EU28 was close to EUR 25 billion, repre- senting a decrease by EUR 46 billion com- pared to the previous year. The EU’s exter- nal trading partners are relatively stable, as shown in Table 9. In 2018, intra-Communi- ty trade accounted for 64 per cent of the EU’s total external trade. Product turnover between the EU-28 Member States was EUR 3519 billion in 2018 (Eurostat, 2018).
According to the export ratio, the value of exports to GDP significantly increased.
The results were calculated on the basis of the World Bank’s database (2020a). As far as the Member States of the EU are con- cerned, export to GDP is usually high in advanced countries (Figure 1). Growth is faster in the euro area than in the non-euro area Member States of the EU (Figure 2).
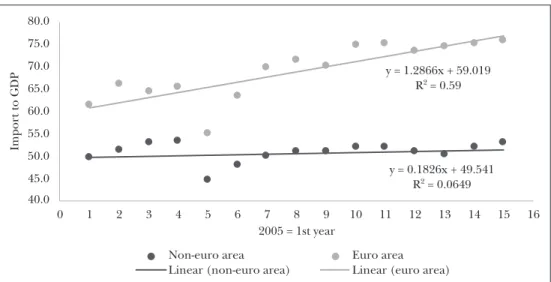
Increase in imports has significantly ac- celerated recently. This is partly due to in- crease in domestic consumption, although care should be taken to prevent excessive increase. Import to GDP increased rapidly in the euro area (Figure 5).
According to a cluster analysis based on the annual inflation value, Hungary ranks second among the five groups in the EU-28, including Slovakia and Slovenia. On this basis, clusters of developed and less devel- oped states can be distinguished. The best performing states include the Netherlands, Belgium, Austria and Finland.
Figure 1: Minimum and maximum values of export to GDP, 2005–2019
23.9 25.9 47.2
23.0 40.049.6
35.1 23.7
40.228.318.7 29.337.036.139.450.041.8 70.269.3
53.7 69.579.4
67.769.3 58.9
73.5 154.1
72.4 31.632.8
55.9 31.8
48.959.2 44.834.9
54.243.837.244.855.854.0
71.1 70.465.2 97.9100.1
86.699.5 126.8
99.5101.291.0 112.6
208.8
140.6
0.0 50.0 100.0 150.0 200.0 250.0
Italy
United Kingdom
DenmarkFranceGermanyAustriaFinland SpainSwedenPortugalGreeceRomaniaPolandCroatiaCyprusBulgariaLatvia Slovak Republic
EstoniaLithuania Czech Republic
IrelandHungary
NetherlandsSloveniaBelgium Luxembourg
Malta
Export to GDP
EU Member States
min max
Source: World Bank (2020a) database and own calculation
Figure 2: Annual average exports in euro area and in non-euro area Member States, 2005
y = 1.0175x + 43.539 R = 0.752 y = 1.686x + 59.44
R = 0.7676
40.00 45.00 50.00 55.00 60.00 65.00 70.00 75.00 80.00 85.00
0 1 2 3 4 5 6 7 8 9 10 11 12 13 14 15 16
Year, 2005 = Year 1
Non-euro area Euro area
Linear (non-euro area) Linear (euro area)
Export to GDP
Source: World Bank database (2020a) and owned calculation Figure 3: Annual average export based on inflation, 2005
50.135
53.643 54.340 54.692
48.819 52.515
57.94259.533 58.209
62.997 62.980
61.313 62.15163.00564.203 59.878
63.48562.31563.948
56.514 64.541
69.19671.065 71.785
74.59675.61374.568
73.488 74.112 76.121
52.13454.396 53.988 52.562
49.263 56.799
63.058
66.18467.242
65.651 65.683 62.982
65.34566.156 66.443
y = 1.0139x + 49.654 R = 0.7938 y = 1.5532x + 57.196
R = 0.7792
y = 1.2155x + 50.802 R = 0.7044
45.000 50.000 55.000 60.000 65.000 70.000 75.000 80.000
0 1 2 3 4 5 6 7 8 9 10 11 12 13 14 15 16
Export to GDP
Year, 2005 = Year 1 Minor decrease in inflation
Medium decrease in inflation High decrease in inflation
Linear (minor decrease in inflation) Linear (medium decrease in inflation) Linear (high decrease in inflation) Source: World Bank database (2020a) and owned calculation
The competitiveness of Hungary and of the EU Member States are analysed on the basis of the objectives. In the case of indica- tors considered important for the EU prin-
ciples, the 11-year trend is analysed on the basis of a large database. The positions of WEF competitiveness in Hungary are pre- sented for the 12 pillars. The importance of
networking for organisations and the role of the cluster system in increasing competi- tiveness is exposed. As competitiveness and trade are interrelated, the situation and changes in international and domestic trade are also presented. Hungary’s foreign trade is presented on the basis of the most recent CSO data. Trade and competitiveness are intertwined. There is strong empirical evi- dence that open economies are richer and therefore more productive than closed ones.
A 1 percentage point increase in the share of trade in GDP will increase revenue by 0.9-3 per cent. When a company enters the export market, productivity growth is boosted (EC, COM (2018) 232; EC, COM (2008) 774).
Conclusion
Based on to the linear trend analysis, the value of exports to GDP grows significantly faster in the euro area Member States (14- year trend). Developed countries are gener-
ating rapid export-import growth. Although there was a fast growth in import and export in the developed countries, the results show difference in the import-export growth for non-euro area and euro area Member States of the EU: for the latter the aver- age annual export significantly and rapidly grew in comparison to the other Member States. The euro area Member States with faster growth in export are considered as the advanced countries of the EU. Outside the euro area, the linear trend in import is sluggish, but in the euro area growth is fast (Figure 3, Figure 4 and Figure 5).
On this basis, belonging to the euro area is accelerating development, so Hun- gary should reconsider whether it is worth- while to join the euro area. Areas where improvements are achievable should be determined in order to accelerate progress;
and focus should be placed on a number of areas. Trade may be one of the areas where we can have significant potentials.
Figure 4: Minimum and maximum values in import to GDP, 2005–2019
28.424.335.8 25.735.2
25.038.733.442.937.245.737.4 23.1
43.8 69.0
37.3 57.4
70.463.8 42.1
59.266.2
57.762.165.270.6 113.3
35.130.543.8 69.7 32.743.0
33.146.841.852.547.056.350.5 35.4
71.5 89.7
59.3 80.894.088.1
68.8 85.5
112.4
85.591.398.4 108.3 172.8
153.3
0.0 20.0 40.0 60.0 80.0 100.0 120.0 140.0 160.0 180.0 200.0
United Kingdom Italy Portugal Spain Germany France Sweden Finland Denmark Romania Austria Poland Greece Cyprus Hungary Croatia Slovenia Slovak Republic Czech Republic Latvia Lithuania Ireland Bulgaria Netherlands Estonia Belgium Luxembourg Malta
Import to GDP
EU Member States
min max
Source: World Bank database (2020b) and own calculation
Figure 5: Import in euro area and in non-euro area Member States, 2005
y = 0.1826x + 49.541 R = 0.0649 y = 1.2866x + 59.019
R = 0.59
40.0 45.0 50.0 55.0 60.0 65.0 70.0 75.0 80.0
0 1 2 3 4 5 6 7 8 9 10 11 12 13 14 15 16
Import to GDP
2005 = 1st year
Non-euro area Euro area
Linear (non-euro area) Linear (euro area) Source: World Bank database (2020b) and owned calculation
References
Andrei, J. V.; Popescu, G. H.; Nica, E. and Chivu, L.
(2020): The Impact of Agricultural Performance on Foreign Trade Concentration and Competi- tiveness: Empirical Evidence from Romanian Agriculture. Journal of Business Economics and Management, Vol. 21, No. 2, 317–343, https://
doi.org/10.3846/jbem.2020.11988.
Durand, M. and Giorno, C. (1987): Indicators of International Competitiveness: Conceptual As- pects and Evaluation. OECD Journal: Economic Studies, Vol. 9, No. 3, 147–182.
European Commission (2008): Communication from the Commission on the European Competitiveness Re- port. COM (2008) 774 final, https://ec.europa.
eu/transparency/regdoc/?fuseaction=list&cote Id=1&year=2008&number=774&version=ALL&l anguage=hu.
European Commission (2018): Communication from the Commission to the European Parliament, the Council, the European Economic and Social Committee and the Com- mittee of the Regions “Towards a Common European Data Space”. COM(2018) 232 final, https://ec.europa.
eu/transparency/regdoc/rep/1/2018/HU/
COM-2018-232-F2-HU-MAIN-PART-1.PDF.
Eurostat (2018): Primary Data. https://ec.europa.eu/
eurostat/web/lucas/data/primary-data/2018.
Grubb, M. and Neuhoff, K. (2006): Allocation and Competitiveness in the EU Emissions Trading
Scheme: Policy Overview. Climate Policy, Vol. 6, No. 1, 7–30, 10.3763/cpol.2006.0602.
IMF (2018): IMF Annual Report 2018. Building a Shared Future. International Monetary Fund, www.imf.org/external/pubs/ft/ar/2018/eng/
spotlight/harnessing-technology-for-good/.
Krugman, P. (1991): Geography and Trade. The MIT Press, Cambridge, MA.
Krugman, P. (1994): Competitiveness: A Dangerous Obsession. Foreign Affairs, Vol. 73, No. 2, 28–44, https://doi.org/10.2307/20045917.
Lengyel, I. (2012): Regionális növekedés, fejlődés, területi tőke és versenyképesség [Regional growth, development, regional capital and competitiveness]. In: Bajmócy, Z.; Lengyel, I.
and Málovics, Gy. (eds.): Regionális innovációs képesség, versenyképesség és fenntarthatóság [Regional innovative capability, competitiveness and sustainability]. JATEPress, Szeged, 151–174.
Lentner, Cs. (2018): Convergence in Central Bank- ing Regulation – What EU Candidates in South- East Europe can Learn from the Hungarian Ex- perience. Jahrbuch für Ostrecht, Band 59, No. 2, 383–398.
Magda, R. (2017): The Role of Human Resource Management in Rural Hungary. Social and Eco- nomic Revue, No. 151, 33–8.
Magda, S.; Marselek, S. and Magda, R. (2017): Az agrárgazdaságban foglalkoztatottak képzettsége és a jövő igénye [Employee skills in agriculture
and demand for a future]. Gazdálkodás, Vol. 61, No. 5, 437–458.
Martin, R. (2005): A Study on the Factors of Regional Competitiveness. A Draft Final Report for The Eu- ropean Commission, Directorate-General Regional Policy. University of Cambridge, Cambridge.
OEC (2018): Economic Complexity Legacy Rankings (ECI). https://oec.world/en/rankings/country/
eci/
Porter, M. E. (2000): Location, Competition, and Economic Development: Local Clusters in a Global Economy. Economic Development Quarterly, Vol. 14, No. 1, 15–34, https://doi.org/10.1177/
089124240001400105.
Porter, M. E. (2001): Clusters of Innovation. Regional Foundations of U.S. Competitiveness. Council of Competitiveness, Washington.
Powell, W. W. and Gianella, E. (2010): Collective Invention and Inventor Network. In: Hall, B.
H. and Rosenberg, N. (eds.): Handbook of the Economics of Innovation. Vol. 1, North Holland, 575–605, https://doi.org/10.1016/s0169-7218 (10)01013-0.
Qineti, A.; Rajcaniova, M. and Matejkova, E.
(2009): The Competitiveness and Comparative Advantage of the Slovak and the EU Agri-food Trade with Russia and Ukraine. Agricultural Economics, Vol. 55, No. 8, 375–383, https://doi.
org/10.17221/42/2009-AGRICECON.
Samuelson, P. A. and Nordhaus, W. D. (1992): Köz- gazdaságtan III. Alkalmazott közgazdaságtan a mai világban [Economics III. Applied economics in the current world economy]. Közgazdasági és Jogi Könyvkiadó, Budapest.
Schwab, K. and Sala-i-Martín, X. (2017): The Global Competitiveness Report 2017–2018. World Eco- nomic Forum, Geneva.
Szabó, L. and Zsarnóczai, J. S. (2004): Economic Con- ditions of Hungarian Agricultural Producers in 1990s. Agric. Econ. – Czech, Vol. 50, No. 6, 249–254, https://doi.org/10.17221/5198-AGRICECON.
Széles, Zs.; Zéman, Z. and Zsarnóczai. J. S. (2014):
Developing Trends in Hungarian Agricultural Loans in Term of 1995 and 2012. Agric. Econ.
– Czech, Vol. 60, No. 7, 323–331, https://doi.
org/10.17221/187/2013-AGRICECON.
Thissen, M.; Van Oort, F.; Diodato, D. and Ruijs, A. (2013). Regional Competitiveness and Smart Specialisation in Europe. Place-based Development in International Economic Networks. Edward Elgar Publishing, Cheltenham.
Trend Economy (2018): https://trendeconomy.
com/data/commodity_h2.
UN Comtrade (2018): Un Comtrade Database.
https://comtrade.un.org/.
Vahalík, B. and Staníčková, M. (2016): Key Factors of Foreign Trade Competitiveness: Compari- son of the EU and BRICS by Factor and Cluster Analysis. Society and Economy in Central and East- ern Europe, Vol. 38, No. 3, 295–317, https://doi.
org/10.1556/204.2016.38.3.1.
Vizdák, K. (2002): A diszkriminancia-analízis [Dis- criminative analysis]. In: Szűcs, I. (ed.): Alkalma- zott statisztika [Applied statistics]. Agroinform, Budapest, 477–496.
Voinescu, R. and Moisoiu, C. (2015): Competitive- ness, Theoretical and Policy Approaches. To- wards a More Competitive EU. Procedia Econom- ics and Finance, Vol. 22, No. 1, 512–521, https://
doi.org/10.1016/S2212-5671(15)00248-8.
WEF (2018a): The Global Competitiveness Index.
World Economic Forum, https://reports.wefo- rum.org/global-competitiveness-report-2018/
competitiveness-rankings/.
WEF (2018b): World Economic Forum Annual Meeting. www.weforum.org/events/world-eco- nomic-forum-annual-meeting-2018.
WEF (2019): The $10 Trillion Question: How to End a Lost Decade of Global Productiv- ity. World Economic Forum, www.weforum.org/
press/2019/10/the-10-trillion-question-why-has- global-productivity-stagnated-for-a-decade/.
Wijnands, J. H., Van der Meulen, B. M. and Poppe, K. J. (2007): Competitiveness of the European Food Industry: An Economic and Legal Assessment 2007.
Office for Official Publications of the European Communities, Luxemburg.
Wilson T., Sinha R. P. and Castree J. R. (1969):
The Income Terms of Trade of Developed and Developing Countries. The Economic Jour- nal, Vol. 79, No. 316, 813–832, https://doi.
org/10.2307/2229793.
World Bank (2018): World Bank Annual Report 2018.
http://documents.worldbank.org/curated/
en/630671538158537244/The-World-Bank-An- nual-Report-2018.
World Bank (2020a): Exports of goods and services (% of GDP). https://data.worldbank.org/indi- cator/NE.EXP.GNFS.ZS
World Bank (2020b): Imports of goods and services (% of GDP). https://data.worldbank.org/indi- cator/NE.IMP.GNFS.ZS.