I
NSTITUTE OFW
ORLDE
CONOMICSIntegration Experiences of the Ten Central and Eastern European Countries
Edited by Andrea Éltető
December 2014
Centre for Economic and Regional Studies of the Hungarian Academy of Sciences
Institute of World Economics
December 2014
Centre for Economic and Regional Studies of the Hungarian Academy of Sciences Institute of World Economics
Contact Budaörsi út 45
1114 Budapest, Hungary www.vki.hu
ISBN 978-615-5447-54-9
Proofread
Zsuzsánna Biedermann
Translation work Zsuzsanna Hegedüs
Cover design Gábor Túry
Pagination
Mária Kanász, Gábor Túry Cover photo
Matthew Benton (Flickr)
Foreword ... 3
Margit Rácz ... 5 Thoughts about the first decade of membership
Krisztina Vida... 9 Comparative analysis of integration developments in the EU10 countries: Trends of adaptation and catching up
Norbert Szíjártó ... 25 Monetary and financial integration in EU10 countries
Andrea Éltető ... 41 Foreign trade trends in the EU10 countries
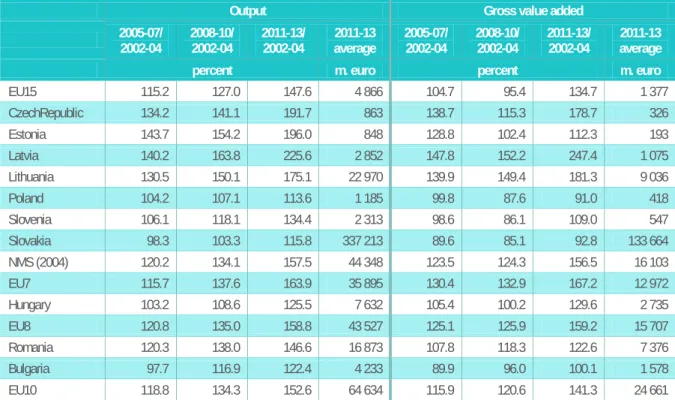
Miklós Somai ... 61 The new member states and the Common agricultural policy: Expectations, preparation and results
Gábor Túry ... 83 Automotive industry in the EU10 economies: Developments in the past decade
Annamária Artner ... 106 Labour market of the new Central and Eastern European member states of the EU in the first decade of
membership
István Kőrösi ... 120 Human capital in EU10 countries: Changes in education and research and development
Klára Fóti ... 134 Mobility from the EU10 - some considerations as seen by these countries: Remarks to the brain drain, brain waste or brain gain debate
The Authors ... 145
Foreword
This book is a collection of studies on the integration paths of those ten Central and Eastern European member states of the European Union, that joined the EU in 2004 and 2007 respectively (i.e. the Czech Republic, Estonia, Hungary, Latvia, Lithuania, Poland, Slovakia, Slovenia, as well as Bulgaria and Romania). Their experiences are analysed from different angles.
This region has a common historical and cultural heritage and is often considered as a separate or homogeneous group. Furthermore these countries have been called “new member states” following the Eastern enlargement of the EU. In our opinion, enough time has passed already to abandon this expression, and the novelty of the enlargement has faded. Therefore in this book we refer to this region as the “EU10”.
The enlargement of the EU in 2004 was a historical step because of the large number of countries acceding at one time, and because of the entry conditions being different from the previous enlargements. It is difficult to evaluate the effects of EU membership during the past decade due to the fact that the global crisis broke out just in the middle of this period, and exerted a serious impact on the economic development of all the member states including the EU10. In this volume we provide a kind of snapshot on the present situation and a description of the trends leading here. The overall picture underpins the fact that this region is far from being homogeneous. At the same time, beyond heterogeneity, there are also converging trends of certain macroeconomic indicators (such as growth rates, inflation, current account balances or public finance trends) in the post-crisis period. The region also faces many shared challenges (e.g. emigration of labour, integration into the common agricultural policy or the development of human resources) that are extensively treated by the authors too.
The first introductory pages by Margit Rácz elaborate some thoughts on the adhesion circumstances, the crisis and their consequences for the region. The study by Krisztina Vida starts with the legal and institutional aspects of integration and then goes on analysing the development of the most important macroeconomic trends including GDP growth, catching up, competitiveness and public finances. Her paper sheds light on the clear differences between the more divergent post-accession and pre-crisis developments of the EU10 and highlights an unfolding convergence of many key macroeconomic indicators in the past few years. In the following pages, written by Norbert Szijártó, especially the monetary policy features and financial integration of the EU10 are in focus. The choice of appropriate exchange rate regime, as well as the introduction of inflation targeting in larger EU10 countries contributed to successful disinflationary process in the region. Even though transition has passed and foreign participation is higher in EU10 banking system than in other emerging regions, financial markets are still less integrated than those in old euro area countries.
The study of Andrea Éltető concentrates on the changes in the dynamics and structure of foreign trade of the EU10. Geographical orientation, concentration and most traded products are analysed providing evidence for the different inclusion patterns of these countries into the global value chains. Miklós Somai writes about the agricultural sector in the EU10 region and states that the heterogeneous development since the accession is partly due to the general social and economic framework in the given country that can help or hamper the
development and modernisation of agriculture. Another selected sector that determines economic development in several EU10 members is the automotive industry. Gábor Túry shows the structural characteristics of this industry and highlights the differences between production patterns in EU10 countries.
The availability of qualified human capital has been traditionally an important value of the EU10 region.
Employment trends and labour market developments are monitored by the study of Annamária Artner. It is shown that labour market and social improvements in the region were broken by the crisis in 2008, nevertheless, a tangible wage convergence took place among the most and least developed members of the EU. In his paper István Kőrösi illustrates that the utilization of human capital is far from being satisfactory; research and development expenditures are still low and in most cases the educational system suffers from lack of resources and proper development strategy. Free movement of labour within the EU opens up new opportunities, but emigration from the EU10 countries has not always contributed to a more efficient utilization of the available human capital of these countries. The study of Klára Fóti focuses on this topic and analyses the consequences of intra-EU mobility for the labour force and the sending countries.
The virtue of this book is that all the ten countries are evaluated in every chapter, thereby providing an overall comparative view. We recommend this volume for all researchers, professors, students, as well as for policy- makers who are interested in the development of the Central and Eastern European economies as members of the European Union.
Andrea Éltető editor
Thoughts about the first decade of membership
Margit Rácz
New accession criteria
The enlargement of the EU in 2004 was different in many ways from the previous ones. Ten countries joined the EU, such a large number of countries never accessed together to the Community before. This accession was all the more extraordinary since the candidate countries wanted it much more than the EU-15 countries. In the case of this enlargement not only the ordinary law harmonization, but the Copenhagen criteria were to be implemented by the candidates, so the EU set further conditions for the countries wishing to enter.
The EU10 countries are characterized by their common history in geopolitical sense. They were members of the Council for Mutual Economic Assistance, the Warsaw Pact, they had strong relations with the Soviet Union, and with the Soviet political and economic system for a long time. The three Baltic States were even members of the Soviet Union, their autonomy came into existence after the fall of the Soviet system. After the political changes it was a natural need for these countries to join the European Union. However, the EU-15 states felt certain distrust for the candidates, that was the reason for settling the Copenhagen criteria. The European Council has decided about the five accession criteria in 1993 at the Copenhagen Summit. The European Commission had to take into consideration these points by the time of publishing the provisional opinion about the candidate countries. Four from these criteria is prescribed for the candidates and one for the EU.1
During the accession process certain issues came into force that stemmed from the actual situation of the European Union. One of these issues was the free movement of workers, which is a fundamental one of the “four
These criteria express a wish that the new countries will be able to function according to the rule of law and market economy. From today’s perspective, it is understandable that the integration maturity of the candidates was tested in this way. At the same time we must emphasize that neither in 1993 nor later has there been any measure taken to clarify the criteria of “rule of law and market economy”. At the time of the Barcelona Summit the criteria had been completed with a sixth one, resulting from the fear and suspicion of the “mega enlargement” process. The new rule obliged candidate countries to strengthen their administrative capacity. In June 2000 – as an attempt for homogenization - the Feira Summit of the European Council emphasized that the speed of negotiation processes depends on the effective national adoption and implementation of the legal achievements of the EU, the “acquis communautaire”. During the accession negotiations, the candidates were examined by the European Commission regarding the adoption of the rules of the internal market. If the countries have active market economy, than the accession to the common market would have to function properly. After joining the EU, the Chambers of Commerce and Industry of all the new member states were asked to indicate to the Commission if any discrimination happens against a company on the internal market.
1 Copenhagen criteria: 1/ political: stability of institutions guaranteeing democracy, the rule of law, human rights and respect for and protection of minorities; 2/ economic: existence of a functioning market economy and the capacity to cope with competitive pressure and market forces within the Union. 3/ acceptance of the Community acquis: ability to take on the obligations of membership, 4/ ability to take on the obligations of membership, including adherence to the aims of political, economic and monetary union 5/ the Union's capacity to absorb new members.
freedoms”: here a temporary derogation came into force. The EU-15 countries could decide in a time framework of seven years whether open their employee market or not. A transitive regulation was also that the derogation in agricultural finances, the entitlement for direct payments had been extended during 10 years gradually.
Before the accession, partners signed association agreements resulting in customs unions between the signatories. During the two period of customs reduction, the EU decreased customs earlier than the candidates.
In this respect the market accession took place gradually.
Except for the monetary policy, all the other common policies were adopted. The accession to the Economic and Monetary Union is also part of the accession protocol, without precise accession date. The new member states had to respect the convergence criteria of Maastricht Treaty regarding their fiscal policy. Since the 2004 accession, only three countries joined the EU: in 2007 Bulgaria and Romania, that are not part of the Schengen Agreement yet and in 2013 Croatia. There is a widespread debate whether the Community suffers from
“enlargement fatigue” after the mega enlargement of 2004. Ten years of membership gives the opportunity to analyze and judge this period from EU-15 and also from EU-10 point of view at the same time.
International economic environment during the first ten years
The new member countries suffered the effects of the world economic crisis since 2008. This has been a sovereign debt crises, it differs from the other crises after World War II in its character and content. Keeping the eurozone together has become a problem, many new rules have come into force. Crisis management is a challenge to the Community, member countries have not managed to reach consensus on how to solve the problems.
Already seven new member states have joined the euro area, the Czech Republic, Poland and Hungary, Romania and Bulgaria are still outside. The crisis of the eurozone did not originate from the new EU10 countries, the real problems that required new forms of finance came from Greece, Ireland, Portugal and Spain. (In 2013, Cyprus had sovereign debt crisis as well, and received support from the EU). Thus, the economic situation in the eurozone’s Southern member states gave more reason to worry, than the ones that joined in 2004 and were relatively poor compared to the EU average.
Due to the debt crisis, new regulations were applied, that forced EU member states to carry out a stricter fiscal policy than before. At the same time, the EU had to face serious employment and growth problems and country specific problems emerged. The crisis has increased differences between member state performances.
If we judge the period of the EU10 countries after enlargement, we cannot disregard the fact, that after the first three years, the agenda of the following seven years was determined by the fight against crisis and against problems generated by the crisis. Therefore, the difficult situation of the EU countries was caused by the illiquid international capital market and not by the internal relations of the EU.
The lobby power of the European Union at international level at crisis times depends on how can the EU enforce its supranational rules on the member states. As for this crisis began as a worldwide subprime crisis, the world should have changed the rules of the international capital markets in order to avoid similar crises in the future. But this did not really take place. The new member states had to accommodate in such an EU that was not able to orientate itself properly. This caused further problems, and opened new lobby channels at national levels.
After the crisis, in the core EU15 the unemployment rate jumped high, the growth was low, and this period is characterized by frequent elections and personal changes in financial minister positions. It is evident that the new European institutions managing the EU from 2014 on have to find a way out from this situation.
The EU10: similar initial conditions, diverging performances
The lack of market economy and rule of law, and their creation sustainability resulted in different development paths. The EU10 do not form a homogeneous group. (Of course this homogeneity did not exist before joining the EU either.) The differences of starting conditions reflected the extent of dictatorship in the given country before the collapse of the political system. There were notable differences for example in the degree of private ownership. After the changes, a significant private ownership developed in these countries.
Evaluation of the post accession years is difficult, because the crisis breaks the period from 2008. All similarities and differences have a role in the success of a country that is defined by the degree of economic recovery and convergence.
Table 1: Variation of GDP per capita,
EU10, percent1995-
1999 2000-
2004 2005-
2009 2010 2011 2012 2013 2014 2015
European Union - 1.9 0.5 1.7 1.5 -0.7 -0.1 1.3 1.7
Euro area 2.2 1.4 0.2 1.7 1.3 -0.9 -0.6 1.0 1.5
Estonia 7.1 7.8 1.3 2.6 9.5 4.0 0.8 2.3 3.4
Latvia 5.3 8.4 2.6 0.8 7.3 6.5 5.1 4.6 4.9
Lithuania 5.4 7.9 3.6 3.7 8.5 5.1 4.3 4.1 3.9
Slovenia 4.4 3.5 1.9 0.9 0.5 -2.7 -1.2 0.6 1.2
Slovakia 4.1 3.9 5.0 4.2 3.6 1.6 0.8 1.9 2.7
Czech Republic 2.3 3.7 3.0 2.2 2.0 -1.1 -1.0 2.0 2.3
Hungary 2.6 4.5 0.5 1.3 1.9 -1.2 1.4 2.4 2.3
Poland 5.9 3.3 4.7 2.9 4.5 2.0 1.6 3.3 3.5
Bulgaria 0.2 6.5 4.4 1.1 4.4 1.2 1.4 5.4 5.7
Romania 0.7 6.3 4.8 -0.6 2.8 0.8 3.8 2.7 2.9
Source: European Economic Forecast, 2014/3.
If we compare the EU10 on the basis of a five years average, we discover that only the three Baltic countries and Poland reached data above 5% between 1995 and 1999 (Table 1). If we analyze the next five years, only Baltic countries, and the two newcomer countries from 2007 reached that level. If we consider the 2005-2009 period, Slovakia was the only country reaching 5%. However, some countries realized unbroken economic development.
Between 2011 and 2013 the GDP in the EU and in the euro area was shrinking. On the other hand, among the EU10 there were also countries having slowing growth. In Slovenia and the Czech Republic, GDP shrank in the last two years of the period. Compared to the EU or to the eurozone average, EU10 had better performance. It is noteworthy that GDP has not decreased in the Baltic States, Poland and Bulgaria.
The first ten years and the catch-up
The development of the European integration so far did not create such a long-term successful catch-up model, upon which the EU10 countries can build. The results of the crisis can still be seen in 2014: in the Southern member states that joined in the 1980s, there had been no sustainable growth model, which could have provided stabile catching up process. Probably the crisis effects will influence the regional division of labour model, which was the result of globalization. In 2014, the EU has to face several types of growth challenges, without universally accepted solutions.
During the European Parliament’s hearing, Bienkowska, the new Polish Commissioner in charge of the internal market pointed out that there will not be growth without stabile industrial basis. She named one of her priorities to improve the industrial competitiveness of the EU. If Europe wants to be a prosperous, competitive and environmentally sustainable, the share of industry has to increase to 20% in the EU’s GDP until 2020. She also stated that internationally the energy prices are the highest in the EU. Regarding industrial production, she declared that the biggest problem is the dramatic fall of investments. She would like to take special care of leading European industries like the car industry, chemical industry and also defense industry.2.The Commission creates an EUR 300 billion growth package to boost growth, investment and employment.3
The IMF is also concerned about sustainable growth. However, their proposed solutions to these problems are totally different from those of the Commission. Christine Lagarde, the chief executive of IMF highlighted three main areas, where IMF has to react. The first is growth and employment: for example the properly prepared and implemented infrastructural investments could help. The second is the analysis of financial stability and risk – the task of the organization is to draw attention to the global dangers. The third is the area of labor market and social security reforms. Capital should be reallocated for infrastructure and employment creation investment to launch economic growth. This could negatively effect on the financial balances of the countries, however, in short-term, the creation of demand is so important, that the IMF itself considers the balance of national public finances secondary in the short run.
If growth and employment problems are not treated, that could cause even a new recession period from 2015.
4
Catching up is a long-term task. In the short run, countries must always face current challenges. It cannot be judged whether the short-term solutions could lead to stable convergence in the long run. Still, the EU10 countries do not seem to have a strategy for a middle class-based market economy that is stable and competitive. It might be that such strategy cannot even be created. In any case, the European Union should recognize that the cohesion policy solutions established so far might not decrease economic heterogeneity. A good example for that is the crisis in the Southern EU member states, its adequate and deep analysis could contribute to recognize similar problems EU10 countries might face decades later.
2 http://ec.europa.eu/about/juncker-commission/docs/2014-ep-hearings-reply-bienkowska_en.pdf
3 http://ec.europa.eu/about/juncker-commission/priorities/01/index_en.htm
4 http://www.imf.org/external/np/speeches/2014/101014.htm
Comparative analysis of integration developments in the EU10 countries: Trends of adaptation and catching up
Krisztina Vida
Institutional integration, application of single market law, use of EU funds
When acceding to the European Union, the new member states joined a legal community with the obligation of timely and accurate implementation of EU law. The European Commission closely monitors the member states’
performance with special regard to transposition of single market directives. In this respect5 the newcomer countries had an extremely heterogeneous performance in the year of accession (2004) followed by a quick adaptation process (see Figure 1). As a result, in terms of transposition deficit, these countries are at around 1%
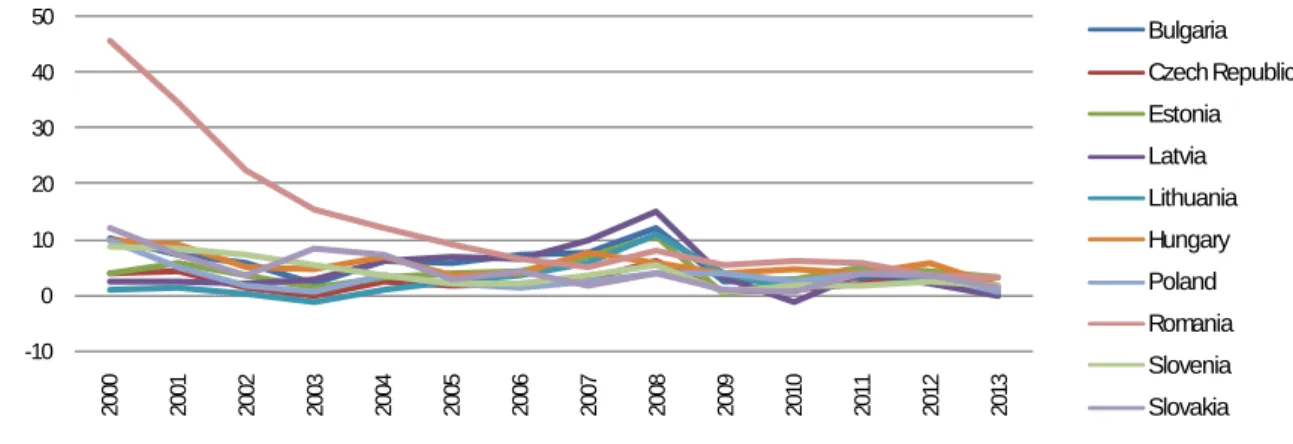
level (close to the EU average) which shows a high degree of discipline. Regarding infringement cases (see Figure 2) they were usually on the rise a few years after accession, followed by an improving trend in general. In this field the overall performance of the EU10 has been very good, almost constantly remaining under the EU average – with the sole exception of Poland. The latter country has been struggling with EU law especially on transport, environment (emissions) as well as health and consumer issues. For the whole group in general, the most problematic dossiers seem to be environment-related directives, but taxation or agriculture could also be mentioned. All in all however, it must be emphasized that currently (in 2014) the EU10 countries have just a few contentious cases (ranging between some 10 and 49) which should be compared to the around 1,200 single market directives in force.6
Source: European Commission(2014a) (for Romania and Bulgaria data only since 2007)
Figure 1: Transposition deficit of single market directives
percent of total5 European Commission (2014a)
6 European Commission (2014b), p. 4.
0 2 4 6 8 10 12
2004 2005 2006 2007 2008 2009 2010 2011 2012 2013 2014
CZ EE LV LT HU PL SI SK BG RO EU
Figure 2: Number of infringement cases
Source: European Commission (2014a) (for Romania and Bulgaria data only since 2007)
With regard to institutional integration, the newcomers have been efficient and successful. First of all, filling up the positions in the European administration was a rather smooth process, although finding well trained people, really fit for the tasks at the EU institutions was not easy in the beginning (mainly regarding interpreters/translators).7 Furthermore, five of the ten countries have already assumed successful Council presidencies – Slovenia in 2008, the Czech Republic in 2009, Hungary and Poland in 2011 and Lithuania in 2013 – enabling their administrations to gain a deep knowledge and understanding of EU-level decision-making mechanisms.8 These countries' politicians proved to be active in the European Parliament too. In March 2014, there were five representatives from the EU10 region from among the 15 MEPs of the year (this time nominated also of the whole term).9 It should also be mentioned that seven of ten capital cities – namely Warsaw, Prague, Budapest, Ljubljana, Tallinn, Riga and Vilnius – are hosting a European agency or independent body out of 40 such institutions.10
Another indicator of “institutional maturity” is the use of EU funds by the beneficiary countries. Here the EU10 countries could be characterised by a long learning process. Even though the Eastern enlargement was the first where the applicant countries had – via the pre-accession funds – the opportunity to prepare for the absorption of greater amounts of non-reimbursable assistance, the use of those funds has still been relatively slow and not without problems in several new member states. While – thanks to the n+2 rule
Last but not least, as a general observation, it should also be highlighted that the EU10 never formed a blocking minority that would put a break on further integration. On the other hand, they were able to represent common interests and ideas, especially in the field of preserving cohesion assistance in the 2014-2020 period, energy policy cooperation or promoting Eastern Partnership.
11
7 Bruxinfo (2004)
8 The remaining five countries will hold the presidency of the Council in the following order: Latvia (2015), Slovakia (2016), Estonia and Bulgaria (2018) and Romania (2019).
9 Ms Roza Thun from Poland, working on internet policy and digital market, Mr Jan Olbrycht also from Poland, responsible for sustainable built environment, Ms Kinga Gál from Hungary, fighting for minority rights and linguistic diversity, Mr AlojzPeterle from Slovenia responsible for health issues, and finally Mr Marian J. Marinescu from Romania promoting research and innovation.
(http://www.mepawards.eu/winners)
10 http://europa.eu/about-eu/agencies/index_en.htm
11 According to the n+2 rule, the recipient countries can prolong the implementation of EU cohesion assistance by two years after the end of the financial framework, i.e. until the end of 2015.
– by 2014 the contract ratios have improved tremendously everywhere, the actual payments are still lagging behind (see Table 1). In this
0 10 20 30 40 50 60
EU CZ EE LV LT HU PL SI SK BG RO
2005 2006 2007 2008 2009 2010 2011 2012 2013 2014
respect the worst performer is Romania and the best one is Estonia (being at 37% and 77% respectively). Given that the contracted money has to be spent by the end of 2015, recently an “absorption boom” can be witnessed in many of the EU10 which has a very positive impact on economic recovery.
Table 1: Absorption of EU funds (2007-2013) by the EU10, 2014
Country Contracted grants
% of total Paid grants
% of total
Bulgaria 100 54
Czech Republic 92 64
Estonia 96 77
Latvia 96 70
Lithuania 99 74
Hungary 100 62
Poland 95 64
Romania 94 37
Slovenia 93 62
Slovakia 98 53
Average 97 63
Source: KPMG12
The overall absorption performance has been more heterogeneous than the sectoral distribution of EU assistance: nine out of the EU10 have been overwhelmingly investing into infrastructure (between ca. 60-80% of the total grants), followed to a more modest extent by human capital and research activities. The only exception was Slovenia, where, most of the money went into R&D as well as information technology and communication, thanks to high quality infrastructure and due to a different policy approach.13
As a result of these trends, the gap among the EU10 countries has narrowed significantly by 2013 compared to 2004 (from 35-87% to 47-83% of EU28 average) and the whole group got closer to the Union average too. The Catching up
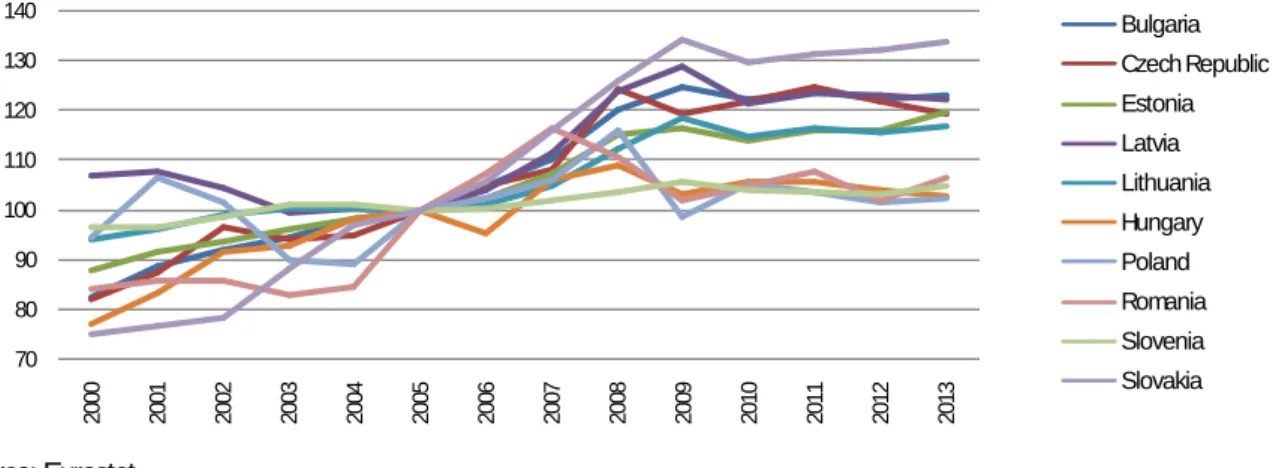
One of the main reasons for joining the European Union by the Central and Eastern European countries was the ultimate objective of gradual convergence of living standards to the EU average. Catching up can be measured with several indicators. In this study three basic series are used. The first index is the development of GDP per capita. Figure 3 illustrates well that none of the EU10 countries could reach the EU average in the past ten years but some closing up has been taking place, even if at different paces. This was due to two parallel phenomena at the same time. The two best performers, Slovenia and the Czech Republic recorded since 2009 a slight decline and stagnation respectively, both suffering from a longer economic recession than the rest of the group. On the other hand, an especially spectacular catching up (reaching of around 20 percentage points between 2004 and 2013) took place in the case of Poland, Slovakia, the Baltic states, and Romania, and a modest one in the case of Bulgaria and Hungary.
12 KPMG (2014), p. 12.
13 KPMG (2013), p. 16.
main question in the post-crisis period is, whether a more dynamic growth in the coming years would trigger a faster convergence to the EU average or whether this process will be a protracted one. Another question is, whether the gap within the EU10 would continue narrowing, or would they take a more diverse path of catching up.
Figure 3: GDP per capita
PPS, EU28=100Source: Eurostat
The second indicator is regional convergence. The available regional data show a significant heterogeneity of the EU10 countries. First of all, it must be mentioned that from the ten analysed countries, only six have more than two NUTS2 regions (the Baltic states being one single region each and Slovenia having two regions: the Western one being at the EU level and the Eastern one being still under 75% of EU average). A common feature in all of them is the significant development of their central regions embracing the capitals. Moreover, from 2014 onwards, the central regions of Poland, the Czech Republic (where the capital city itself is a region), Slovakia, Hungary, Slovenia and Romania are all categorised as more developed regions (i.e. above 90% of EU average, not eligible for the Cohesion Fund), while only Bulgaria and the three Baltic states remain entirely under the less developed (below 75%) status.
Another similar feature across the mentioned six bigger countries is that most of them are struggling with considerable regional gaps between the central regions and the rest of the country, which did not diminish in the past years (on the contrary, it rather widened in the case of Slovakia, Romania and Bulgaria). Those six countries also had a very different regional convergence record in general. As Figures 4-9 show, most of the regions did register tangible improvement by 201114 compared to 2003, starting from very different levels. A clear exception to this trend could be witnessed in Hungary with virtually no regional convergence at all, and the Czech Republic where the regions – starting on a significantly higher level – showed a very modest increase of GDP per capita.
The discrepancies among those six countries’ non-central regions is quite significant: according to the 2011 Eurostat data, roughly the half of those regions were below 50% while the other half could be found between 50 and 75% of EU average.15
14The 2011 data were the latest available in the Eurostat database in October 2014.
15 For more details see: European Commission (2014c) 30
40 50 60 70 80 90 100
2004 2005 2006 2007 2008 2009 2010 2011 2012 2013
EU28 BG CZ EE LV LT HU PL RO SI SK
Figures 4-9: Regional development in the six bigger EU10 countries (2003-2011)
NUTS2 regionsSource: Eurostat 100 2030 4050 6070 8090 100110
Lódzkie Mazowieckie Malopolskie Slaskie Lubelskie Podkarpackie Swietokrzyskie Podlaskie Wielkopolskie Zachodniopomorskie Lubuskie Dolnoslaskie Opolskie Kujawsko-Pomorskie Warminsko-Maz. Pomorskie
Poland
2003 2011
200 4060 10080 120140 160180
Czech Republic
2003 2011
0 20 40 60 80 100 120
Hungary
2003 2011
200 4060 10080 120140 160180 200
Bratislavský
kraj Západné
Slovensko Stredné
Slovensko Východné Slovensko
Slovakia
2003 2011
0 20 40 60 80 100 120 140
Romania
2003 2011
100 2030 4050 6070 80
Bulgaria
2003 2011
The third indicator is wage convergence. In this respect a lot remains to be done to reach levels comparable to Western European standards. While prices of many commodities and services have become similar in the new member states to those in the old ones, average earnings are still lagging well behind. Figure 10 demonstrates the rather striking gap, while it also indicates a slow catching up in this respect too. Namely, the average income of the EU10 citizens was less than one fifth of EU average in 2004, which actually went up to nearly one third of it by 2012. Within the EU10 the discrepancies are also high: in harmony with national development levels, Slovenia is leading the group with nearly four times the sums earned by Bulgarians. In the middle range can be found the Czech Republic, Estonia and Slovakia, followed by Poland, Hungary, the other two Baltic states and Romania.
Figure 10: Net annual earnings
euroSource: Eurostat (data missing for Estonia in 2004-06 and 2009, for Slovenia and Slovakia in 2004-06)
Trends of growth and competitiveness
The early 2000s could be characterised by high growth rates in the Central and Eastern European region, and the accession to the European Union just reinforced them in most of the EU10 countries (Figure 11). From the eight countries that joined in 2004, only Hungary took a sharp downward trend while – after some slowing in 2005 – Poland and Slovenia continued to enjoy dynamic growth, similarly to all the other newcomers. In Hungary this failure was due to internal factors (the mismanagement of public finances and the lack of a coherent economic policy) while the European and global environment continued to be a favourable one. According to Eurostat data series,16
The region was severely hit by the financial and economic crisis, with very different recession rates however.
While after overheated growth rates, the Baltic states suffered from a dramatic, double-digit shrinkage of their economies in 2009,
growth in the EU10 in the first years of membership was driven by all three components of it:
consumption, investments and exports; even if to different extents in each country.
17
16 Eurostat: http://epp.eurostat.ec.europa.eu/portal/page/portal/national_accounts/data/main_tables
17 About the specificities of the Baltic developments in the past ten years see: Meisel (2014).
the others were between -7.9% (Slovenia) and -4.5% (Czech Republic). The only country to avoid negative growth was Poland, thanks to its robust internal market and lower exposure to external effects.
0 2000 4000 6000 8000 10000 12000 14000
2004 2005 2006 2007 2008 2009 2010 2011 2012
EU27 BG CZ EE LV LT HU PL RO SI SK
Getting out of the crisis and resuming economic growth has been happening at a different pace across the region.
At the same time, Figure 11 shows a steady convergence of growth rates for 2014-2015, with an unprecedented narrowing of the gaps among the members of the EU10. In general, economic expansion is mainly due to exports, while sluggish investments are boosted by accelerated absorption of EU funds. At the same time, private consumption recovers only slowly in most of the EU10.18
Source: Eurostat
Figure 11: Real GDP growth rate
percentThe trends of the current account balances demonstrate well the economic performance and external competitiveness of the EU10 countries. Figure 12 clearly shows a split of the EU10 into two groups between accession and the crisis: the better performer four Visegrad countries and Slovenia on the one hand, and Estonia, Latvia, Lithuania, Romania and Bulgaria (accumulating huge deficits) on the other. While the former group benefited from better economic structures coupled with higher added value of their exports,19
18 Eurostat: http://epp.eurostat.ec.europa.eu/portal/page/portal/national_accounts/data/main_tables
19 IMF (2014), p. 36.
the latter group suffered from structural weaknesses and a greater import dependency to satisfy consumption.
The crisis, however, put an end to those sharp differences as – thanks to shrinking domestic demand – imports of goods and services fell considerably across the region, resulting even in current account surpluses or just small deficits. According to the figures for the past few years, the EU10 countries seem to have more harmonious and well manageable current account positions than ever before since 2004. It remains to be seen however, whether these favourable trends will remain in place in the post-crisis period. Namely, the challenge is not only the potentially strengthening demand for imports, coupled with the lack of dynamism on the EU10’s traditional export markets, but also – as a side effect of economic recovery – the increased profit repatriation of foreign companies (which is usually the biggest in Poland and the Czech Republic).
-20 -15 -10 -5 0 5 10 15
2004 2005 2006 2007 2008 2009 2010 2011 2012 2013 2014 2015
EU28 BG CZ EE LV LT HU PL RO SI SK
Figure 12: Balance of the current account
percent of GDPSource: Eurostat
Another important indicator of competitiveness is labour productivity (see Figure 13). In this respect, the performance of the EU10 countries reflects their development levels and trends.
Figure 13: Labour productivity per person employed
EU27=100Source: Eurostat
While Slovenia and the Czech Republic used to have the highest productivity levels in the first years of membership, in the past few years their performance has been stagnating or even declining respectively. At the same time, the Baltic states exhibited a spectacular catching up of over 20 percentage points between 2004 and 2013 as compared to the EU average. All the other EU10 countries showed a considerable – over 10 percentage points – improvement too, with the exception of Hungary which advanced only modestly. As a result of those developments, the initial gap among the eight countries that joined in 2004 has narrowed significantly, with a clear catching up by them to the EU average (being roughly at around 75% of it in 2013). At the same time, the productivity levels of Romania and Bulgaria are still lagging well behind the rest of the group, hardly reaching half of the EU average.
-30 -25 -20 -15 -10 -505 10 15
2004 2005 2006 2007 2008 2009 2010 2011 2012 2013 2014 2015
EU28 BG CZ EE LV LT HU PL RO SI SK
30 40 50 60 70 80 90 100
2004 2005 2006 2007 2008 2009 2010 2011 2012 2013
EU27 BG CZ EE LV LT HU PL RO SI SK
Finally, from the point of view of competitiveness it is also relevant to evoke the innovation performance of the EU10. The European Commission publishes each year the complex index (composed of 25 indicators) of the EU countries’ performances (including among others the gross expenditure on research and development, the contribution to innovation by the enterprise sector, the number of patent applications or that of new doctorate graduates).20 Based on the results the countries can be grouped into four categories. None of the EU10 can be found in the group of the so-called innovation leaders, but the innovation followers already embraced two countries of the EU10 in the past few years, namely Estonia and Slovenia. To the third group of moderate innovators belong the four Visegrad countries and Lithuania, while the fourth category of modest innovators had Latvia as well as the two Balkan countries. Behind the absolute figures, however, it is also important to take into account the pace of development, and in this respect, besides the outstanding improvement of the three Baltic states and Slovenia, the Bulgarian and Hungarian performance can be praised too. Romania, the Czech Republic and Slovakia had just a modest improvement, while Poland reached the lowest growth rate in this field in the past eight years.
Table 2: Innovation index
Country 2006 2007 2008 2009 2010 2011 2012 2013 Growth
rate
Bulgaria 0.158 0.168 0.189 0.198 0.232 0.234 0.191 0.188 2.49
Czech Republic 0.374 0.390 0.369 0.374 0.411 0.416 0.405 0.422 1.72
Estonia 0.388 0.382 0.411 0.452 0.453 0.474 0.488 0.502 3.74
Latvia 0.174 0.188 0.195 0.208 0.216 0.228 0.234 0.221 3.51
Lithuania 0.241 0.254 0.233 0.239 0.24 0.260 0.271 0.289 2.58
Hungary 0.298 0.303 0.314 0.315 0.341 0.344 0.335 0.351 2.36
Poland 0.263 0.275 0.265 0.276 0.272 0.282 0.268 0.279 0.88
Romania 0.208 0.219 0.242 0.257 0.240 0.258 0.229 0.237 1.90
Slovenia 0.427 0.431 0.458 0.474 0.481 0.508 0.495 0.513 2.66
Slovakia 0.296 0.302 0.304 0.312 0.299 0.304 0.35 0.328 1.49
Source: European Commission (2014d)
Public finance and monetary trends
Concerning the fiscal position of general governments, it can be established that between 2004 and 2008 most of the EU10 made considerable efforts to consolidate their public budgets and bring the deficit below 3% of GDP (while Estonia and Bulgaria continued to run budget surpluses each year). Only two countries had a deteriorating trend prior to the crisis: Romania which, however, still remained below -3% until 2007, and Hungary. The latter country was (together with Poland in the first few years of membership) under excessive deficit procedure from the outset. Hungary actually accumulated a huge public deficit of over 9% by 2006 (see Table 3), which then had to be rectified just on the eve and then in the middle of the financial and economic crisis. This meant for Hungary a “straightjacket” and, due to an IMF-EU loan package, almost no room of manoeuvre to conduct a loser budgetary policy coupled with increased public debt – as was the case for all other EU10 countries.
20 The European Commission’s “Innovation Union Scoreboards” can be retrieved here:
http://ec.europa.eu/enterprise/policies/innovation/policy/innovation-scoreboard/index_en.htm
The years of 2008, and especially 2009-2010 have been the worst for the group: a period when only Estonia could avoid the excessive deficit procedure. In parallel with the improvement of the economic situation across the EU10 from 2010 onwards (which was however not linear in any of them) their budgetary positions seemed to follow suit too. Thanks to serious consolidation programmes, in 2013 only Poland and Slovenia had a bigger-than 3% budget deficit: the former having a 4.3% level, while the latter – due to a one-off bank recapitalisation package21 – accumulated an unprecedented deficit of nearly 15% of GDP. With these figures eight of the EU10 had a better performance than the Union average of -3.3% public budget position of that year. The years 2014 and 2015 seem to bring about overall public finance stability in the region, in both years only Slovenia breaching the Maastricht limit but with a sharply improving trend.
Table 3: General government deficit/surplus
percent of GDPCountry 2004 2005 2006 2007 2008 2009 2010 2011 2012 2013 2014 2015
EU28 -2.9 -2.5 -1.5 -0.9 -2.4 -6.9 -6.5 -4.4 -3.9 -3.3 -2.6 -2.5
Bulgaria 1.9 1.0 1.9 1.2 1.7 -4.3 -3.1 -2 -0.8 -1.5 -1.9 -1.8
Czech Republic -2.8 -3.2 -2.4 -0.7 -2.2 -5.8 -4.7 -3.2 -4.2 -1.5 -1.9 -2.4
Estonia 1.6 1.6 2.5 2.4 -3.0 -2.0 0.2 1.1 -0.2 -0.2 -0.5 -0.6
Latvia -1.1 -0.4 -0.6 -0.7 -4.4 -9.2 -8.2 -3.5 -1.3 -1.0 -1.0 -1.1
Lithuania -1.5 -0.5 -0.4 -1.0 -3.3 -9.4 -7.2 -5.5 -3.2 -2.2 -2.1 -1.6
Hungary -6.5 -7.9 -9.4 -5.1 -3.7 -4.6 -4.3 4.3 -2.1 -2.2 -2.9 -2.8
Poland -5.4 -4.1 -3.6 -1.9 -3.7 -7.5 -7.8 -5.1 -3.9 -4.3 5.7 -2.9
Romania -1.2 -1.2 -2.2 -2.9 -5.7 -9.0 -6.8 -5.5 -3.0 -2.3 -2.2 -1.9
Slovenia -2.3 -1.5 -1.4 0.0 -1.9 -6.3 -5.9 -6.4 -4.0 -14.7 -4.3 -3.1
Slovakia -2.4 -2.8 -3.2 -1.8 -2.1 -8.0 -7.5 -4.8 -4.5 -2.8 -2.9 -2.8
Source: Eurostat (forecast for 2014, 2015)
Analysing the national measures taken to restore public finance stability, we can find – on the basis of the EU10 governments’ Stability/Convergence Programmes between 2011 and 201422
21 The biggest part of the banking sector’s recapitalisation was done in 2013, exceeding 10% of GDP in that year, while the operation stretched over to 2014 with a remaining nearly 1%/GDP.Stability Programme of Slovenia, 2014
http://ec.europa.eu/europe2020/pdf/csr2014/sp2014_slovenia_en.pdf, p. 21.
22 Those documents can be retrieved here:
http://ec.europa.eu/economy_finance/economic_governance/sgp/convergence/index_en.htm
– a range of similar steps on both the revenue and expenditure side. Starting with the revenue side, among the most typical measures were rising VAT rates coupled with the abolishment of some types of VAT deductibility. Secondly, there was a significant increase of excise duties in all of the EU10. A third common element in the region has been the fight against tax evasion and fraud, combating the grey economy and improving the efficiency of tax collection. On the expenditure side, the most typical measures included a freeze and/or cuts of public sector wages (the Romanian case being the severest with a 25% reduction) coupled with downsizing (or hiring freeze) and reduced government consumption.
Many governments have also revised the national system of pensions and social transfers too. In the field of pensions the general trend has been to gradually increase the retirement age (also linked to demography and longer life expectancy) together with thorough revisions and restrictions of early retirement schemes. Pension indexation freeze took place in some countries too, but only temporarily, for the worst years of the crisis. In one
way or another, social benefit cuts (including unemployment benefit revision, sickness or family-related allowances) were also undertaken in the region. At the same time, the differences must be highlighted too, as they reflect some country-specific approaches and solutions to the problems. In a simplified way Table 4 summarises the most important measures that were taken by the individual governments in the past five years including the conventional/similar and the non-conventional/dissimilar steps.
Table 4: Main anti-crisis fiscal measures in the EU10 (2011-2014)
Revenue side BG CZ EE LV LT HU PL RO SI SK
VAT hike (or at least revised deductibility) ● ● ● ● ● ●
Excise duty hike ● ● ● ● ● ● ● ● ● ●
Combating tax-evasion/improving tax collection ● ● ● ● ● ● ● ● ● ●
Increase in social security contributions ● ● ●
New energy-related fee ● ● ● ●
Broadened base for personal income tax ●
Crisis personal income tax ●
Rising corporate income tax ●
New or higher real estate type tax ● ● ● ● ●
Special measures on lottery or gambling ● ● ●
Full/partial elimination of the private pension pillar23 ● ● ●
Bank levy and/or financial transaction duty ● ● ●
Sale of carbon emission rights ● ● ● ●
Sale of frequencies ● ●
Sale of emergency oil stocks ●
Privatisation ●
Special sectoral taxes ● ● ● ●
Expenditure side BG CZ EE LV LT HU PL RO SI SK
Freeze/cuts in public sector wages ● ● ● ● ● ● ● ● ● ●
Freeze/cuts in social benefits ● ● ● ● ● ●
Freezing/lower indexation of pensions ● ● ● ● ●
Increasing of retirement age ● ● ● ● ● ● ● ● ● ●
Cuts in government consumption ● ● ● ● ● ● ● ● ● ●
Cuts in government investment ● ● ● ● ● ●
Cuts is subsidies to public companies/agriculture ● ● ● ●
Debt assumption of local governments ●
Recapitalisation of banks ●
Capital injection into a development bank ●
Wage increase in some public services ● ● ●
Source: Stability/Convergence Programmes of EU10, 2011-2014
When looking at the public debt figures of the EU10 (Table 5) it is obvious that they all entered the Union with levels below the Maastricht threshold. In fact, up until the crisis the only problematic new member state in this
23 Several EU10 countries introduced the mandatory private pension pillar. Of them Poland and Slovakia decided to eliminate it partially, while Hungary opted for its full abolishment, and – based on a decision in autumn 2014 – the Czech Republic will do the same by 2016.
respect has been Hungary where indebtedness took an alarming trend after accession, in parallel with the accumulation of an unprecedented public deficit by 2006. The other country with a growing and the second highest debt was Poland, which despite the crisis, never reached the 60% limit. The remaining eight new members had really low and well manageable debt levels in EU comparison (e.g. below 30% of GDP in all of them in 2008). The reasons for those positive results were partly historic (e.g. the Baltic states did not inherit any debts from soviet times, or Romania not taking up any during the communist era) and partly reflected lasting prudential fiscal policies (e.g. again Estonia or also Bulgaria running budgetary surpluses).
The crisis however had a devastating impact on the gross debts of many EU10 governments. The debt-to-GDP ratio rose between 2008 and 2014 by about 10 percentage points in Bulgaria, 15 in the Czech Republic, 20 in Latvia, more than 25 in Lithuania and Romania, nearly 30 in Slovakia and nearly 60 (!) in the case of Slovenia (see Table 5). Even though these trends are disquieting, the EU10 group still remains well below the EU average under this indicator; with only Hungary and Slovenia having a ca. 80% level, which in the former is expected to decline again from 2015, while in the latter from 2016 onwards.24
Table 5: General government gross debt
percent of GDPCountry 2004 2005 2006 2007 2008 2009 2010 2011 2012 2013 2014 2015
EU28 62.1 62.6 61.4 58.8 62 74.4 79.9 82.4 85.2 88.9 89.5 89.2
Bulgaria 37.0 27.5 21.6 17.2 13.7 14.6 16.2 16.3 18.4 18.9 23.1 22.7
Czech Republic 28.9 28.4 28.3 27.9 28.7 34.6 38.4 41.4 46.2 46.0 44.4 45.8
Estonia 5.0 4.6 4.4 3.7 4.5 7.1 6.7 6.1 9.8 10.0 9.8 9.6
Latvia 15.0 12.5 10.7 9.0 19.8 36.9 44.5 42.0 40.8 38.1 39.5 33.4
Lithuania 19.3 18.3 17.9 16.8 15.5 29.3 37.8 38.3 40.5 39.4 41.8 41.4
Hungary 59.5 61.7 65.9 67.0 73.0 79.8 82.2 82.1 79.8 79.2 80.3 79.5
Poland 45.7 47.1 47.7 45.0 47.1 50.9 54.9 56.2 55.6 57 49.2 50.0
Romania 18.7 15.8 12.4 12.8 13.4 23.6 30.5 34.7 38.0 38.4 39.9 40.1
Slovenia 27.3 26.7 26.4 23.1 22.0 35.2 38.7 47.1 54.4 71.7 80.4 81.3
Slovakia 41.5 34.2 30.5 29.6 27.9 35.6 41.0 43.6 52.7 55.4 56.3 57.8
Source: Eurostat (forecast for 2014, 2015)
In line with the new rules on sound public finances, and especially the Fiscal Compact25 – to which nine of the EU10 are signatory parties26
Public indebtedness can be linked to at least two risk factors. The share of foreign currency denominated debt in total debt
– budgetary stability and fight against public debts gradually become part of the national legal framework too.
27
24 Stability Programme of Slovenia, 2014: http://ec.europa.eu/europe2020/pdf/csr2014/sp2014_slovenia_en.pdf
25 Treaty on Stability, Coordination and Governance in the Economic and Monetary Union (TSCG) – an intergovernmental treaty focusing on the balanced budget rule with a maximum 0.5% structural deficit, on the systematic cutting back of public debts and on the introduction of the debt brake rule into national constitutions (or high level laws).
26 In spring 2014, the new Czech government also expressed its willingness to join soon, but the parliament did not endorse it yet by October 2014.
27 Eurostat:
http://epp.eurostat.ec.europa.eu/statistics_explained/index.php/File:Central_government_gross_debt_by_currency_of_issuance,_2013.png
is the highest in Lithuania (80%), followed by Bulgaria (70%), Romania (55%), Hungary (40%), Poland (30%), and the Czech Republic (20%). This problem is minimal in Slovakia and practically non-existent in
Slovenia, Estonia and Latvia. It must also be added, that from these six countries only those four are exposed to exchange rate volatility which – having most of their debts in euros – are not acceding to the eurozone (like Lithuania in 2015) or do not have a fixed exchange rate system (like Bulgaria having the currency board system).
Thus, devaluation and a mechanic increase of debt payments is a threat in a diminishing order in Romania, Hungary, Poland and the Czech Republic.
Figure 14: EMU interest rates
percentSource: Eurostat (no data for Estonia, missing data for Romania in 2004-05)
Besides the exchange rate uncertainties another burden on governments’ debt service is the price of borrowing.
The EU10 are overwhelmingly reliant on government bonds and securities (with the exception of Estonia and also Latvia where loans are predominant or at least above 50% respectively).28
28 Eurostat: http://epp.eurostat.ec.europa.eu/statistics_explained/index.php/Structure_of_government_debt
In this respect, an important indicator is the rate of the 10-year maturity bonds, whose convergence to the average of the lowest-inflation countries is one of the pre-conditions for joining the euro area. As Figure 14 shows, prior to the crisis, most of the EU10 countries have been close to the roughly 4% of EU average, with the exception of Romania and Hungary which used to have much higher rates. The crisis had an extremely negative impact on the interest levels of those non- eurozone countries which suffered the deepest economic recession in 2009, namely Latvia, Lithuania, Hungary, Romania and Bulgaria. In the following years however a gradual convergence back to lower levels has been taking place (but Hungary, Romania and recently also Slovenia are still leading the group being at the double of the EU average in 2013).
Interest rates are of course closely linked to money supply and price developments in general. As Figure 15 clearly demonstrates, the EU10 countries could be characterised as a high-inflation region between 2004 and the crisis, mainly due to their dynamic – in many cases overheated – post-accession growth rates. As one of the few benign effects of the crisis (shrinking demand) however, the harmonised indices of consumer prices have been declining and are forecasted to remain at around 2% in 2015 for the whole group.
0 2 4 6 8 10 12 14
2004 2005 2006 2007 2008 2009 2010 2011 2012 2013
BG CZ LV LT HU PL RO SI SK EU27