1
Spillovers from Foreign Direct Investment in Central and Eastern Europe
1An index for measuring a country’s potential to benefit from technology spillovers
Balázs Szent-Iványi
Researcher, Department of World Economy, Corvinus University of Budapest E-mail: balazs.szentivanyi@uni-corvinus.hu
Gábor Vigvári
Assistant professor, Department of World Economy, Corvinus University of Budapest
In the paper, we construct a composite indicator to estimate the potential of four Central and Eastern European countries (the Czech Republic, Hungary, Poland and Slovakia) to benefit from productivity spillovers from foreign direct investment (FDI) in the manufacturing sector.
Such transfers of technology are one of the main benefits of FDI for the host country, and should also be one of the main determinants of FDI incentives offered to investing multinationals by governments, but they are difficult to assess ex ante. For our composite index, we use six components to proxy the main channels and determinants of these spillovers. We have tried several weighting and aggregation methods, and we consider our results robust. According to the analysis of our results, between 2003 and 2007 all four countries were able to increase their potential to benefit from such spillovers, although there are large differences between them. The Czech Republic clearly has the most potential to benefit from productivity spillovers, while Poland has the least. The relative positions of Hungary and Slovakia depend to some extent on the exact weighting and aggregation method of the individual components of the index, but the differences are not large. These conclusions have important implication both the investment strategies of multinationals and government FDI policies.
Keywords: productivity spillovers, technology transfer, investment incentives, foreign direct investment, Central and Eastern Europe
JEL-codes: F23, L24
1 The research was supported by the following grant: TÁMOP-4.2.1.B-09/1/KMR-2010-0005, co-financed by the European Social Fund.
2 1. Introduction
Foreign direct investment can have a multitude of effects on the host country, both positive and negative, with the net effects being highly dependent on the characteristics of the host country, the investing firm and the investment itself. There is wide agreement in the literature on effects of foreign direct investment (FDI), that the most important long term benefit from such investments are technology (productivity) spillovers to domestic firms. Domestic firms can profit from the increased presence of foreign-owned subsidiaries in an economy through several channels. Technology (both hard and soft) can be transferred, either formally or informally from the subsidiaries of multinational corporations (MNC’s) to locally owned companies, increasing their competitiveness and productivity. These spillovers are of course not automatic, their existence and relative strength is determined by a number of factors.
There is a major reason why estimating the possible extent of productivity spillovers in host countries ex ante, i.e. before a foreign investment actually happens, can be important.
According to the literature, the extent of technology spillovers should be the main determinant of the amount of investment incentives (i.e. direct cash transfers and tax breaks) a country offers to an investing firm (Blomström & Kokko 2003). Expected productivity spillovers should be made a major part of cost-benefit calculations that governments do before deciding on the size of the investment incentive that they offer to a foreign company. Often however, governments only concentrate on direct budgetary expenses and returns. The question is especially important in the Central and Eastern European, where countries frequently compete with each other for the same investments. Having some idea of the expected productivity benefits an investment is likely to bring can help these countries to gauge more accurately the amount of incentives they should offer a foreign investor.
The current paper attempts to construct a simple composite indicator (the Spillover Potential Index) which can help governments in this task, and also provide information to investing multinationals on the expected size of investment incentives a country may offer them, relative to other countries. The value of the index is calculated for four Central and Eastern European countries, the Czech Republic, Hungary, Poland and Slovakia, the methodology and data used however allow easy extension to other countries and regions as well. Due to issues with data availability, we were only able to calculate the index for the years between 2003 and 2007. As foreign direct investment is highly heterogeneous (Cohen 2007), we restrict the scope of our index to FDI in the manufacturing sector.
3
The paper contributes to the literature by building an indicator with which the potential of countries for benefitting from foreign direct investment in the manufacturing sector can be assessed before the investment actually happens. We have no knowledge of any similar previous research. Our results indicate that between 2003 and 2007 all four countries have been able to increase their potential to benefit from foreign direct investment. A surprising result however, is that there are large differences between the four countries: the Czech Republic is the country which may benefit the most from manufacturing FDI in the form of technology spillovers to domestic, and Poland seems to be lagging behind. The relative positions of Hungary and Slovakia depend to some extent on the exact method with which the components of the index are weighted and aggregated, but these differences are not large and so we consider our index robust. MNC’s should therefore clearly diversify their investment strategies towards the CEE region, instead of treating the countries as a homogenous group.
The remainder of the paper is composed as follows. Section 2 provides an overview of the theoretical literature on the channels and determinants of productivity spillovers and thus provides the theoretical background for our composite indicator. Section 3 reviews the empirical literature which tries to measure (ex-post) the extent of spillovers in the Central and Eastern European countries. Section 4 describes the data and methodology used for creating the Spillover Potential Index, and section 5 presents the indicator’s values and discusses the results. Section 6 concludes the paper.
2. Channels and determinants of spillovers
Foreign direct investment is undoubtedly the most import channel of international technology transfer (Damijan et al. 2003). Foreign companies can bring hard or soft technology with them which may not be available in the host country. The question however is how the technology can spread from the MNC affiliates to local companies. The identification of channels through which such technology spillovers can happen has received much attention in the literature and rightfully so, because appropriate knowledge of these channels is the cornerstone for any empirical work. This section briefly reviews the main channels and the factors that determine how important each of these channels are.
Many authors have classified the channels and the factors that can enhance (or discourage) technology transfer in many different ways. Görg and Greenaway (2003) for example
4
differentiate four potential channels; Blomström et al (1999) use a demand and supply framework as an attempt to create a conceptual framework for determining the strength and relevance of each channel. Blalock and Gertler (2008: 403) identify three main channels, while Kokko (1994) talks about four. As it is not the goal of this paper to provide a comprehensive review of the literature, in the following we simply list and briefly elaborate the most important channels and determinants and refrain from using any classification.
Under channels we mean those processes which mediate the transfer of technology from one firm to another. Spillover determinants on the other hand refer to factors which determine the intensity of each channel. The main spillover channels identified in the literature are the following:
Imitation: affiliates of MNC’s can have effects on their competitors, who, in order not to lose their competitiveness, may try to imitate the technology, management, marketing or other methods used by the affiliates. Learning by watching, “poaching”
employees, reverse engineering of MNC products are all examples of the possibilities that competitors have to gain access to technology (Kokko 1994; Görg & Greenaway 2003). Imitation usually leads to intra-industry (or horizontal) spillovers.
Vertical linkages: a more formal channel for technology transfer can occur between local suppliers and MNC affiliate buyers. MNC’s can clearly find it in their interest to help increase the competitiveness and quality of their suppliers, and they can do so either making their technology available to them, or by providing strong incentives for them to adapt (Kokko 1992). Transfers of technology through such linkages are referred to as inter-industry spillovers.
Movement of employees: people working at an MNC affiliate can move to new companies or start their own firms. The knowledge they have gathered during their time at the affiliate is of course taken within and will contribute to increasing the competitiveness of the firm where they end up at (Kokko 1992; Aitken & Harrison 1999). The movement of employees can lead to both intra- and inter-industry spillovers.
Furthermore, the entry of MNC’s to the host market can stimulate the entry of foreign service providers such as consultancy, auditing and other professional service providing firms, which may also promote local competiveness (Blalock & Gertler 2008: 403).
5
In most host economies probably all the channels mentioned above are at work to some degree, but the level of technology transfer that actually happens depends on a number of factors (Blomström et al. 1999). Spillovers are not automatic. In fact, there are a number of variables, themselves complexly interrelated, which determine how strong each channel can be. What follows is a brief overview of these determinants.
The level of competition and the structure of the host market have important effects on the amount of imitation that actually happens. The fiercer the competition is, the more incentives local companies have to innovate, or at least keep up with the pace of foreign affiliates through imitation. Strong competition may mean strong incentives for local companies to get a hold of the technologies used by potentially more competitive MNC affiliates. In highly competitive environments, locals firms ignoring foreign technology can face severe consequences such as decreasing market share (Blomström et al. 1999). A higher level of domestic competition may also provide MNC’s with incentives to transfer more technology to their affiliate on the market in order to give it a competitive edge. The size of the host market is also important. A larger market means higher demand for products embodying higher level technology, and can thus also create an incentive for MNC’s to transfer higher level technology to their affiliates. Market size can also be a proxy for the number of domestic companies competing with the MNC affiliate.
Closely related are the technological competencies of host country firms, which determine how likely they are to be able to adopt foreign technology. This includes competencies of both MNC affiliate suppliers and competitors, but in a wider sense it can also relate to the level of technology used on the host market (Damijan 2003), or the ability of local firms to innovate. The level of technology available on the host market can be an important determinant from another perspective as well. Higher levels of technology may mean greater incentives for MNC’s to transfer more technology to the market, in the hope of getting access to local technology in exchange (such as through participation in joint research centers). In a similar fashion, the capacities of employees to learn and adopt new technologies are also a key determinant. The level of human capital (and also social and cultural factors) in the host country and the types of workers MNC affiliates typically employ will have important effects on how important channel the movement of employees actually are.
6
The amount, type and intensity of vertical linkages between domestic firms and foreign affiliates are crucial. Do foreign affiliates have meaningful contacts with local suppliers, or do they source most of their components through imports, as is often case in developing countries. Another issue is related to what foreign affiliates buy from local companies. For example, if local companies typically supply low value added inputs to MNC affiliates, then the possibilities for technology transfer will be much more limited as compared to a situation where they supply complex components, perhaps even co-designed together with the MNC.
The level and enforcement of intellectual property rights protection on the host market determines the legal instruments MNC affiliates actually poses to guard their proprietary technology. These regulations can restrict for example imitation by competitors, although much depends on the nature of the technology. In the long term, technology cannot be monopolized, regardless of regulation. Besides IPR protection, other government policies may also be important. Governments may provide explicit incentives for MNC’s to transfer technology, at least to their affiliates. Many countries provide special investment incentives for high technology (such as R&D) investments, and also incentives (and in some cases administrative requirements) for the MNC’s to work together with domestic companies or research institutions through joint venturing, partnerships etc.
The extent to which a country can benefit from productivity spillovers therefore depends on a multitude of factors, related to the characteristics of the host country, the specific industry, the investing firm and the investment itself. Before we turn to selecting the proxies which can measure these channels and determinants, we first briefly overview the empirical literature on technology spillovers in Central and Eastern Europe to get an idea which channels are the most important in the region.
3. Spillovers in Central and Eastern Europe – empirical evidence
In the past decades a large body of literature has emerged attempting to measure the extent of spillovers in developed, emerging and developing economies alike. Most studies use firm- level data and try to empirically estimate production functions, using right hand side variables which can serve as proxies for spillovers. Clearly, finding such proxies is not an easy task, as spillovers have numerous channels and determinants. In early studies proxies like the share of foreign ownership in the firm’s industry were used. One can argue however that such a proxy can only capture a certain aspect of spillovers, such as horizontal spillovers. More recent
7
studies therefore also try to construct measures for vertical spillovers, including both forward and backward linkages with foreign owned firms in other industries. This approach, while it undoubtedly can serve as a proxy for spillovers through direct firm contacts and is relatively easy to calculate using national input-output tables, still cannot capture the full extent of spillovers, as it neglects at least one other important channel, the movement of employees.
Therefore, no proxy has emerged in the empirical literature that can capture all channels and determinants of spillovers.
Most studies on spillovers in the Central and Eastern European region have found some evidence on their existence. The results concerning the exact channels and strength of the spillovers however are relatively mixed, and it is difficult to draw any conclusions on the actual extent of such technology transfer.
In one of the most comprehensive studies on the region, Damijan et al. (2003) use a large panel dataset covering ten transition countries and sophisticated econometric methods. They find that the most significant channel for technology transfer is that between parent companies and their local affiliates. They find more limited evidence for horizontal and vertical spillovers, limited to just a few countries. They also conclude that the size of vertical spillovers is much larger than horizontal spillovers. It is therefore clear that MNC’s do transfer technology to their affiliates in the CEE countries, but in many cases the technology remains “stuck” within the affiliate and locally owned companies seem to benefit less. They also emphasize that there are significant differences between countries in the exact channels through which the spillovers operate.
Individual country level studies seem more common in the literature than comprehensive regional ones. Djankov and Hoekman (2000) find results similar to Damijan et al. (2003) in case of the Czech Republic: it is mostly firms with foreign ownership who benefit. Kolasa (2007) studies the extent of spillovers in Poland. He concludes that locally owned firms do benefit from foreign presence, and he finds evidence for both vertical and horizontal spillovers. However, he notes that the extent of such spillovers highly depends on the absorptive capacity of the local companies, as well as competitive pressures and market concentration. In a widely cited study, Javorcik (2004) uses Lithuanian firm level data and finds evidence on vertical spillovers, but none on horizontal ones. She also notes that these productivity benefits are mostly associated with firms which are only partially foreign owned,
8
as they are more likely to undertake local sourcing. Schoors and van der Tol (2002) analyze spillovers in Hungary and find robust evidence on their existence. Similarly to Javorcik (2004), they note that spillovers between sectors are more important than horizontal ones.
They also find that the absorptive capacities of local firms and the degree of openness of the sector are key determining factors.
Javorcik and Spatareanu (2008) examine Romanian firms and they find that partially foreign- owned projects are correlated with the higher productivity of domestic firms in upstream industries. However, fully foreign owned firms do not cause such spillovers. The authors argue that the reason for this is that partially foreign owned firms are more likely to contract with local firms. Also, fully foreign owned firms may use more sophisticated technology, the adaptation of which may be more difficult for local companies. This study therefore also points to mixed evidence.
Some papers do reach conclusions that spillovers are either not present in the CEE countries, or negative spillovers dominate. Using a firm level panel dataset, Konings (2001) examines the extent of spillovers in Poland, Bulgaria and Romania. He comes to the conclusion that there is no evidence of technology spillovers to domestic firms in Poland, and in Romania and Bulgaria foreign firms tend to have negative effects on domestic ones. He argues that in the latter two countries negative competition effects caused by more efficient foreign affiliates seem to be dominant.
Instead of using econometric methods, another strand in the literature relies on corporate surveys. To our knowledge, not much empirical work using such surveys has been carried out among the CEE countries. Javorcik’s paper (2008) reviews the results of such surveys carried out in the Czech Republic and Latvia. According to these surveys, corporate executives do view the presence of foreign owned firms as a factor that can increase their own productivity.
According to these survey, executives believe that spillovers can happen both within industries and also vertically through upstream or downstream linkages.
It is not easy to draw any general conclusions from such a wide literature with such mixed results. The results of the empirical investigations on spillovers in the CEE countries yield just as ambiguous results as the studies carried out in other regions (Rodrik 1999: 37). However, some conclusions do emerge, the most important one underlines the theoretical conclusions:
9
much depends on the specific characteristics of the host country, the industry and the investment. More advanced countries in the CEE region, such as Poland, the Czech Republic or Hungary do seem exhibit positive spillovers, while the case of other countries (such as Romania or Bulgaria) is less clear. There also seems to be some degree of consensus on the fact that vertical linkages seem to be more important that horizontal effects, such as competitive pressures and imitation. As Javorcik (2008) notes, “[t]he relative magnitudes of these channels depend on host country conditions and the type of FDI inflows, which explains the seemingly inconsistent findings of the literature.”
Based on the theoretical and empirical observations, we now turn to describing the proxies and methods used to construct the Spillover Potential Index.
4. Data and methodology
4.1. Components of the index and data sources
Due to the nature of the channels and determinants of productivity spillovers, discussed in section 2, it is not easy to find perfect measures which can accurately give information on what role the various determinants play in transferring knowledge and technology in a country’s manufacturing industry. Finding good proxies for these determinants, for which comparable time series data are available for the Czech Republic, Hungary, Poland and Slovakia is not an easy task and involves a number of compromises. Under the manufacturing sector, we mean the following industries: machinery and equipment, office machinery and computers, electrical machinery and apparatus, radio, television and communication equipment and apparatus, medical, precision and optical instruments, watches and clocks, motor vehicles, trailers and semi-trailers, other transport equipment (NACE codes 29-35).
Based on the channels and determinants of spillovers discussed in section 2, we have chosen six indicators which form the components of the Spillover Potential Index. In this subsection we present and justify these six components and also discuss their limitations.
In order to proxy market size and level of competition we use GDP per capita (variable code:
gdp) of the host county, from the Penn World Tables (Heston, Summers & Aten 2011). We enter this component into our indicator in constant prices. GDP per capita is probably the best indicator for purchasing power and market size on the macro level, and is correlated with the intensity of competition (Melitz & Ottaviano 2008). Other proxies for the latter (such as
10
concentration indices) are not available on such highly aggregate levels as the entire manufacturing industry of country, or their aggregation would raise many methodological questions, so we decided to refrain from using them. True, the level of GDP per capita in a country is correlated with many factors, and may reflect these other factors instead. We will deal this issue in the robustness checks of the index.
The potential for intra-industry spillovers are measured as the share of industry output provided by foreign owned companies (code: intra). The data were calculated for each manufacturing industry (on the two digit NACE-level), then averaged for all industries, using the relative share of the industry in manufacturing’s total output as weights. The data are from Eurostat’s Structural Business Statistics. We argue that this is a good proxy, as the more foreign companies are present in an industry, the more domestic companies are used to them, able to compete with them, and have incentives to imitate them, or perhaps enter into strategic alliances or other partnerships with them. Our choice was also guided by the fact that similar proxies have been used in the empirical literature measuring the extent of spillovers (see for example Blalock & Gertler 2008).
To capture inter-industry spillovers, we constructed an indicator which proxies vertical linkages between firms in different industries (code: inter). We calculated the share of domestic inputs in the total inputs used by an industry (on the NACE 2 digit level), and averaged these values for all manufacturing industries under scrutiny. The data used are from national input-output tables, available from Eurostat. As input-output tables are only published every five years, we only had data for 2000 and 2005 (at the time of writing, the tables for 2010 were not available). The data for the years between 2000 and 2005 were imputed using a simple linear trend, and the data for 2006 and 2007 are extrapolations of this trend. This may be a questionable approach – some may even term it simplistic – but we found no other possibility due to lack of data. Also, in case of the four countries examined, there was no large variation in the 2000 and the 2005 indicators, so the presumed stability of vertical linkages may justify this method. As with the proxy for intra-industry spillovers, similar approaches to measuring inter-industry have also been used in the literature (Damijan et al. 2003). There is one problem with this indicator: as we used the NACE 2 digit sector classification (in which national input-output tables are published), much of the linkages are lost, as the two digit classification is not detailed enough and it groups many industries into the same category, which actually may be vertically linked.
11
Measuring the capacities of workers and firms is relatively straightforward; we used the share of persons with upper secondary or tertiary education attainment (code: employ) for the former and business expenditure on research and development (code: berd) as a share of GDP for the latter. Both indicators are from the Eurostat database. As educational attainment was not available in a sector breakdown, we used the macro level data for the entire country. In case of business R&D, we were able to restrict it to the manufacturing sector only, but we were not able to separate the R&D spending of locally owned companies and foreign owned subsidiaries.
As a final component of our index, we used a measure of policy and institutional quality. As argued, government policies may provide incentives for cooperation between multinational subsidiaries and domestic companies and may encourage multinationals to transfer more technology to the host market. There are many measures and proxies available which, in essence, evaluate institutions and government policies, many of them extremely are extremely complex composite indicators themselves (such as the World Bank’s Governance Indicators, the competitiveness surveys of either the World Economic Forum or the International Institute for Management Development, or country risk assessments such as ones by Political Risk Services). We do not think that using any of these complex indicators or rankings as a component for our much less complex index could be justified, as the components of any composite indicator should be kept as simple as possible, or else the indicator could risk losing meaning (OECD 2008). Therefore, we opted for a much simpler solution, and decided to use a very basic measure of policies, the degree of a country’s openness, i.e. the ration between the total of exports and imports divided by total GDP (code: open). This measure has been used in countless empirical work (see for example Sachs & Warner 1995) as a measure of policies. Even though it has been highly criticized for capturing factors independent of government policies, it correlates well with all other measures of policies and institutions, and also the amount of foreign direct investment that a country has attracted. Schoors and van der Tol (2002) find that the degree of openness itself is an important determinant of spillovers.
As described above, finding suitable proxies for the various spillover determinants was not a straightforward task and involved much compromise. The data used to create the composite index therefore may introduce some biases, but we do not think these to be significant. The
12
raw data of all six proxies are included in Annex Table 1. Correlation coefficients between the variables are shown in Table 1.
Table 1. Correlation coefficients for the components of the Spillover Potential Index
intra inter empl berd gdp open
intra 1.000 -0.190 0.039 0.072 0.432 0.912
inter 1.000 0.587 0.909 0.773 0.168
empl 1.000 0.419 0.466 0.220
berd 1.000 0.845 0.424
gdp 1.000 0.694
open 1.000
Source: calculation of the authors
As can be expected with similar data, correlations between the various components of the composite index vary between being negligible and strong. Most however are in the medium- range, which implies that most of the components carry relevant information which is additional to those in the other components. Still, GDP per capita for example is the variable that is most highly correlated with all the others, which may lead us to conclude that much of the information contained in this variable is contained in the others as well. This may in part make the GDP per capita variable redundant, which can imply the need to give it a lower weight while aggregating the components into a single index. The weighting and aggregation of the individual components and the actual composition is the topic we turn to next.
4.2. Weighting and aggregation
In this subsection we elaborate on how the six components presented above were joined into a single composite index. Weighting and aggregation of components into a composite index are both issues which can severely affect the individual values of the resulting index and thus its actual performance and relevance. A well constructed composite indicator should be robust to changes in weighting and aggregation methods, and the individual country scores should not differ greatly. In order to ensure that the Spillover Potential Index is robust, so we have tried different weighting and aggregation approaches.
13
In the first step we normalized all values with the Min-Max approach by using minimum and maximum values for each indicator across time and countries, which is commonly employed in time dependent data series (OECD 2008: 85):
Where I is the resulting normalized indicator, x is the raw value of the data, t, c and q are indices which refer to time (year), country and indicators respectively. This method transformed all our variables into normalized indicators with values between 0 and 1. The obvious advantage of using maximum and minimum values across time and countries is that we can take into account the evolution of indicators across time and the differences between countries. The drawback is that in order to maintain comparability across time, the normalization would have to be carried out again if data for new time periods would be added to the series. This however, is not a serious drawback, and the extension of the index to further years is still possible.
In the second step a decision must be made on weighting the various components of the index.
There are several methods for choosing weights, including using principal component analysis or factor analysis to derive weights, the benefit of doubt approach (Melyn & Moesen 1991), or various methods which entail asking experts to judge the relative importance of the various components, such as the analytical hierarchy approach (Saaty 1987). Much of these methods are only relevant with much larger datasets than ours. Theory gives us no guidance on the relative importance of the the channels and determinants or spillovers, so it can actually be difficult to justify using any set of weights based on theory. One approach which is used relatively commonly in such situations is simply to forgo weighting and give all components the same weight. This may or may not be justified, but without any detailed theory serving as guidance using equal weights may seem less arbitrary than any other method. We calculated the baseline values of the Spillover Potential Index using this method.
We also tried two other methods. As mentioned in the previous section, due to correlations between the variables, and especially the fact that GDP per capita was highly correlated with many of the other variables, it may make sense to somehow take this into consideration. In the second approach we gave GDP per capita half the weight as we did all the other components.
1
14
This can be justified due to the fact that much of the GDP per capita variable’s influence is already included through the other variables. In our third, more sophisticated approach we used factor analysis to transform and reduce the data into hypothetical components where such correlations between the indicators are more or less eliminated. Although one might worry whether our relatively small dataset allows meaningful factor analysis or not, there are actually no specific statistical rules on it, only rules of thumb. According to the OECD’s Handbook on Constructing Composite Indicators (OECD 2008), one such rule is that there must be at least 10 cases (in our analysis, this refers to country-years) for each variable.
Another rule of thumb is that the cases to variables ratio should not be lower, than 3. Our dataset meets both of these rules, as we have 20 cases per variable, and six variables.
We used a method similar to Nicoletti et al. (2000) in order to produce the weights with factor analysis and aggregate the data. In the first step, we ran the factor analysis, including a Varimax rotation in order to obtain a simpler structure and to minimize the number of individual indicators which have a high loading in more than one component. Table 2 shows the results.
Table 2. Eigenvalues and rotated loadings of the Spillover Potential Index dataset
Component
Initial Eigenvalues Rotation Sums of Squared Loadings Total % of
Variance
Cumulative
% Total % of
Variance
Cumulative
%
1 3.406 56.759 56.759 3.023 50.377 50.377
2 1.816 30.275 87.034 2.199 36.658 87.034
3 0.661 11.019 98.053
4 0.088 1.465 99.519
5 0.020 0.334 99.853
6 0.009 0.147 100.000
Source: calculation of the authors
According to the factor analysis, our six individual indicators can be summed up into two components which have eigenvalues greater than one. These two components explain more than 87 percent of the variance in the dataset. Table 3 shows the loadings for each component.
Component 1 includes mainly inter-industry spillovers, employment, business R&D spending and GDP per capita. Component two is made up of the intra-industry spillover measure, the
15
openness indicators, and also GDP per capita (which we were not able to restrict to only one of the components). Based on the rotated component matrix, we calculated the squared factor loadings of each component and scaled them to unity sum.
Table 3. Rotated Component Matrix of the Spillover Potential Index dataset
Rotated Component Matrix Squared factor loadings (scaled to unity sum)
Component Component
1 2 1 2
intra -0.089 0.988 0.00 0.44
inter 0.986 -0.097 0.32 0.00
employ 0.681 0.037 0.15 0.00
berd 0.918 0.176 0.28 0.01
gdp 0.816 0.519 0.22 0.12
open 0.265 0.955 0.02 0.41
Explained variance 3.023 2.199
Expl/total variance 0.579 0.421
Source: calculation of the authors
Similarly to the approach of Nicoletti et al. (2000), first we constructed two intermediate composite indicators, using the squared factor loadings as weights. Then, we aggregated the two intermediate composite indicators using the percentage of the total variance they explain as weights. So, the individual indicators intra, inter, employ, berd, gdp and open enter the first intermediate composite indicator with weights of 0, 0.32, 0.15, 0.28, 0.22 and 0.02. They enter the second one with weights of 0.44, 0, 0, 0.01, 0.12, 0.41 respectively. Finally, the two intermediate composite indicators enter the Spillover Potential Index with weights of 0.579 and 0.421 respectively.
Concerning aggregation, the key question that needs to be decided is whether to allow for compensability between the various components or not (OECD 2008: 105). In other words, should poor performance in some components be allowed to be compensated for by a high performance in others? Or should the aggregation method reward high performance and punish low performance? Additive aggregation methods, such as the following, allow for compensability:
16
Where CI is the resulting composite index. Geometric aggregation methods on the other hand punish countries with uneven performance:
Allowing for compensability may not go against theory in our case: if spillovers are weak through one channel, other channels may still provide ample possibilities and allow the country to benefit from the technology used by multinational subsidiaries. For example, if linkages are low between foreign and domestically owned firms, other channels, such as imitation effects and the movement of employees may compensate for that and the country can still benefit. We will therefore prefer the additive aggregation method, but will calculate the composite index using geometric aggregation as well as a robustness check.
5. Results and discussion
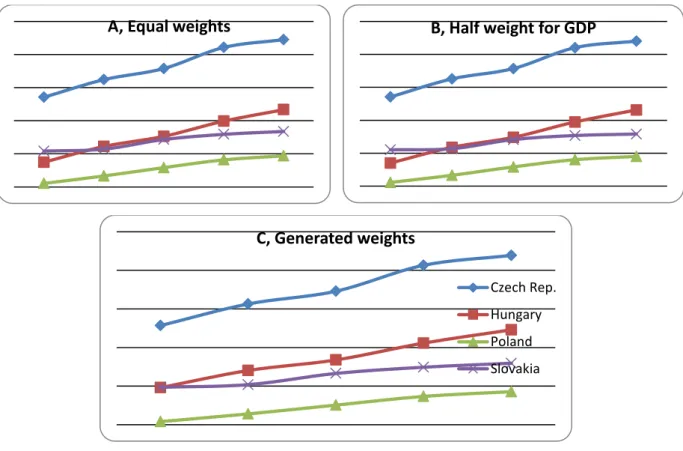
We therefore have three weighting methods (equal weights, half weight for GDP and weights generated by factor analysis) and two aggregation methods (additive and geometric). This would give us six versions of the Spillover Potential Index. The individual values for the index, calculated with the six different methods, are included in Annex Table 2. Here we only present figures to show the performance of the four countries over time.
Figure 1 shows the evolution of the index’s value for the four countries between 2003 and 2007, based on the additive aggregation method. As mentioned, we prefer the additive method as it allows bad performance in one component to be compensated by good performance in another, which is justified by theory. Based on the figure, we can draw some important conclusions. Regardless of the weighting method used, it is clear that all countries have increased their potential to benefit from productivity spillovers from FDI. Although investors often bundle these four countries together and tend to treat them as a homogenous group, the results in Figure 1 imply that this may not be justified. There are clear differences between the extent the four countries are able to benefit from spillovers from foreign investments in their manufacturing industries, and this can also have an impact on both individual government
2
3
17
investment policies, but also on the types of investment MNC’s decide to locate to the various countries.
Figure 1. The Spillover Potential Index between 2003 and 2007, with different weighting methods and additive aggregation
Source: calculation of the authors
While the absolute values of the index do not carry much information, looking at the relative positions of the four countries can be rather insightful. In all four cases, the Czech Republic is a clear leader, with the highest potential to benefit from productivity spillovers. When using the weights generated by factor analysis, the difference between the Czech Republic and the other three countries is even more pronounced. In fact, the difference between the country and the others even seems to have grown between 2003 and 2007, implying that it is much more successful at catching up to the more advanced countries than the others. Technology is most likely to spread from MNC’s to local companies in the Czech Republic as compared to the others, and this should have an impact on the type of activities MNC’s locate to the country.
Therefore, MNC subsidiaries may have to be more wary about their technological competencies, and parent firms should try and provide technology to their subsidiaries which is more difficult to adapt by outsiders. On the other hand, to compete in the Czech market, the
A, Equal weights B, Half weight for GDP
C, Generated weights
Czech Rep.
Hungary Poland Slovakia
18
investing MNC’s may be forced to transfer more or higher level technology to their affiliates.
In case of the other three countries, were the potential for technology transfer is lower, MNC’s may not have to transfer as much technology, and may have less fears about their technology being appropriated by competitors.
A further interesting observation, based on Figure 1, is that Hungary is the only country besides the Czech Republic, which seems to have improved its relative position. This is a somewhat surprising finding, given the fact that Hungary’s competitiveness has decreased quite a lot in the period under consideration, due to wage increases, slow growth and political instability (Allard 2009). Still, decreasing competitiveness and thus decreasing inflows of FDI does not preclude an increasing potential to benefit from these investments. Based on panel C in Figure 1, Hungary has even overtaken Slovakia. Poland seems to consistently score the lowest, regardless of weighting method, although using the weights generated with factor analysis it does come close to Slovakia.
Figure 2. The Spillover Potential Index between 2003 and 2007, with different weighting methods and geometric aggregation
Source: calculation of the authors
A, Equal weights
C, Generated weights
Czech Rep.
Hungary Poland Slovakia
B, Half weight for GDP
19
As a robustness check, we also aggregated the components of the index using geometric aggregation. The results are shown in the three panels of Figure 2. The results are more or less the same, with only one major change: the relative position of Slovakia. The country’s performance even seems to stagnate in the second half of the period. Due to the properties of geometric aggregation, this implies that Slovakia’s performance in various components of the Spillover Potential Index is the most uneven among the four countries, a fact which is masked by additive aggregation. If we look at the raw data used to create the index, it is clear that there are very large differences between the components in the case of Slovakia. Inter- industry linkages are for example very weak in Slovakia, and so is corporate R&D spending.
On the other hand, the country scores extremely well on intra-industry effects and openness.
While the years between 2003 and 2007 are clearly limited, some policy conclusions do emerge based on the Spillover Potential Index. First, as the Czech Republic is poised to benefit the most from foreign direct investment in the manufacturing sector, it should offer higher investment incentives to incoming multinationals, or at least such higher incentives can be justified. This means that the Czech Republic can be much more competitive in attracting foreign investments, at least in terms of government support for large investments. A second policy related conclusion is related to the possibilities countries have to increase their potential to benefit from spillovers. Most of the components used to create the index, cannot be influenced directly by governments in the short run. Inter-industry linkages for example are extremely difficult to influence, and direct policy options (such as prescribing domestic sourcing requirements for multinational subsidiaries) are no longer viable. The only tools governments have are to help increase the competitiveness of their domestic companies by training, concessional loans and grants for modernization and match making services, in order to help them become suppliers to MNC affiliates. Similarly, increasing business R&D expenditure is not an easy task, and it is a challenge in all CEE countries.
A third issue, rather related to MNC strategy and not to government policies, has already been mentioned, but it is worth stressing again: MNC’s should diversify their approach to the region: they should locate higher, but less appropriable technology activities to the Czech Republic, while investments to the other countries should require lower level technology, but appropriability may not be a large concern.
6. Conclusions
20
In our paper, we have created a composite index to measure the potential four Central and Eastern European countries have to benefit from technology spillovers from foreign direct investment in the manufacturing sectors. To create the index, we have used six individual indicators to proxy the various channels and determinants of spillovers. Due to data availability issues (mainly related to the fact that we used national input-output tables for calculating one of the proxies), we were only able to compute the values of the index for the years between 2003 and 2007. We have tried several weighting and aggregation methods, and have found the resulting country performance relatively stable and robust.
The Spillover Potential Index can serve as a useful tool for both multinational corporations and the governments of the four countries in the CEE region. The main conclusions based on the analysis of the index is that multinational corporation should diversify the region in their strategies, and that variation in the investment incentives offered by local governments to investing MNC’s can be justified. Of course, the Spillover Potential Index does have limitations, much of them have been already spelled out in the paper, such as the compromises concerning the individual component proxies. Caution is always required when interpreting a composite indicator and strategic corporate decisions should always be complemented by other sources, such as country and industry case studies.
Future research may expand to scope of the Spillover Potential Index to all EU member states, which would allow a better comparison. Also, the larger amount of resulting data would allow the index to be used in cross-country panel regressions as an explanatory variable. Empirical research using the index and trying to pinpoint the extent of productivity spillovers in countries would arrive at more valid results than with the simple and insufficient proxies used currently. It may also be interesting to examine how the values of the Spillover Potential Index are correlated with investment incentives provided by governments to inward FDI.
Sadly however such research is not possible due to the fact that governments in the CEE region (and elsewhere) are usually quite secretive about such support.
References
Brian J. Aitken, B. J., Harrison, A. E. (1999): Do Domestic Firms Benefit from Direct Foreign Investment? Evidence from Venezuela. The American Economic Review 89(3): 605-618.
Allard, C. (2009): Competitiveness in Central-Europe: What Has Happened Since EU Accession? IMF Working Paper 9121.
21
Blalock, G. – Gertler, P. J. (2008): Welfare gains from Foreign Direct Investment through technology transfer to local suppliers. Journal of International Economics 74: 402–421 Blomström, M. – Kokko, A. (2003): The economics of foreign direct investment incentives.
In: Herrmann, H. – Lipsey, R. E. (eds): Foreign direct investment in the real and financial sector of industrial countries. Springer.
Blomström, M. – Globerman, S. – Kokko, A. (1999): The determinants of host country spillovers from foreign direct investment: review and synthesis of the literature. EIJS Working Paper No. 76.
Cohen, S. D. (2007): Multinational Corporations and Foreign Direct Investment. Oxford:
Oxford University Press
Damijan, J. P. – Knell, M. – Majcen, B. – Rojec, M. (2003): Technology transfer through FDI in top-10 transition countries: How important are direct effects, horizontal and vertical spillovers? William Davidson Institute Working Paper No. 549.
Djankov, S. – Hoekman, B. (2000): Foreign Investment and Productivity Growth in Czech Enterprises. World Bank Economic Review 14(1): 49-64.
Görg, H. – Greenaway, D. (2003): Much Ado About Nothing? Do Domestic Firms Really Benefit from Foreign Direct Investment? IZA Discussion Paper No. 944
Heston, A. – Summers, R. – Aten, B. (2011): Penn World Table Version 7.0, Center for International Comparisons of Production, Income and Prices at the University of Pennsylvania. http://pwt.econ.upenn.edu/
Javorcik, B. S. (2004): Does foreign direct investment increase the productivity of domestic firms? In search of spillovers through backward linkages. American Economic Review 94(3): 605-627
Javorcik, B. S. (2008): Can Survey Evidence Shed Light on Spillovers from Foreign Direct Investment? World Bank Research Observer 23(2): 139-159.
Javorcik, B. S. – Spatareanu, M. (2008): To share or not to share: Does local participation matter for spillovers from foreign direct investment? Journal of Development Economics 85(1-2): 194-217.
Kokko, A. (1994): Technology, market characteristics, and spillovers. Journal of Development Economics 43(2): 279-293.
Kolasa, M. (2007): How does FDI inflow affect productivity of domestic firms? The role of horizontal and vertical spillovers, absorptive capacity and competition. National Bank of Poland Working Paper No. 42.
22
Konings, J. (2001): The effects of foreign direct investment on domestic firms.
http://onlinelibrary.wiley.com/doi/10.1111/1468-0351.00091/abstract - fn1Evidence from firm-level panel data in emerging economies. Economics of Transition 9(3): 619–633.
Melitz, M. J. – Ottaviano, G. I. P. (2008): Market Size, Trade, and Productivity. Review of Economic Studies 75: 295–316.
Melyn, W. – Moesen, W.W. (1991): Towards a synthetic indicator of macroeconomic performance: unequal weighting when limited information is available. Public Economic Research Paper 17, CES, KU Leuven.
Nicoletti, G. – Scarpetta, S. – Boylaud, O. (2000): Summary indicators of product market regulation with an extension to employment protection legislation. OECD Economics Department Working Papers No. 226.
OECD (2008): Handbook on Constructing Composite Indicators. Methodology and User Guide. Paris: OECD
Rodrik, D. (1999): The New Global Economy and Developing Countries: Making Openness Work. Overseas Development Council Policy Essay 24.
Saaty, R. W. (1987): The analytic hierarchy process: what it is and how it is used, Mathematical Modelling 9: 161-176.
Sachs, J.D. – Warner, A.M. (1995): Natural resource abundance and economic growth.
National Bureau of Economic Research Working Paper No. 5398
Schoors, K. – van der Tol, B. (2001): The Productivity Effect of Foreign Ownership on Domestic Firms in Hungary. University of Gent Working Paper 2002/157.
23
Annex Table 1. Raw data of components used for creation of the Spillover Potential Index
Country Year
Share of manufacturing's
output produced by foreign owned
companies1
Share of domestic inputs
in the total inputs used by manufacturing
industries2
Persons with upper secondary or
tertiary education attainment3
Business expenditure on
R&D in manufacturing4
Real GDP per Capita in constant
prices5
Openness (exports
plus imports over total
GDP)5
Czech Republic
2007 0.63 0.491 0.838 0.95 22 399 1.63
2006 0.62 0.487 0.836 1.01 21 038 1.51
2005 0.54 0.483 0.832 0.89 19 695 1.41
2004 0.53 0.480 0.824 0.78 18 546 1.38
2003 0.48 0.476 0.820 0.76 17 804 1.20
Hungary
2007 0.68 0.436 0.738 0.49 17 487 1.71
2006 0.63 0.433 0.728 0.48 17 294 1.50
2005 0.60 0.430 0.715 0.41 16 644 1.33
2004 0.63 0.427 0.707 0.36 15 993 1.27
2003 0.58 0.424 0.699 0.34 15 275 1.15
Poland
2007 0.46 0.445 0.796 0.17 15 249 0.86
2006 0.45 0.439 0.790 0.18 14 315 0.82
2005 0.44 0.432 0.782 0.18 13 481 0.75
2004 0.42 0.426 0.770 0.16 13 029 0.72
2003 0.41 0.419 0.759 0.15 12 354 0.67
Slovak Republic
2007 0.79 0.423 0.816 0.18 18 681 1.72
2006 0.71 0.421 0.811 0.21 16 940 1.70
2005 0.71 0.420 0.800 0.25 15 644 1.54
2004 0.69 0.418 0.793 0.25 14 735 1.48
2003 0.64 0.417 0.794 0.32 14 099 1.43
Sources: calculations of the authors based on (1) Eurostat Structural Business Statistics; (2) Eurostat Symmetric Input-Output tables; (3) Eurostat Education and Training; (4) Eurostat Science, Technology and Innovation; (5) Heston – Summers – Aten (2011)Eurostat data available at http://epp.eurostat.ec.europa.eu. All online statistics
accessed between 10 April and 15 May 2011.
24
Annex Table 2. Values of the Spillover Potential Index using different weighting and aggregation methods
Country Year
Additive Aggregation Geometric Aggregation Equal
weights
Half weight for
GDP
Generated weights
Equal weights
Half weight for
GDP
Generated weights
Czech Republic
2007 0.90 0.90 0.81 0.89 0.88 0.88
2006 0.86 0.86 0.77 0.84 0.84 0.83
2005 0.75 0.75 0.70 0.72 0.71 0.69
2004 0.68 0.69 0.64 0.65 0.65 0.63
2003 0.60 0.61 0.59 0.54 0.54 0.51
Hungary
2007 0.52 0.53 0.32 0.47 0.46 0.49
2006 0.45 0.44 0.28 0.40 0.39 0.42
2005 0.36 0.35 0.22 0.31 0.30 0.34
2004 0.32 0.32 0.18 0.24 0.24 0.28
2003 0.25 0.25 0.14 0.15 0.14 0.19
Poland
2007 0.28 0.28 0.26 0.19 0.18 0.17
2006 0.24 0.24 0.21 0.16 0.16 0.15
2005 0.18 0.19 0.16 0.12 0.12 0.10
2004 0.13 0.14 0.10 0.07 0.07 0.06
2003 0.08 0.09 0.05 0.02 0.02 0.02
Slovak Republic
2007 0.60 0.59 0.26 0.33 0.32 0.32
2006 0.53 0.53 0.23 0.32 0.31 0.30
2005 0.47 0.48 0.19 0.29 0.28 0.27
2004 0.43 0.44 0.17 0.23 0.23 0.21
2003 0.40 0.42 0.17 0.22 0.22 0.19
Source: calculation of the authors