Journal of High Institute of Public Health 2019;49(3):179-188
179
A Pilot Study for Socioeconomic Inequalities in Health among Jordanian Adolescents
Abdullah S. Alshammari 1¥, Bettina F. Piko 2
1 Doctoral School of Education, University of Szeged, Hungary
2 Department of Behavioral Sciences, University of Szeged, Hungary
Abstract
Background & Objective(s): Socioeconomic inequalities play an important role in health. Although studies report less inequalities in adolescent health compared to other age groups, there may be differences in their health behavior and mental health. This cross-sectional pilot study aimed to analyze these associations.
Methods: Using a sample of students (n = 112, aged 13 - 18 years) data were collected from public and private schools in Irbid governorate, Jordan, November, 2018. Measurements included socioeconomic status indicators (education and income of the parents, assessed by the adolescent), the Global School-based Student Health Survey, health behaviors (tobacco use, personal hygiene, dietary behavior), Satisfaction with Life Scale, Center for Epidemiological Studies Depression Scale for Children.
Results: The results indicated that there was a significant association between the family affluence and both paternal (p = 0.003) and maternal educational levels (p=0.008). There was a relationship between paternal education and not having enough food at home (p = 0.006), adolescents’ eating fruit per week (p = 0.037), and washing their hands before eating (p = 0.004). Maternal education level was related to the students’ eating vegetables (p = 0.011) and fruits (p = 0.030) per week. The association of family affluence with eating fast food was significant (p = 0.05). The relationship of depression and family affluence was linear.
Conclusion: Our findings suggest that adolescents’ health behavior may dominantly be related to paternal education, while their mental health may be related to family affluence. The data of this study will help in establishing effective and efficient counseling and support intervention programs.
Keywords: Health behaviors, Risk factors, Socioeconomic inequalities, Mental health, Adolescent school students, Jordan.
Available on line at:
jhiphalexu.journals.ekb.eg Print ISSN: 2357-060 Online ISSN: 2357-061X CC BY-SA 4.0
¥Correspondence:
Email: saberabdullah20@gmail.com
Suggested Citations: Alshammari AS, Piko BF. A Pilot Study for Socioeconomic Inequalities in
Health Among Jordanian
Adolescents. JHIPH. 2019; 49(3):
179-188.
INTRODUCTION
ocioeconomic inequalities play an important role in health.(1) Despite health progress and development into modernity worldwide, inequalities in health continue to exist among populations within the same society and there are inequalities between nations in both developing and developed countries.(2) Health inequalities refer to differences including the access to treatment, prevention, or rehabilitation; inequalities in mortality and morbidity. They often stem from variations in lifestyle and social circumstances.(3) Socioeconomic indicators include social and economic circumstances, level of education, occupation, gender, family income (affluence), and family size – both objective and subjective measurements.(4) While several studies have justified the associations between socioeconomic status (SES) and health across the
life course, health inequalities are not consistent through different age groups. (5) Some previous studies support the relative lack of social inequalities (that is a certain level of equalization) in adolescents’ health (e.g. occurrence of diseases).(6) However, there might be associations with their health behaviors (such as substance use or dietary habits) or mental and psychosomatic health complaints.
While in health behavior, parental schooling seems to be an important determinant, in mental health, subjective family affluence (self-assessed financial situation) may have a greater role.(5,7)
Adolescents are relatively free of serious illness and their morbidity and mortality rates are less as compared to other parts of the life course; however, there are also considerable biological and psychosocial changes which need severe adjustment.(8) This is the time period of getting familiar with substance use; and also there are changes in
S
Original Article
adolescents’ health behaviors, such as dietary habits or sports.(9) Psychosomatic and depressive symptoms tend to increase, particularly among females.(5) Unfortunately, many adolescents do not care about the correct directions for healthy behavior, and health risk behaviors often occur simultaneously.(10) These phenomena can be attributed to neurodevelopmental processes (discrepancy between the prefrontal cortex and limbic system) and adolescents tend to make irrational decisions based on the lack of appropriate risk evaluation and perceived invulnerability.(11) Some recent studies argued that there may be great differences in these reactions depending on social environment and cultural contexts.(12) In addition, recent findings suggest that inequalities in adolescent health (e.g. depression, life satisfaction, self-esteem, problem behaviors) may be rising in Europe(12,14,15) or beyond (16).
In Jordan, health care should face many challenges in terms of inequalities between different groups of the population according to socioeconomic status including the level of education, affluence, and regional residency.(17,18) In children’s health and cognitive development, the family’s socioeconomic status plays an important role. Family affluence and higher parental education can be beneficial.(19) However, studies among adolescents in Jordan and nearby countries show considerable controversial results. In a study among Jordanian adolescents aged 12 - 17 years, physical activity behavior was associated with higher levels of both paternal and maternal education.(20) A study of Iranian youth suggests that students whose parents had higher education tend to eat more fast foods, while other studies did not confirm this finding.(21) Social inequalities in adolescent mental health (e.g. depression, self-esteem or life satisfaction) have also been well documented in Jordan and Turkey.(22-24)
This pilot study is part of a research project on mental health and health behavior among Jordanian adolescents.
Therefore, the main objective of the present pilot study was to get a preliminary picture on social inequalities in adolescents’ health using a smaller sample of Jordanian students before the large-scale project. This study aimed to test inequality (using parental education and family affluence) in students’ health behaviors (namely, their dietary habits and hygienic behavior) and certain indicators of mental health, such as depression, self-esteem and life satisfaction.
METHODS
A descriptive, cross-sectional design was conducted in November 2018.
As usual in feasibility studies, we applied a pilot sample (N= around 100). The pilot study was conducted on 112 students aged 13 - 18 years. A multistage random sampling technique was used with a selection basis of the type of school (private, public, male, female schools). We selected the students randomly from grades 8-12.
Socioeconomic variables included age, gender, class, family affluence, number of siblings, father and mother education. Family affluence was measured by self- assessment of the students identified as charity, low, moderate, accepted, and high. Parental education was assessed as having less than primary education, primary education, secondary education, graduate and postgraduate education.
The modified Arabic version of Global School-based Student Health Survey (GSHS) questionnaire was used to measure health behaviors. The instrument includes 29 items in the four domains of dietary behavior (eight items), personal and oral hygiene (nine items), tobacco use (six items) and physical activity (six items).(25) The validity and reliability of the Arabic version of the GSHS were assessed by numerous studies conducted in different Arabic countries including Jordan.(26) In this pilot phase, variables were chosen as examples from different fields of health behavior.
The Satisfaction with Life Scale contains 5 items designed to measure global cognitive judgments of one’s life satisfaction. Participant indicate how much they agree or disagree with each of the 5 items using a 7-point scale that ranges from 1 (strongly disagree) to 7 (strongly agree).(27) The Arabic version of the scale was used.(28) The Cronbach’s alpha value of reliability with the current sample was 0.83.
Rosenberg’s Self-Esteem Scale contains 10 items that measures global self-worth by measuring both positive and negative feelings about the self.(29) The Arabic version of the scale was applied. (30) The scale is believed to be uni- dimensional. All items are answered using a 4-point Likert scale format ranging from strongly agree to strongly disagree. The reliability value was 0.65 with the sample.
As a measurement of depression, the Arabic version of Center for Epidemiological Studies Depression Scale for Children (CES-DC) was used.(31,32) The instrument contains 20 items. Each response to an item is scored as follows: 0 = “Not at all”, 1 = “A little”, 2 = “Some”, 3 =
“A lot”. The (CES-DC) is shown to be a valid and reliable measure of depression. The Cronbach’s alpha value was 0.85 with the sample.
Study Procedure
First, the researcher gave simple explanation of the importance of research, then students had the freedom to participate in research without any pressure from school or parents, and they had the right to refuse to answer any question and to withdraw from the study at any time without any penalties. All students recruited for participating in the study were invited to voluntarily assent and obtain signed consent forms from their parents. On the following day, written consent forms, which were signed by parents, were collected from students by the researchers. Data were collected in the computer labs during the leisure or sports classes for the students through an online survey which was developed by the researchers using Google drive forms.
Ethical considerations:
This research and all study procedures were approved by the Institutional Review Board (IRB) of University of Szeged, Hungary and the Ministry of Education in Jordan.
Informed consents were taken from parents/ guardians of the students. Confidentiality and anonymity were carefully protected and ensured during all stages of the study.
Statistical analysis:
Data were analyzed using IBM, SPSS statistics version 23. Descriptive statistics were used to describe the study demographics using frequencies (No.), percentages (%), means, and standard deviation (SD). Chi-square (χ2) tests, t-tests and ANOVA (F-test) were used to determine statistically significant differences or relationships. The significant level of acceptance was 0.05.
RESULTS
Regarding frequencies of socioeconomic variables in the study sample, frequencies of parents’ education seem rather similar. Regarding the self-assessed financial situation, only nine of them reported belonging to the high category, and most students were categorized as moderate.
Using Chi-square test, there was a close relationship between family affluence and paternal education (χ2=
19.48, p= 0.003) as well as maternal education (χ2= 17.34, p= 0.008). (Table 1)
Table (2) displays health behaviors in the sample.
Most of the students reported that they had enough food at home; however, 5.4% of them agreed that most of the time or always they experienced the lack of food. Forty percent of them reported eating fruit daily; 26.8% reported three times a week, 29.5% once or twice a week and 3.6%
reported never eating fruits. Fewer students ate vegetables on weekly or daily bases. Frequencies of drinking carbonated soft drinks were nearly equally distributed according to the different categories. More than 33% of students never went out for eating fast food, while 20.4%
went three times a week and 9.7% daily. Concerning hygienic aspects, most of students (75%) always washed their hands before eating. During the past 30 days, 8.9% of them did not brush their teeth, 9.8% brushed their teeth once a day, 22.3% twice, 18.8% three times and only 40.2% four or more times a day. The rate of smoking among students was 11.7%. Only 13.4% of students were active all days during the past 7 days and 22.3% were totally inactive.
Regarding gender differences, more girls ate fruits (χ2=
14.43, p< 0.01) and vegetables (χ2= 15.51, p= 0.001), while more boys were physically active (χ2= 17.41, p=
0.001). No gender differences could be justified in the patterns of drinking carbonated soft drinks or eating fast
food, brushing teeth or washing hands before eating, being physically active or lacking food at home (p > 0.05).
Although more boys smoked cigarettes than girls (16.4%
vs. 6.0%), this difference was not significant due to the small sample size (p= .09).
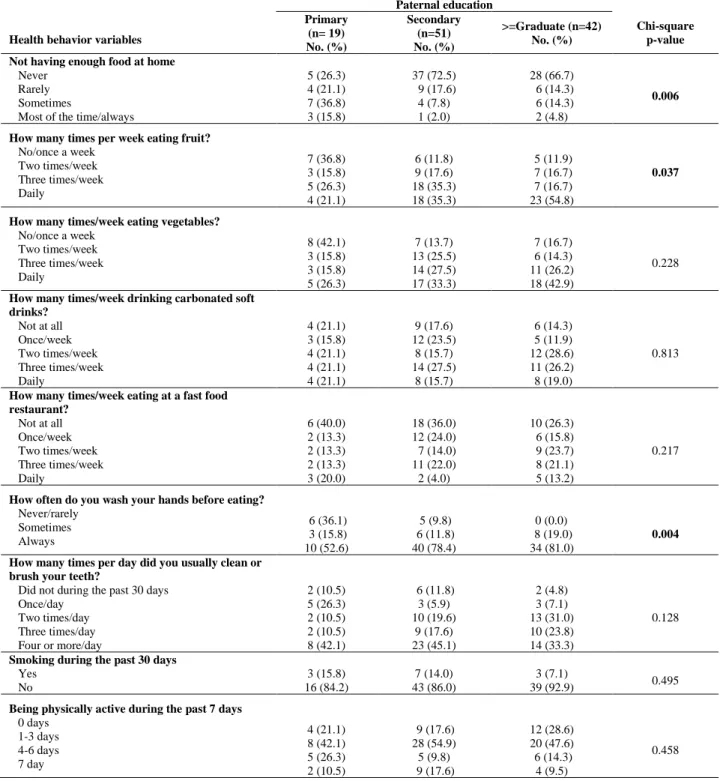
Table (3) presents results of relationship between health behaviors and paternal education. Significant associations were found in three cases. There were more students who reported not having enough food at home and whose parents had lower educational level (χ2= 17.99, p= 0.006). Likewise, students whose fathers had higher education reported eating more fruits (χ2= 13.42, p=
0.037). They students also reported more frequent washing hands before eating (χ2= 15.64, p= 0.004).
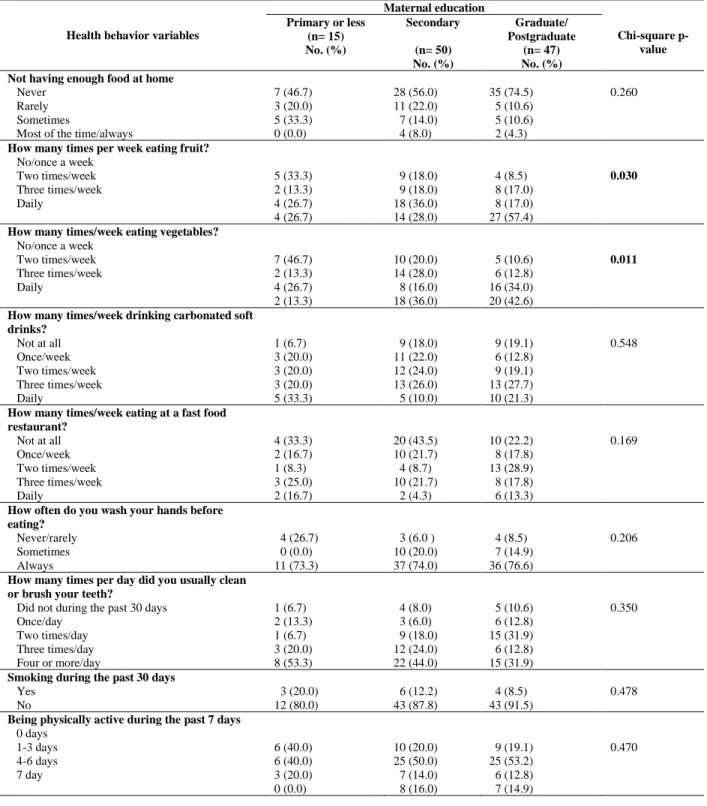
Concerning maternal education, there were only two significant results justified by Chi-square test (Table 4).
Similar to the role of paternal education, maternal education also played a role in children’s fruit consumption (χ2=13.99, p=0.030). Difference of vegetable consumption by maternal education was also statistically significant (χ2= 16.63, p= 0.011).
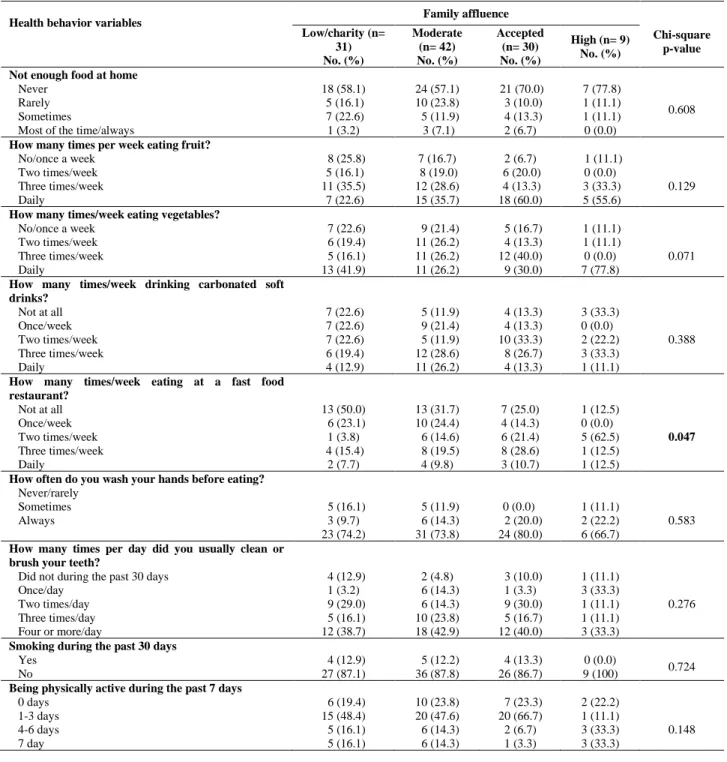
Among the results of the relationships between the children’s health behavior variables and self-assessed family affluence, only one variable proved to be statistically significant. (Table 5). Those belonging to the highest category reported the most frequent consumption of fast food (χ2= 20.68, p= 0.047).
In terms of mental health indicators, no gender differences could be justified in depression scores (boys:
27.2, girls: 28.2). However, girls reported higher levels of satisfaction with life compared to boys (t= -4.298, p=
.000). Likewise, their self-esteem was also higher (t= - 3.788, p= 0.000) (data not shown).
Levels of life satisfaction significantly differed according to paternal education. Those whose father had secondary education reported the highest level (F= 7.37, p= 0.001). In terms of maternal education, differences did not reach the statistically significant level (p> 0.05). In levels of depressive symptoms, no gender differences could be detected in either paternal or maternal education.
Self–esteem varied only in the case of maternal education.
Students whose mothers were highly educated reported the highest level of self-esteem (F= 7.17, p= 0.001). (Table 6) According to family affluence (Table 7), those who assessed themselves as belonging to the highest group, reported the highest level of life satisfaction and the lowest level of depression scores. However, the differences proved to be statistically significant only in the latter case (F= 2,752, p= 0.046). In terms of self-esteem, those who were categorized as accepted reported the lowest level that differed from other categories (F= 3,806, p= 0.012).
Table (1): Socioeconomic status of the sample of Jordanian adolescents
SES variables
Family affluence Total
Chi-square p-value Low/charity
(n=31) No. (%)
Moderate (n=42) No. (%)
Accepted (n=30) No. (%)
High (n=9) No. (%)
(n=112) No.
Paternal education Primary
Secondary Graduate/postgraduate
9 (47.4) 16 (31.4) 6 (14.3)
6 (31.6) 23 (45.1) 13 (30.9)
1 (5.3) 11 (21.6) 18 (42.9)
3 (15.8) 1 (1.9) 5 (11.9)
19 51 42
0.003 Maternal education
Primary or less Secondary
Graduate/postgraduate
7 (46.7) 17 (34.0) 7 (14.9)
7 (46.7) 19 (38.0) 16 (34.0)
1 (6.6) 13 (26.0) 16 (34.0)
0 (0.0) 1 (2.0) 8 (17.0)
15 50 47
0.008
Table (2): Health behaviors among the sample of Jordanian adolescents Health behavior variables
Boys (n= 61)
Girls (n= 51
Total
(n = 112) Chi-square p-value
No. (%) No. (%) No. (%)
Not enough food at home Never
Rarely Sometimes Most of the time Always
35 (57.4) 12 (19.7) 11 (18.0) 2 (3.3) 1 (1.6)
35 (68.6) 7 (13.7) 6 (11.8) 3 (5.9) 0 (0.0)
70 (62.5) 19 (17.0) 17 (15.2) 5 (4.5) 1 (0.9)
0.538
How many times per week eating fruit?
Not at all Once/week Two times/week Three times/week Daily
4 (6.6) 10 (16.4) 12 (16.7) 20 (32.8) 15 (24.6)
0 (0.0) 4 (7.8) 7 (13.7) 10 (19.6) 30 (58.8)
4 (3.6) 14 (12.5) 19 (17.0) 30 (26.8) 45 (40.2)
0.004
How many times/week eating vegetables?
Not at all Once/week Two times/week Three times/week Daily
1 (1.6) 17 (27.9) 12 (19.7) 18 (29.5) 13 (21.3)
1 (2.0) 3 (5.9) 10 (19.6) 10 (19.6) 13 (52.9)
2 (1.8) 20 (17.9) 22 (19.6) 28 (25.0) 40 (35.7)
0.003
How many times/week drinking carbonated soft drinks?
Not at all Once/week Two times/week Three times/week Daily
10 (16.4) 13 (21.3) 11 (18.0) 16 (26.2) 11 (18.0)
9 (17.6) 7 (13.7) 13 (25.5) 13 (25.5) 9 (17.6)
19 (17.0) 20 (17.9) 24 (21.4) 29 (25.9) 20 (17.9)
0.800
How many times/week eating at a fast food restaurant?
Not at all Once/week Two times/week Three times/week Daily
20 (35.1) 7 (12.3) 12 (21.1) 13 (22.8) 5 (8.8)
14 (30.4) 13 (28.3) 6 (13.0) 8 (17.4) 5 (10.9)
34 (33.0) 20 (19.4) 18 (17.5) 21 (20.4) 10 (9.7)
0.237
How often do you wash your hands before eating?
Never/rarely Sometimes Always
9 (14.8) 10 (16.4) 42 (68.9)
2 (4) 7 (13.7) 42 (82.4)
11 (9.8) 17 (15.2)
84 (75.0) 0.247
How many times per day did you usually clean or brush your teeth?
Did not during the past 30 days Once/day
Two times/day Three times/day Four or more/day
7 (11.5) 9 (14.8) 16 (26.2) 9 (14.8) 20 (32.8)
3 (5.9) 2 (3.9) 9 (17.6) 12 (23.5) 25 (49.0)
10 (8.9) 11 (9.8) 25 (22.3) 21 (18.8) 45 (40.2)
0.086
Smoking during the past 30 days Yes
No
10 (16.4) 51 (83.6)
3 (6) 47 (94)
13 (11.7)
98 (88.3) 0.090
Being physically active during the past 7 days 0 days
1-3 days 4-6 days 7 day
17 (27.9) 29 (47.5) 7 (11.5) 8 (13.1)
8 (19.7) 27 (52.9) 9 (17.6) 7 (13.7)
25 (22.3) 56 (50.0) 16 (14.3)
15 (13.4) 0.431
Table (3): Association between health behaviors and paternal education among the sample of Jordanian adolescents
Health behavior variables
Paternal education
Chi-square p-value Primary
(n= 19) No. (%)
Secondary (n=51) No. (%)
>=Graduate (n=42) No. (%) Not having enough food at home
Never Rarely Sometimes
Most of the time/always
5 (26.3) 4 (21.1) 7 (36.8) 3 (15.8)
37 (72.5) 9 (17.6) 4 (7.8) 1 (2.0)
28 (66.7) 6 (14.3) 6 (14.3) 2 (4.8)
0.006
How many times per week eating fruit?
No/once a week Two times/week Three times/week Daily
7 (36.8) 3 (15.8) 5 (26.3) 4 (21.1)
6 (11.8) 9 (17.6) 18 (35.3) 18 (35.3)
5 (11.9) 7 (16.7) 7 (16.7) 23 (54.8)
0.037
How many times/week eating vegetables?
No/once a week Two times/week Three times/week Daily
8 (42.1) 3 (15.8) 3 (15.8) 5 (26.3)
7 (13.7) 13 (25.5) 14 (27.5) 17 (33.3)
7 (16.7) 6 (14.3) 11 (26.2) 18 (42.9)
0.228
How many times/week drinking carbonated soft drinks?
Not at all Once/week Two times/week Three times/week Daily
4 (21.1) 3 (15.8) 4 (21.1) 4 (21.1) 4 (21.1)
9 (17.6) 12 (23.5)
8 (15.7) 14 (27.5)
8 (15.7)
6 (14.3) 5 (11.9) 12 (28.6) 11 (26.2) 8 (19.0)
0.813
How many times/week eating at a fast food restaurant?
Not at all Once/week Two times/week Three times/week Daily
6 (40.0) 2 (13.3) 2 (13.3) 2 (13.3) 3 (20.0)
18 (36.0) 12 (24.0) 7 (14.0) 11 (22.0) 2 (4.0)
10 (26.3) 6 (15.8) 9 (23.7) 8 (21.1) 5 (13.2)
0.217
How often do you wash your hands before eating?
Never/rarely Sometimes Always
6 (36.1) 3 (15.8) 10 (52.6)
5 (9.8) 6 (11.8) 40 (78.4)
0 (0.0) 8 (19.0) 34 (81.0)
0.004 How many times per day did you usually clean or
brush your teeth?
Did not during the past 30 days Once/day
Two times/day Three times/day Four or more/day
2 (10.5) 5 (26.3) 2 (10.5) 2 (10.5) 8 (42.1)
6 (11.8) 3 (5.9)
10 (19.6) 9 (17.6) 23 (45.1)
2 (4.8) 3 (7.1) 13 (31.0) 10 (23.8) 14 (33.3)
0.128
Smoking during the past 30 days Yes
No
3 (15.8) 16 (84.2)
7 (14.0) 43 (86.0)
3 (7.1)
39 (92.9) 0.495
Being physically active during the past 7 days 0 days
1-3 days 4-6 days 7 day
4 (21.1) 8 (42.1) 5 (26.3) 2 (10.5)
9 (17.6) 28 (54.9) 5 (9.8) 9 (17.6)
12 (28.6) 20 (47.6) 6 (14.3) 4 (9.5)
0.458
Table (4): Association between health behaviors and maternal education among the sample of Jordanian adolescents
Health behavior variables
Maternal education
Chi-square p- value Primary or less
(n= 15) No. (%)
Secondary (n= 50) No. (%)
Graduate/
Postgraduate (n= 47) No. (%) Not having enough food at home
Never Rarely Sometimes
Most of the time/always
7 (46.7) 3 (20.0) 5 (33.3) 0 (0.0)
28 (56.0) 11 (22.0) 7 (14.0) 4 (8.0)
35 (74.5) 5 (10.6) 5 (10.6) 2 (4.3)
0.260
How many times per week eating fruit?
No/once a week Two times/week Three times/week Daily
5 (33.3) 2 (13.3) 4 (26.7) 4 (26.7)
9 (18.0) 9 (18.0) 18 (36.0) 14 (28.0)
4 (8.5) 8 (17.0) 8 (17.0) 27 (57.4)
0.030
How many times/week eating vegetables?
No/once a week Two times/week Three times/week Daily
7 (46.7) 2 (13.3) 4 (26.7) 2 (13.3)
10 (20.0) 14 (28.0) 8 (16.0) 18 (36.0)
5 (10.6) 6 (12.8) 16 (34.0) 20 (42.6)
0.011
How many times/week drinking carbonated soft drinks?
Not at all Once/week Two times/week Three times/week Daily
1 (6.7) 3 (20.0) 3 (20.0) 3 (20.0) 5 (33.3)
9 (18.0) 11 (22.0) 12 (24.0) 13 (26.0) 5 (10.0)
9 (19.1) 6 (12.8) 9 (19.1) 13 (27.7) 10 (21.3)
0.548
How many times/week eating at a fast food restaurant?
Not at all Once/week Two times/week Three times/week Daily
4 (33.3) 2 (16.7) 1 (8.3) 3 (25.0) 2 (16.7)
20 (43.5) 10 (21.7) 4 (8.7) 10 (21.7) 2 (4.3)
10 (22.2) 8 (17.8) 13 (28.9) 8 (17.8) 6 (13.3)
0.169
How often do you wash your hands before eating?
Never/rarely Sometimes Always
4 (26.7) 0 (0.0) 11 (73.3)
3 (6.0 ) 10 (20.0) 37 (74.0)
4 (8.5) 7 (14.9) 36 (76.6)
0.206
How many times per day did you usually clean or brush your teeth?
Did not during the past 30 days Once/day
Two times/day Three times/day Four or more/day
1 (6.7) 2 (13.3) 1 (6.7) 3 (20.0) 8 (53.3)
4 (8.0) 3 (6.0) 9 (18.0) 12 (24.0) 22 (44.0)
5 (10.6) 6 (12.8) 15 (31.9) 6 (12.8) 15 (31.9)
0.350
Smoking during the past 30 days Yes
No
3 (20.0) 12 (80.0)
6 (12.2) 43 (87.8)
4 (8.5) 43 (91.5)
0.478
Being physically active during the past 7 days 0 days
1-3 days 4-6 days 7 day
6 (40.0) 6 (40.0) 3 (20.0) 0 (0.0)
10 (20.0) 25 (50.0) 7 (14.0) 8 (16.0)
9 (19.1) 25 (53.2) 6 (12.8) 7 (14.9)
0.470
Table (5): Associations between health behaviors and self-assessed family affluence among the sample of Jordanian adolescents
Health behavior variables Family affluence
Chi-square p-value Low/charity (n=
31) No. (%)
Moderate (n= 42) No. (%)
Accepted (n= 30) No. (%)
High (n= 9) No. (%) Not enough food at home
Never Rarely Sometimes
Most of the time/always
18 (58.1) 5 (16.1) 7 (22.6) 1 (3.2)
24 (57.1) 10 (23.8) 5 (11.9) 3 (7.1)
21 (70.0) 3 (10.0) 4 (13.3) 2 (6.7)
7 (77.8) 1 (11.1) 1 (11.1) 0 (0.0)
0.608
How many times per week eating fruit?
No/once a week Two times/week Three times/week Daily
8 (25.8) 5 (16.1) 11 (35.5) 7 (22.6)
7 (16.7) 8 (19.0) 12 (28.6) 15 (35.7)
2 (6.7) 6 (20.0) 4 (13.3) 18 (60.0)
1 (11.1) 0 (0.0)
3 (33.3) 5 (55.6)
0.129
How many times/week eating vegetables?
No/once a week Two times/week Three times/week Daily
7 (22.6) 6 (19.4) 5 (16.1) 13 (41.9)
9 (21.4) 11 (26.2) 11 (26.2) 11 (26.2)
5 (16.7) 4 (13.3) 12 (40.0) 9 (30.0)
1 (11.1) 1 (11.1) 0 (0.0)
7 (77.8)
0.071
How many times/week drinking carbonated soft drinks?
Not at all Once/week Two times/week Three times/week Daily
7 (22.6) 7 (22.6) 7 (22.6) 6 (19.4) 4 (12.9)
5 (11.9) 9 (21.4) 5 (11.9) 12 (28.6) 11 (26.2)
4 (13.3) 4 (13.3) 10 (33.3) 8 (26.7) 4 (13.3)
3 (33.3) 0 (0.0)
2 (22.2) 3 (33.3) 1 (11.1)
0.388
How many times/week eating at a fast food restaurant?
Not at all Once/week Two times/week Three times/week Daily
13 (50.0) 6 (23.1) 1 (3.8) 4 (15.4)
2 (7.7)
13 (31.7) 10 (24.4) 6 (14.6) 8 (19.5) 4 (9.8)
7 (25.0) 4 (14.3) 6 (21.4) 8 (28.6) 3 (10.7)
1 (12.5) 0 (0.0)
5 (62.5) 1 (12.5) 1 (12.5)
0.047
How often do you wash your hands before eating?
Never/rarely Sometimes Always
5 (16.1) 3 (9.7) 23 (74.2)
5 (11.9) 6 (14.3) 31 (73.8)
0 (0.0) 2 (20.0) 24 (80.0)
1 (11.1) 2 (22.2) 6 (66.7)
0.583
How many times per day did you usually clean or brush your teeth?
Did not during the past 30 days Once/day
Two times/day Three times/day Four or more/day
4 (12.9) 1 (3.2) 9 (29.0) 5 (16.1) 12 (38.7)
2 (4.8) 6 (14.3) 6 (14.3) 10 (23.8) 18 (42.9)
3 (10.0) 1 (3.3) 9 (30.0) 5 (16.7) 12 (40.0)
1 (11.1) 3 (33.3) 1 (11.1) 1 (11.1) 3 (33.3)
0.276
Smoking during the past 30 days Yes
No
4 (12.9) 27 (87.1)
5 (12.2) 36 (87.8)
4 (13.3) 26 (86.7)
0 (0.0)
9 (100) 0.724
Being physically active during the past 7 days 0 days
1-3 days 4-6 days 7 day
6 (19.4) 15 (48.4) 5 (16.1) 5 (16.1)
10 (23.8) 20 (47.6) 6 (14.3) 6 (14.3)
7 (23.3) 20 (66.7) 2 (6.7) 1 (3.3)
2 (22.2) 1 (11.1) 3 (33.3) 3 (33.3)
0.148
Table (6): Mental health indicators and parental education among the sample of Jordanian adolescents
Mental health Paternal education (Mean ± S.D.)
F-test
Primary Secondary ≥Graduate
Satisfaction with life 21.32 ± 6.87 27.57 ± 6.34 23.28 ± 7.71 p = 0.001
Self-esteem 27.53 ± 4.19 29.47 ± 4.01 29.33 ± 4.04 p = 0.189
Depression scores 29.63 ± 6.03 27.55 ± 8.11 26.90 ± 7.23 p = 0.489
Mental health Maternal education (Mean ± S.D.)
F-test
Primary or less Secondary ≥Graduate
Satisfaction with life 21.80 ± 6.47 24.46 ± 7.68 26.36 ± 7.05 p = 0.095
Self-esteem 27.00 ± 3.50 28.24 ± 3.69 30.66 ± 4.21 p = 0.001
Depression scores 28.80 ± 7.11 27.64 ± 7.29 27.32 ± 8.45 p = 0.814
Table (7): Mental health indicators and family affluence among the sample of Jordanian adolescents
Mental health
Family affluence (Mean ± S.D.)
F-testa
Low/charity Moderate Accepted High
Satisfaction with life 24.64 ±7.81 24.36 ±7.65 24.47 ±6.68 29.78 ±5.70 p = 0.230
Self-esteem 30.0 ±4.21 29.98 ±3.52 27.47 ±2.54 29.97 ±2.78 p = 0.012
Depression scores 28.52 ±7.01 29.43 ±7.82 25.73 ±7.69 22.89 ±7.54 p = 0.046
DISCUSSION
While at international level there are debates about social inequalities in adolescents’ health, in Jordan this field is rather unexplored yet. The literature on western culture suggests that comparatively this is a life period with fewer and less consistent social inequalities.(5-7) Recent studies suggest, however, that social inequalities in adolescents’ health is underestimated in many domains of adolescent health.(12,15)
Many studies provided evidence about the relationship between socioeconomic inequalities in health among Jordanian adolescents.(20,22,23) Although in a non-consistent way, results of our study support this evidence. Students who reported not having enough food at home were those whose parents had lower education level. Likewise, students with highly educated fathers and mothers reported eating more fruits, while in vegetable consumption, maternal education was statistically significant. These findings suggest that parental education may play an important role in their children’s dietary patterns. This is consistent with other studies, e.g. children who have parents with high education level eat more vegetables and fruit as compared to children who have parents with low and medium levels of education.(33,34) In line with modernization, fast food restaurants become a symbol of wealth; social inequalities in fast food consumptions are rather controversial. Some studies support that children from wealthier families consumed more.(21) Our findings confirm this: those from the highest category of family
affluence reported the highest frequencies of fast food consumption.
Besides dietary patterns, certain aspects of hygienic behavior were also related to socioeconomic status. In the current study, most students with highly educated fathers always washed their hands before eating. This is consistent with another study in Turkey which revealed that students whose fathers had a high school degree or higher education had better hand washing skills as compared to those whose fathers had only primary school education.(35) In Jordan, 39.3% of school children aged 6 - 12 did not always wash their hands before eating(36) compared to only 25% in the present study. In addition, findings of the current study also suggest that parental (particularly paternal) education plays a role in this skill.
Since social inequalities in mental health and psychological well-being seemed relevant for adolescents in earlier studies,(5-7,12) indicators such as self-esteem, depressive symptoms and satisfaction with life were included in the present study. Some previous studies found evidence for a relationship between socioeconomic inequalities and mental health among adolescents. For example, family economy was a significant predictor of mental health problems as measured across a wide range of symptom dimensions (namely, emotional, conduct or attention problems) among European adolescents.(14,15) Socioeconomic differences may vary by the indicator used but as it seems that family affluence can have a deeper impact than other SES measurements (e.g. paternal education).(37) Results of the present study support this evidence.
Depression scores significantly differed according to family affluence: adolescents of families with low income have a higher level of depression than adolescents of families with high income levels. These findings are consistent with studies conducted in Jordan.(22,23) There are different possible ways that poverty can increase the symptoms of depression among Jordanian adolescents.
Low income affects children’s health and emotional development through the decrease in purchasing power which meet their basic needs. Low family affluence may increase the vulnerability of adolescents to traumatic situations. It also increases pressure and burden on parents which leads to a change in their behavior and their children’ health.
Life satisfaction significantly differed according to paternal education, although the link is more U-shaped than linear. While some previous studies justified an association,(38) other studies found only a limited role of parental education in children’s life satisfaction.(39) On the other hand, those with the best educated mothers reported the highest level of self-esteem. This finding is consistent with another study in Turkey,(24) whereas it was not proved in another study in Iran.(40)
Gender differences in health behavior or mental health problems may lead to differences in morbidity and mortality later.(41) In the current study, girls scored higher on the satisfaction with life scale than boys. This finding is consistent with another Arabic study(42) which found that female youth were more satisfied with their lives than male youth. Although, other studies also reported that in comparison with boys, girls were more satisfied in terms of learning, school and life in general,(43) other studies did not support this finding.(44) This suggests that well-being may be formed in a different way considering gender. Gender differences could also be detected in certain patterns of health behavior, e.g. fruit and vegetable consumption were more common among girls than boys. This is consistent with another study in Jordan.(45)
Limitations
There are some limitations to the present study that must be taken into account in interpretation of its findings.
First, our study is cross-sectional which cannot provide a cause and effect relationship. This is a common limitation of such studies, which can only be overcome by longitudinal design. Second, results cannot be generalized because of the small size. However, this pilot study will hopefully trigger further studies which will contribute to a better understanding of the association of socioeconomic inequality with some aspects of health behaviors and psychological health.
CONCLUSION & RECOMMENDATIONS In conclusion, association of socioeconomic inequalities among adolescents with health behavior varied depending on various factors such as instruments used to define socioeconomic status, sample size, and settings of the study. Findings of the study suggest that adolescents’
health behavior may dominantly be related to paternal education, while their mental health may be related to family affluence. Consumption of fast food seems to be prestigious for adolescents. The data of this study will help in establishing effective and efficient counseling and support intervention programs that will help in reducing students’ unhealthy behaviors, improving their quality of life and having greater control over their lives.
Conflict of Interest: None to declare.
REFERENCES
1. Evans CR. Modeling the intersectionality of processes in the social production of health inequalities. Soc Sci Med. 2019;226:249–53.
2. Gwatkin DR. Trends in health inequalities in developing countries.
Lancet Glob Health. 2017;5(4):e371–2.
3. Mackenbach JP, Bopp M, Deboosere P, Kovacs K, Leinsalu M, Martikainen P, et al. Determinants of the magnitude of socioeconomic inequalities in mortality: A study of 17 European countries. Health & Place. 2017;47:44–53.
4. Ahlborg M, Svedberg P, Nyholm M, Morgan A, Nygren JM.
Socioeconomic inequalities in health among Swedish adolescents - Adding the subjective perspective. BMC Public Health. 2017;
17(1): 1–10.
5. Piko BF, Fitzpatrick KM. Socioeconomic status, psychosocial health and health behaviors among Hungarian adolescents. Eur J Public Health. 2007;17(4): 353–60.
6. Fagg JH, Curtis SE, Cummins S, Stansfeld SA, Quesnel-Vallée A.
Neighbourhood deprivation and adolescent self-esteem:
Exploration of the ‘socio-economic equalisation in youth’
hypothesis in Britain and Canada. Soc Sci Med. 2013;91:168–77.
7. Varga S, Piko BF, Fitzpatrick KM. Socioeconomic inequalities in mental well-being among Hungarian adolescents: A cross-sectional study. Int J Equity Health. 2014;13(1):1–9.
8. Jaworska N, MacQueen G. Adolescence as a unique developmental period. J Psychiat Neurosci. 2015;40(5): 291–3.
9. Ames ME, Leadbeater BJ, MacDonald SWS. Health behavior changes in adolescence and young adulthood: Implications for cardiometabolic risk. Health Psychol. 2018;37(2):103–13.
10. Visser L, Vollebergh WAM, Reijneveld SA, Verhulst FC, de Winter AF. Longitudinal patterns and predictors of multiple health risk behaviors among adolescents: The TRAILS study. Prev Med.
2015;84:76–82.
11. Steinberg L. A neurobehavioral perspective on adolescent risk- taking. Dev Rev. 2008;28(1):78–106.
12. Elgar FJ, Pförtner TK, Moor I, De Clercq B, Stevens GW J, Currie C. Socioeconomic inequalities in adolescent health 2002-2010: A time-series analysis of 34 countries participating in the health behavior in school-aged children study. The Lancet.
2015;385(9982):2088–95.
13. Moreno-Maldonado C, Moor I, Rivera F, Stevens GWJM, Morgan A, Braeckman L, et al. Systematic underestimation of social inequalities in adolescent health in 24 countries 2002-2014.
Euro J Public Health. 2018;28(S4):158.
14. Bøe T, Øverland S, Lundervold AJ, Hysing M. Socioeconomic status and children’s mental health: Results: from the Bergen Child Study. Soc Psych Psych Epid. 2012;47(10):1557–66.
15. Rajmil, L., Herdman, M., Ravens-Sieberer, U., Erhart, M., &
Alonso, J. Socioeconomic inequalities in mental health and health- related quality of life (HRQOL) in children and adolescents from
11 European countries. Int J Public Health. 2014;59(1):95–105.
16. Raheel H. Depression and associated factors among adolescent females in Riyadh, Kingdom of Saudi Arabia, a cross-sectional study. Int J Prev Med. 2015;6:90.
17. Boutayeb A. Social determinants of health and health equity in Jordan. Unpublished manuscript 2016. Available from:
https://www.researchgate.net/publication/298176453
18. United Nations Development Programme (UNDP). Socio- economic Inequality in Jordan Report 2015. Available from:
http://www.jo.undp.org/content/jordan/en/home/library/poverty/soc io-economic-inequality-in-jordan-report.html
19. Al-Hassan SM, Lansford JE. Child, family and community characteristics associated with school readiness in Jordan. Early Years. 2009;29(3):217–26.
20. Obeisat S, Gharaibeh H. Physical activity behaviour of Jordanian adolescents and its associated factors. Eur J Sc Res.
2012;67(3):433–43.
21. Zehni Moghadam SAH, Khodabakhshi A, Alimoradi F, Javadi M, Jandaghi P. Breakfast and fast food eating behavior in relation to socio-demographic differences among school adolescents in Sanandaj Province, Iran. Electron Physician. 2017;9(6):4510–5.
22. Dardas LA, Silva SG, Smoski MJ, Noonan D, Simmons LA. The prevalence of depressive symptoms among Arab adolescents:
Findings from Jordan. Public Health Nurs. 2018;35(2):100–8.
23. Ismayilova L, Hmoud O, Alkhasawneh E, Shaw S, El-Bassel N.
Depressive symptoms among Jordanian youth: Results of a national survey. Community Ment Health J. 2013;49(1):133–40.
24. Şahin E, Barut Y, Ersanlı E. Parental education level positively affects self-esteem of Turkish adolescents. JEP. 2013;4(20):87–97.
25. United States Centers for Disease Control and Prevention. Global School-based Student Health Survey (GSHS) website. [Internet].
Cited 2018, October 9. Available from: www.cdc.gov/gshs.
26. Al Qaseer BM, Batarseh S. Jordan Global School-Based Student Health Survey. CDC WHO; 2007. Available from:
https://www.who.int/ncds/surveillance/gshs/GSHS_Country_Repo rt_Jordan_2007.pdf
27. Diener E, Emmons RA, Larsen RJ, Griffin S. The Satisfaction with Life Scale. J Person Assess. 1985;49:71-75.
28. Abdallah T. The Satisfaction with Life Scale (SWLS):
Psychometric properties in an Arabic-speaking sample.
International Journal of Adolescence and Youth. 1998;7(2):113-9.
29. Rosenberg M. Society and the adolescent self-image. Princeton, NJ: Princeton University Press; 1965.
30. Zaidi U, Awad SS, Mortada EM, Qasem HD, Kayal GF.
Psychometric evaluation of Arabic version of Self-Esteem, psychological well-being and impact of weight on quality of life questionnaire (IWQOL-Lite) in female student sample of
PNU. Euro Med Health Pharma J. 2015;8(2):29-33.
31. Shahid A, Wilkinson K, Marcu S, Shapiro CM. Center for Epidemiological Studies Depression Scale for Children (CES-DC).
In: Stop, that and one hundred other sleep scales. New York:
Springer; 2011.
32. Malak MZ, Khalifeh AH. Anxiety and depression among school students in Jordan: Prevalence, risk factors, and predictors. Perspect Psychiat C. 2018;54(2):242-50.
33. Emmett PM, Jones LR. Diet, growth, and obesity development throughout childhood in the Avon longitudinal study of parents and children. Nutr Rev. 2015;73:175–206.
34. Pampel FC, Krueger PM, Denney JT. Socioeconomic disparities in health behaviors. Ann Rev Sociol. 2010;36:349-70.
35. Cevizci S, Uludag A, Topaloglu N, Babaoglu U, Celik M, Bakar C.
Developing students’ hand hygiene behaviors in a primary school from Turkey: A school-based health education study. International J Med Sc Public Health. 2014;4(2):155.
36. ALBashtawy M. Personal hygiene in school children aged 6–12 years in Jordan. Br J Sch Nur. 2015;10(8):395-8.
37. Reiss F. Socioeconomic inequalities and mental health problems in children and adolescents: A systematic review. Soc Sci Med.
2013;90:24–31.
38. Padilla-Moledo C, Ruiz JR, Castro-Piñero J. Parental educational level and psychological positive health and health complaints in Spanish children and adolescents. Child Care Hlth Dev.
2016;42(4):534–43.
39. Crede J, Wirthwein L, McElvany N, Steinmayr R. Adolescents’
academic achievement and life satisfaction: The role of parents’
education. Front Psychol. 2015;6:52.
40. Azizollah A. The relationship between children’s self-esteem and parents’ educational level. IJ-ARPED. 2013;2(3):11-21.
41. Mayor E. Gender roles and traits in stress and health. Front Psychol. 2015;6:779.
42. Al-Attiyah A, Nasser R. Gender and age differences in life satisfaction within a sex-segregated society: Sampling youth in Qatar. International Journal of Adolescence and Youth.
2016;21(1):84–95.
43. Casas F, Bălţătescu S, Bertran I, González M, Hatos A. School satisfaction among adolescents: Testing different indicators for its measurement and its relationship with overall life satisfaction and subjective well-being in Romania and Spain. Soc Indic Res.
2013;111:665–81.
44. Moksnes UK, Espnes GA. Self-esteem and life satisfaction in adolescents - gender and age as potential moderators. Qual Life Res. 2013;22(10):2921–8.
45. Malak MZ. Patterns of health-risk behaviors among Jordanian adolescent students. Health. 2015;7(1):58-70.