Copyright © Taiwan Association for Aerosol Research ISSN: 1680-8584 print / 2071-1409 online
doi: 10.4209/aaqr.2015.03.0144
Computer Modelling as a Tool in Characterization and Optimization of Aerosol Drug Delivery
Árpád Farkas
1*, Ágnes Jókay
1, Péter Füri
1, Imre Balásházy
1, Veronika Müller
2, Balázs Odler
2, Alpár Horváth
31 Centre for Energy Research Hungarian Academy of Sciences, 1121 Budapest, Konkoly Thege Miklós út 29-33, Hungary
2 Department of Pulmonology, Semmelweis University, 1125 Budapest, Diós árok 1/C, Hungary
3 Chiesi Hungary Kft., 1052 Budapest, Kristóf tér 4, Hungary
ABSTRACT
The number of patients with obstructive airway disease has been increasing worldwide. The delivery of aerosol drugs through the respiratory system has become a central element in the management of asthma and chronic obstructive pulmonary disease (COPD). The aim of this study was to validate and apply a stochastic whole respiratory tract deposition model in order to characterize airway deposition distribution of two different marketed drugs delivered in form of dry powders (Seretide® Diskus® and Symbicort® Turbuhaler®), and to analyze the possibility of computerized drug delivery optimization in the future. Spirometry measurements on 17 adult volunteers have been performed. Relationships between breathing parameters measured during diagnostic spirometry and those characterising breathing during drug administration through Diskus® and Turbuhaler® inhalers have been derived. The doses deposited in different anatomical regions of the respiratory tract and airway generation number specific deposited doses have been computed for the participating individuals based on both mass median aerodynamic diameter (MMAD) and detailed size distribution of the two drugs.
Although regional deposited doses were not very different in the two cases, airway generation number specific deposition distributions were sensitive to this input parameter, indicating the need for the whole size distribution when modelling airway deposition of aerosol drugs. Significant intersubject variability in terms of oropharyngeal, bronchial and acinar deposited doses have been found. The results highlight the necessity for and open the possibility of simulation assisted customized drug selection in the future.
Keywords: Therapeutic aerosols; Airway deposition; Aerosol drug delivery optimization; Seretide® Diskus®; Symbicort® Turbuhaler®.
INTRODUCTION
As an unwanted tendency, the number of patients with obstructive airway diseases has been increasing worldwide.
According to recent estimation, solely asthma affects about 300 million people in the world and every year around 255,000 people are losing their lives around the world because of this disease (Saillaja, 2014). By the same token, the prevalence of chronic obstructive pulmonary disease (COPD) is also sharply increasing and the World Health Organization (WHO) predicts that COPD will be the third leading cause of death by 2030 (World Health Statistics, 2008). The increased mortality is mainly driven by the expanding epidemic of smoking, reduced mortality from
* Corresponding author.
Tel.: +36(1)3922222/3404; Fax: +36(1)3922712 E-mail address: farkas.arpad@energia.mta.hu
other common causes of death (e.g., ischemic heart disease, infectious diseases), and aging of the world population (GOLD, 2015). The increasing number of asthmatic and COPD patients is also associated with enormous healthcare expenditures. Besides direct costs of hospitalization and medications, indirect costs mainly due to work and school loss and disability are also significant. At the same time, the rise of obstructive pulmonary diseases has triggered intensive research across the world. Most of the researchers are focusing on understanding the pathophysiology of these diseases and on finding a cure for it, but there is also research effort directed towards increasing patient compliance with medications. In the past 50–60 years, the delivery of aerosol drugs through the respiratory system has become a central element in the management of the above diseases (Marek et al., 2013). In spite of the large amounts of money invested in the development of new drugs, but much less in inhaler development, there are several unsolved problems that lower the efficiency of current asthma and COPD therapy. Examples include, but are not restricted to, the
improper inhaler/drug selection, lack of exhaustive patient education, the inadequate use of the inhaler, inaptness of producing the inhalation flow rate threshold in case of dry powder inhalers (DPIs) or incapability to synchronize the breath with the actuation of the drug in case of pressurized metered dose inhalers (pMDIs). Another category of reasons leading to inefficient drug delivery and ultimately to an inefficient treatment is connected to the improper selection of drug and/or breathing parameters when inhaling the drug.
Knowledge of the most relevant effects and parameters influencing airway deposition of therapeutic aerosols and knowledge of deposition distribution itself are essential for the assessment of their effect and a prerequisite for the optimization of drug delivery. Airway deposition of the inhaled therapeutic aerosols is commonly studied in vivo by gamma scintigraphy (Marek et al., 2013). The location of the radiolabelled aerosols deposited in the airways after their inhalation can be visualised by gamma cameras. Based on these images information on the quantity and spatial distribution of the deposited particles within the respiratory system can be obtained (Borgström et al., 1994; Hirst et al.; 2001; Warren et al., 2002; Pitcairn et al., 2005, among others). However, the resolution of such images is limited and information is lost also because of the two dimensional mapping of the realistic three dimensional deposition patterns.
For instance, due to the complex morphological structure of the airways, the spots in the central zone of a 2D scintigraphy image can represent not only radiolabelled aerosols deposited in the large bronchi, but also in the peripheral airways.
Realistic spatial distribution can be better reconstructed by using rotating gamma cameras (SPECT, single photon emission computed tomography), though this measurement takes longer and deposited particles can move meanwhile due to mucociliary clearance. Positron emission tomography (PET) holds the advantage of short exposure time and low amount of labelling nuclides; however, it operates with short- lived isotopes requiring the existence of an accelerator nearby. By combining SPECT and PET with CT (computed tomography) imaging information on anatomy and deposition can be superimposed (Greenblatt et al., 2015). Other innovative and promising visualisation techniques, such as endo-bronchial ultrasound (EBUS) or optical coherence tomography (OCT) are presently under development, validation and standardization (Conway, 2012). An alternative way of studying the deposition-distribution of aerosol drugs within the airways avoiding the ethical problems and technical barriers of in vivo studies is to perform computer modelling. In addition, computer simulations are non- invasive, cost effective and repeatable.
An increasing number of studies modelling airway transport and deposition of aerosol drugs are available in the open literature. However, most of these studies are focusing either on general aspects of airway deposition of inhaled therapeutic particles (e.g., Finlay, 2001; Farkas et al., 2006) or on phenomena specific to inhalation of aerosol drugs (e.g., hygroscopicity or electric charge effects;
Asgharian, 2004; Xi et al., 2014), but there is a lack of works modelling the deposition of concrete available drugs based on realistic measured breathing patterns and specific
drug size distributions.
The aim of this study was to apply state of the art computational methods in order to characterize the deposition distribution of two marketed aerosol drugs in the respiratory system and to assess the possibility of future computer assisted personalized drug choice and delivery. As a result of such an optimised aerosol drug administration the chances of unwanted side-effects would be minimised and the efficiency of the treatment enhanced.
METHODS
In this study sample simulations on airway transport and deposition of two dry powder inhalation drugs commonly used in asthma and COPD therapy, namely Seretide® Diskus® (fluticasone propionate/salmeterol xinafoate) and Symbicort® Turbuhaler® (budesonide/formoterol fumarate dihydrate), have been performed. In addition to their large scale use, there is a relatively large amount of data available in the open literature about these two inhalation corticosteroid – long-acting β2-agonist (ICS-LABA) combination drugs.
Some of these data represent key inputs for appropriate modelling of drug deposition. It is worth noting that the primary objective of the study was to demonstrate the feasibility of validated numerical models to study and optimize of aerosol drug delivery, rather than deciding which of the two drugs is more appropriate in general.
To simulate realistic scenarios, spirometry measurements on 17 healthy adult volunteers have been performed with a PDD-301/sh Piston type spirometer. Volunteers selected for the study were aged 27–57 years (mean, 36 years). Mean weight and height was 73.5 kg (range, 59–109 kg) and 177.7 cm (range, 167–188 cm), respectively. The volunteers had normal lung function with forced vital capacity (FVC) and forced expiratory volume in the first second (FEV1) >
80% of predicted. Since FEV1 and its ratio to the forced vital capacity (FEV1/FVC) of healthy individuals and well controlled mild asthmatics do not differ, present results can be considered as characteristic of such patients. At the beginning, normal spirometry tests were performed on the volunteers without any inhaler. After these measurements, the volunteers were instructed about the use of inhalers and about the desired mode of breathing. They were asked to inhale strongly after a forced expiration, hold their breath about ten seconds, and then exhale slowly. The spirometer was inserted between the mouth of the volunteers and the inhaler. Inhalation was performed through the inhaler, which was then removed during breath-hold. Each individual inhaled through both inhalers included in this study (Diskus® and Turbuhaler®). The inhalers were not filled with active drug. Since flow resistance of an empty inhaler is quite similar to the resistance of the filled device, this could not alter the accurateness of flow metric measurements. The recorded parameters needed for the modelling were inspiratory vital capacity (IVC), peak inspiratory flow (PIF), inhalation time, breath-hold time and exhalation time. The functional residual capacity (FRC) values were weight, height and gender specific reference values derived from Quanjer et al. (1993).
The simulations were performed by the newest version of a whole lung deposition model, named Stochastic Lung Deposition Model. The model was originally developed by Koblinger and Hofmann (1985) and continuously extended during the last three decades (Koblinger and Hofmann, 1990; Hofmann and Koblinger, 1992; Hofmann et al., 2002;
Hofmann et al., 2006). The model computes the fraction of the particles deposited in each anatomical region of the airway system and it also yields the deposition fraction as a function of airway generation number. By definition, deposition fraction is the ratio of the number of particles deposited in a certain airway segment to the number of inhaled particles. By the same token, deposition mass (or dose) fraction is the ratio of the deposited mass (or dose) in the region of interest to the inhaled mass (or dose).
Computation of upper airway deposition fraction is based on empirical relationships incorporated into the model (Stahlhofen et al., 1989). Particle transport and deposition within the lung is modelled by tracking each particle in a stochastic asymmetric structure. The variability of airway diameters, lengths, branching and gravity angles, constrained by correlations among some of these parameters, is described mathematically by probability density- and correlation functions. In this model the bronchial airways contain both bronchi and bronchioli, starting from the trachea (as generation 1) and ending with the terminal bronchioles.
The airway generation number of terminal bronchioles varies from 12 to 21. The airway structure is selected by Monte Carlo techniques from the empirical distributions of geometric parameters. The acinar airways start with four generations of respiratory bronchioles and contain the alveolar ducts, the alveoli and the alveolar sacs. The maximum airway generation number, corresponding to alveolar sacs, varies between 18 and 33. Deposition of particles in a given airway generation is computed by analytical equations.
Inertial impaction, gravitational settling and Brownian diffusion are considered as deposition mechanisms. Due to the variability of the airway geometry and related flows, particle deposition may vary along different paths. Thus, penetration probabilities to a given airway generation, i.e., the probability of inhaled drug particles to reach that airway generation, exhibits significant fluctuations, depending on the
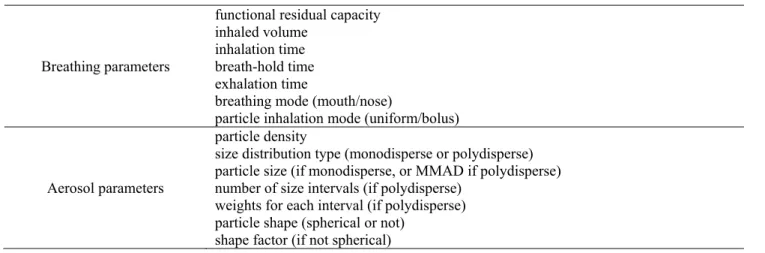
individual history of each particle in upstream airways. By simulating the random paths of many particles, typically one hundred thousand, statistical means can be calculated for total, regional and generational deposition. The main breathing parameters and aerosol parameters which serve as inputs for the model are listed in Table 1.
MODEL VALIDATION
The lung deposition model used in this study has been validated against the results of both in vitro (deposition measurements in airway casts) and in vivo (using gamma scintigraphy) airway deposition measurements of different types of aerosols. Validation of the model for medical aerosols emitted by pMDI has been recently performed (Jókay et al., 2015). In the current study we present a comparison of simulation results with the outcomes of a series of in vivo deposition measurements with aerosol drugs emitted by DPI. One of the most studied cases in the literature is the deposition of budesonide from Turbuhaler® by means of scintigraphy. An extensive survey of the literature demonstrated that lung deposition of budesonide measured by different investigators ranged between 14.2%
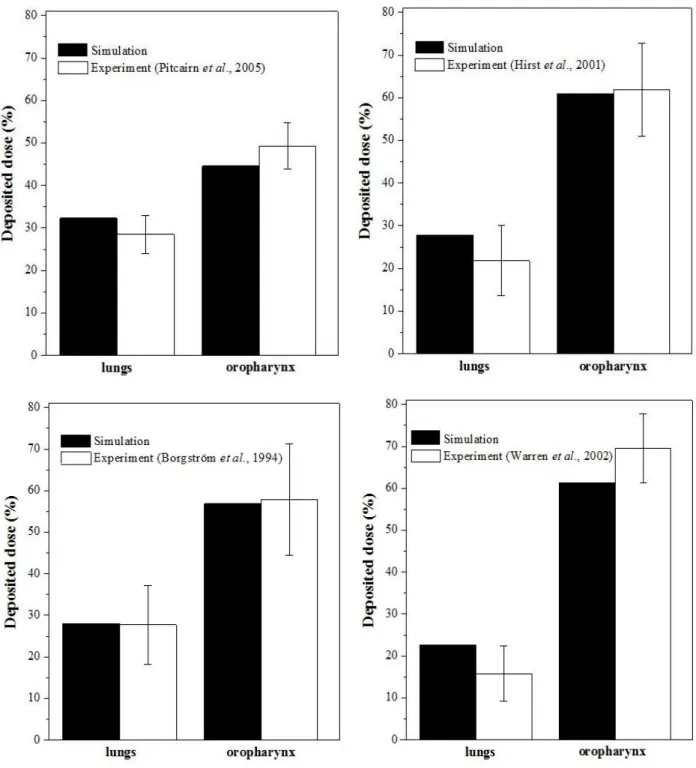
(Newman et al., 1989) and 32% (Thorsson et al., 1994) of the metered dose. The notable differences can be due to the inherent dosing characteristics of Turbuhaler®, the employed radiolabelling method, the different patient groups and breathing patterns (different inhalation flow rates and breath-hold times). In this work, we selected some of those in vivo studies with available information on each parameter necessary for the simulations (Borgström et al., 1994; Hirst et al.; 2001; Warren et al., 2002; Pitcairn et al., 2005). The results of the above works and our corresponding simulation results are depicted in Fig. 1. The doses deposited in the oropharyngeal region and in the lungs are expressed as a function of the metered dose. The size distributions of the drug and the breathing parameters during drug intake needed for the simulations were derived from the same papers.
Fig. 1 demonstrates that our simulation results in terms of extrathoracic and lung deposition percentages are in line with the previously published results of experimental deposition measurements. The differences are usually within the Table 1. Breathing parameters and aerosol characteristics representing the primary inputs of the deposition model.
Breathing parameters
functional residual capacity inhaled volume
inhalation time breath-hold time exhalation time
breathing mode (mouth/nose)
particle inhalation mode (uniform/bolus)
Aerosol parameters
particle density
size distribution type (monodisperse or polydisperse) particle size (if monodisperse, or MMAD if polydisperse) number of size intervals (if polydisperse)
weights for each interval (if polydisperse) particle shape (spherical or not)
shape factor (if not spherical)
Fig. 1. Comparison of airway deposition simulation results with the outcome of scintigraphic deposition measurements of budesonide emitted by Turbuhaler® performed by four different investigators. The dose deposited in different anatomical regions is expressed as a percentage of the metered dose. The measured dose values are averages of the measurements on more subjects, while the error bars represent the dose range of the individual measurements (Pitcairn et al., 2005) or standard deviation (Borgström et al., 1994; Hirst et al., 2001; Warren et al., 2002).
intersubject variability of the results of the measurements.
The best agreement is with the measured deposition results of Borgström et al. (1994). Since these in vivo measurements were compared also with in vitro measurements (Delvadia et al., 2013) and good agreement was found, it can be stated that present simulation results are in line with the results of both in vivo and in vitro deposition experiments.
The good matching indicates that our model is accurate
enough and suitable for the simulation of aerosol drug deposition within the airways.
RESULTS AND DISCUSSION
Airway deposition distribution of any kind of inhaled aerosol particles depends on aerosol characteristics, airway geometry and breathing parameters. However, inhalation
of aerosol drugs is a special case from many points of view. First of all, contrary to the environmental aerosols which are inhaled predominantly by nose breathing (except during heavy physical exercise; ICRP66, 1994), medical aerosols follow the oropharyngeal route. Since the nose is a better aerosol filter than the mouth, aerosol drugs have a better chance to reach the lung. Other parameters of the exposure are the velocity of the particles/droplets, their concentration and spatio-temporal distribution. While the velocity of dry powders can be approximated to be equal to the speed of the inhaled air, the initial velocity of droplets is characteristic of the pMDI device they are emitted from. Generally, there is variability in terms of emitted droplet velocity, drug emission angle, concentration of the emitted particles and bolus length among different pMDIs. All these particularities should be carefully taken into account when modelling the fate of the inhaled therapeutic aerosols. In this study we restrict our analysis to the case of DPIs, thus we assume that velocity and entrance angle of the particles entering the respiratory system is similar to the speed and orientation profile of the inhaled air.
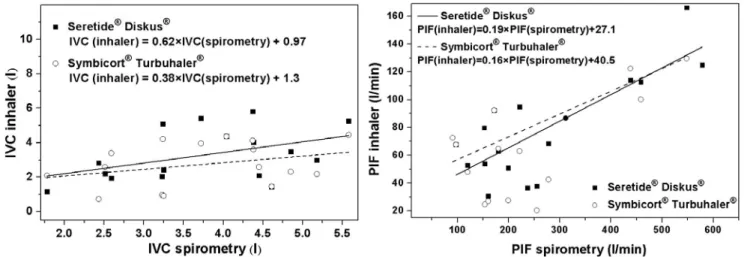
Variability of breathing pattern among different healthy individuals leads to an intersubject variability for particle deposition (Majid et al., 2011). The scatter of breathing parameter values becomes even more pronounced in the case of patients with obstructive lung diseases. Breathing capabilities of each individual should be accounted for when choosing the appropriate aerosol drug and inhaler. Since patients are diagnosed primarily based on spirometry tests, actually this information is available at the moment of the prescription of the drug. However, inhalers have specific resistance and the breathing parameter values acquired during a normal lung function test are different from those recorded during the inhalation of aerosol drugs. Left panel of Fig. 2 shows the inspiratory vital capacity measured when inhaling through Seretide® Diskus® and Symbicort® Turbuhaler® inhalation devices as a function of IVC of the same individuals derived from standard spirometry tests. On the right panel the same relationships for the corresponding
PIF values are presented.
Based on Fig. 2 the measured breathing parameter values of an individual depend on whether they are acquired without an inhalation device (normal spirometry) or they are measured when inhaling through an inhaler. On the other hand, they also depend on the specific resistance of each inhaler. Both plots indicate a higher airflow resistance for Turbuhaler® than for Diskus®, which is in line with the outcome of previous studies (Palen, 2003; Melani et al., 2005). For an accurate and reliable numerical modelling the knowledge of parameter values characterizing breathing when inhaling through the inhalation device is of key importance. From the perspective of disease management it is also of great importance to know whether a patient is able to apply a correct breathing mode or not. Dry powder inhalers usually require a minimum inhalation flow rate to emit a considerable amount of fine particles with chances to reach the intrathoracic airways. Since standard spirometry data alone are not sufficient to decide whether a patient is able to efficiently use a given inhaler or not, the establishment of relationships similar to the ones deduced in Fig. 2 for all the marketed DPIs would be necessary. In order to establish statistically relevant correlations, these relationships should rely on measurements on a much higher number of individuals (and possibly more measurements for the same patient) than in the present study, preferably grouped into types and levels of diseases, categories of ages and genders.
Airway geometry is a major determinant of aerosol drug deposition. Besides the age and gender dependence of the geometry and the intersubject and other types of anatomical variabilities, there are significant morphological and morphometrical differences between healthy and diseased airways. The modified airway geometry of asthmatics and COPD patients may influence the fate of the inhaled medication. Martonen et al. (2003) have shown that deposition efficiency of the inhaled particles was strongly dependent on the degree of the reduction of airway lumen.
The deposited fraction and both regional (Horváth et al., 2011) and local (Farkas et al., 2006; Farkas and Balásházy,
Fig. 2. IVC values measured during inhalation through Seretide® Diskus® and Symbicort® Turbuhaler® as a function of spirometric IVC values of the same volunteers (left panel), and PIF values measured during inhalation through Seretide® Diskus® and Symbicort® Turbuhaler® as a function of spirometric PIF values of the same volunteers (right panel).
2007) distribution of the deposited particles changes when the airways are constricted. We have also adapted our lung deposition model presented in the Methods section to the case of narrowed airways (see Horváth et al., 2011), however, in this work we studied the deposition of aerosol drugs only in healthy individuals. The results are applicable also to drug delivery in the case of well controlled asthmatics.
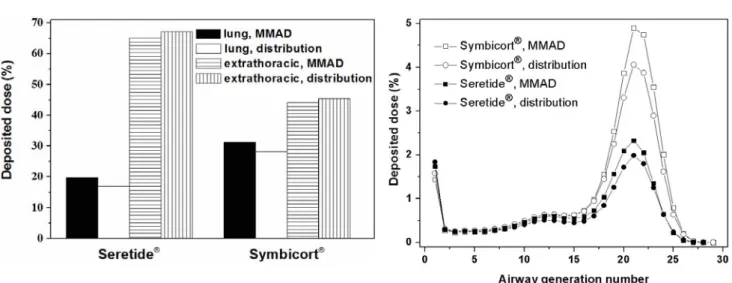
The size of a particle is the dominant parameter influencing its transport and deposition in the airways. Aerosol drugs are usually characterized by their mass median aerodynamic diameter (MMAD) and the corresponding geometric standard deviation (GSD). In many cases fine particle fraction (FPF, which is the fraction of the particles with diameters smaller than 5 µm) is also provided, indicating the fraction of particles potentially reaching the lung. Although these parameters provide useful information on the size of the particles, for an accurate modelling the knowledge of the whole size distribution is needed. It is worth noting that size distribution and consequently MMAD and FPF values characterizing the drugs emitted by DPIs depend on inhalation flow rate. Kamin et al. (2002) have demonstrated that besides flow rate, air acceleration can also influence these parameters. The dependence of MMAD on PIF in case of Seretide® Diskus® and Symbicort® Turbuhaler® has been quantified by Tarsin et al. (2006). However, the flow rate dependence of the whole distribution of the marketed drugs is not available in the published literature. In case of Seretide® Diskus® and Symbicort® Turbuhaler® the particle size profile has been determined by various methods, e.g., by impactor (Johal et al., 2013), by aerodynamic particle sizer spectrometer (Tamura et al., 2012) or by liquid chromatography (Assi et al., 2006), but only at about 30 L min–1 and 60 L min–1 flow rates. Therefore, for the simulations we selected those volunteers whose PIF was around 60 L min–1. Average PIF of these eight volunteers was 62.48 L min–1 (range, 52.2–67.8), while the mean flow rate averaged over the eight individuals was 52.6 L min–1 (range, 50.4–62.5). Measured size distributions and MMAD values characterizing Seretide® Diskus® and Symbicort® Turbuhaler® were adopted from Johal et al. (2013). Left panel of Fig. 3 depicts the computed deposition fractions as a percentage of the metered dose (specified in the Summary of Product Characteristics of each drug) in the extrathoracic airways and in the lung, if MMAD (3.8 µm for Seretide® and 2.5 µm for Symbicort®) or the size-distributions of the particles emitted by Diskus® and Turbuhaler® inhalation devices are taken into account as input data. The higher upper airway deposited dose of Seretide® compared to Symbicort® is due to the higher number of large particles in Seretide®, which deposit by impaction. Since more particles of this drug are filtered by the mouth-throat region, lung deposition is lower in case of Seretide®. By the same token, based on the left panel of the figure the regional deposition percentages are not very different when MMAD or size distribution is considered. Due to the nonlinear dependency of upper airway deposition efficiency on particle diameter (Cheng, 2003; Grgic et al., 2004) even a symmetrical size distribution (around MMAD) yields a higher extrathoracic deposition than the MMAD based
deposition value. Size distribution measurements revealed that while particles from Symbicort® Turbuhaler® can be characterized by a relatively narrow monomodal distribution, Seretide® particles are more polydisperse with a more elongated shape of the right tail of their size distribution curve (Tamura et al., 2012). This difference is translated into a higher gap between the computed upper airway doses based on MMAD and size distribution in the case of this later drug (Seretide®). When studying the distribution of the deposition within an anatomical region (e.g., lung) the use of exact size distributions instead of MMADs becomes more important. Right panel of Fig. 3 depicts the airway generation number specific dose deposition for Seretide® Diskus® and Symbicort® Turbuhaler®. It is worth noting that such detailed information on the spatial distribution of the deposited drug cannot be obtained with scintigraphy. The figure demonstrates that although the character of deposition curves corresponding to MMAD and size distribution cases is quite similar, there are notable differences at the acinar peak (around airway generation 21).
Nevertheless, deposition in the conductive airways seems to be well described by simulations based on MMAD. It is worth noting that aerosol drugs with a broader size spectrum (higher GSD) and highly asymmetrical size distribution may yield less appropriate deposition data if only MMAD is considered. The relatively good matching in the present case enables us to model airway deposition of the two selected drugs for all volunteers by considering the change of MMAD with inhalation flow rate. Such relationships between MMAD and PIF have been derived by Tarsin et al. (2006) for both Seretide® and Symbicort®. Fig. 4 demonstrates the individual regional (extrathoratic and different regions of the lung) dose fraction values of Seretide® and Symbicort® for the 17 volunteers participating in this study. Lung deposition is divided into bronchial (Br) and acinar (Ac) deposition and drug deposition in the respiratory bronchioles (Brr) is also presented.
Average values of computed doses deposited in the extrathoracic airways (ET, including mouth, pharynx and larynx) and in the lung (Br + Ac) depicted in Fig. 4 are quite similar to the corresponding values in Fig. 3. However, a significant intersubject variability of the deposited doses can be found in every distinct region of the respiratory system for both studied drugs. This raises the possibility to choose between the different drugs if high deposition in a certain airway region of a given patient is desired, that is, the region is a target area for a given agent with high density of receptors. For instance, Haughney et al. (2010) emphasized that based on works of Carstairs et al. (1985) and Mak and Barnes (1990) large and conductive airways (down to about airway generation 16) may be preferred for bronchodilators (like the LABA components of Seretide® and Symbicort®) because in this part of the airways β2 receptors are present in conjunction with smooth muscle.
In the present study for 9 individuals Seretide® yielded higher deposition (as a percentage of the metered dose) in this region, while deposition of Symbicort® was higher in the case of 8 individuals. However, to avoid unwanted side effects not only the dose deposited in the targeted region
Fig. 3. Regional (left panel) and airway generation number specific (right panel) deposited doses as a percentage of the metered dose in case of Seretide® Diskus® and Symbicort® Turbuhaler® if either MMAD or the whole size distribution is taken into account.
Fig. 4. Calculated individual deposited doses in the extrathoracic (ET), bronchial (Br), acinar (Ac) and respiratory bronchiolar (Brr) regions of the airways for Seretide® Diskus® and Symbicort® Turbuhaler® as a percentage of the metered doses.
should be maximized, but also the dose depositing outside this zone needs to be minimized. In the present case, the ratio of the dose deposited in the large bronchi and bronchioli (denoted by Br) to the dose depositing elsewhere within the airways (ET+Ac) was higher for Seretide® in 5 cases and for Symbicort® in 12 cases. Right panel of Fig. 3 demonstrates that deposition is the highest in airway generations 16–25. Respiratory bronchioles (Brr) fall in this interval. For this reason, it is an essential question whether Brr is a target area or not. The consideration of this part of the airways as target zone for β2 agonist bronchodilators is supported by the observation that the relative density of β- adrenergic receptors increases with the increase of airway generation number (Ikeda et al., 2012). At the same time, the amount of smooth muscle is considerably reduced in this partly alveolated region of the airways. In our case if not only the conductive airways (Br), but also the Brr region is targeted, then Seretide® yields higher deposition in 7 cases, while Symbicort® in 10 individuals. It is also
important to note that the location of target zone for the ICS component does not coincide with the target area of the LABA component of the same combination drug. A more uniform lung deposition may be preferred for ICS to reach also the small airways (Hamid et al., 1997; Tulic and Hamid, 2006). This suggests that the above described quantities (the dose deposited in the Br region, the dose deposited in the Br region divided by the dose deposited in the ET and Ac regions, the dose deposited in the Br and Brr regions) may not be the appropriate indicators of the efficiency of drug delivery in the case of combination (ICS- LABA) drugs. Moreover, considering deposition densities (deposited dose divided by the surface area of that zone) instead of deposited percentage could be a better indicator.
It falls out of the scope and possibilities of this study to decide on the appropriate target zone and on the most suitable indicator of aerosol drug delivery efficiency. Nevertheless, the above examples demonstrate that once such an indicator defined, computer modelling can be a powerful tool not
only in the characterization of drug deposition, but also in helping pulmonologists to choose the appropriate drug and device for delivery. Obviously, numerical modelling cannot substitute for clinical observation and experience, but validated and reliable models could complement them in the future.
CONCLUSIONS
A stochastic whole respiratory tract deposition model has been adapted to the special case of therapeutic aerosols.
Comparison of the computed deposition doses with the results of several in vivo deposition experiments reveals that our computer model is suitable for the modeling of airway transport and deposition of aerosol drugs. Relationships between breathing parameters measured during diagnostic spirometry and those characterising breathing during drug administration through Diskus® and Turbuhaler® inhalers have been derived. These relationships are links between the routinely measured lung function data and the breathing parameters characterizing the intake of drugs through inhalers with specific resistance. These kinds of relationships are useful also when deciding whether a patient is able to properly use a given inhalation device. Regional deposited doses were not very different when MMAD or detailed size distribution was considered. However, generation number specific deposition distributions were sensitive to this input parameter, indicating the need for the whole size distribution when modelling airway deposition of aerosol drugs. The observed interindividual differences in terms of oropharyngeal, bronchial and acinar deposited doses highlight the necessity for customized drug selection and delivery in the future. Validated numerical models can be a powerful tool in assisting the specialists in the selection of appropriate drug, device and breathing mode to deliver the right amount of the most suitable medication to the right regions of the airways.
ACKNOWLEDGMENTS
This work has been supported by the KTIA_AIK_12-1- 2012-0019 Hungarian project.
REFERENCES
Asgharian, B. (2004). A Model of Deposition of Hygroscopic Particles in the Human Lung. Aerosol Sci. Technol. 38:
938–947.
Assi, K.H., Tarsin, W. and Chrystin, H. (2006). High Performance Liquid Chromatography Assay Method for Simultaneous Quantitation of Formoterol and Budesonide in Symbicort Turbuhaler. J. Pharm. Biomed. Anal. 41:
325–328.
Borgström, L., Bondesson, E., Morén, F., Trofast, E. and Newman, S.P. (1994). Lung Deposition of Budesonide Inhaled via Turbuhaler: A Comparison with Terbutaline Sulphate in Normal Subjects. Eur. Respir. J. 7: 69–73.
Carstairs, J.R., Nimmo, A.J. and Barnes, P.J. (1985).
Autoradiographic Visualization of Beta-adrenoceptor
Subtypes in Human Lung. Am. Rev. Respir. Dis. 132:
541–547.
Cheng, Y.S. (2003). Aerosol Deposition in Extrathoracic Region. Aerosol Sci. Technol. 37: 659–671.
Conway, J. (2012). Lung Imaging - Two Dimensional Gamma Scintigraphy, SPECT, CT and PET. Adv. Drug Delivery Rev. 64: 357–368.
Delvadia, R., Hindle, M., Longest, W. and Byron, P.R.
(2013). In Vitro Tests for Aerosol Deposition II: IVIVCs for Different Dry Powder Inhalers in Normal Adults. J.
Aerosol Med. Pulm. Drug Deliv. 26: 138–144.
Farkas, Á., Balásházy, I. and Szőcs, K. (2006).
Characterization of Regional and Local Deposition of Inhaled Aerosol Drugs in the Respiratory System by Computational Fluid and Particle Dynamics Methods. J.
Aerosol Med. 19: 329–343.
Farkas, Á. and Balásházy, I. (2007). Simulation of the Effect of Local Obstructions and Blockage on Airflow and Aerosol Deposition in Central Human Airways. J.
Aerosol Sci. 38: 865–884.
Finlay, W.H. (2001). The Mechanics of the Inhaled Pharmaceutical Aerosols - An Introduction. Academic Press, Elsevier.
Global Initiative for Chronic Obstructive Lung Disease (GOLD) (2015). Global Strategy for the Diagnosis, Management, and Prevention of COPD. www.goldcopd.
org.
Greenblatt, E.E., Winkler, T., Harris, R.S., Kelly, V.J., Kone, M. and Venegas J. (2015). Analysis of Three- dimensional Aerosol Deposition in Pharmacologically Relevant Terms: Beyond Black and White ROIs. J.
Aerosol Med. Pulm. Drug Deliv. 28: 116–129.
Grgic, B., Finlay, W.H., Burnell, P.K.P. and Heenan, A.F.
(2004). In Vitro Intersubject Deposition Measurements in Realistic Mouth – Throat Geometries. J. Aerosol Sci.
35: 1025–1040.
Hamid, Q., Song, Y., Kotsimbos, T.C., Minshall, E., Bai, T.R., Hegele, R.G. and Hogg J.C. (1997). Inflammation of small Airways in Asthma. J. Allergy. Clin. Immunol.
100: 44–51.
Haughney, J., Price, D., Barnes, N.C., Virchow, J.C., Roche, N. and Chrystyn H. (2010). Choosing Inhaler Devices for People with Asthma: Current Knowledge and Outstanding Research Needs. Respir. Med. 104: 1237–
1245.
Hirst, P.H., Bacon, R.E., Pitcairn, G.R., Silvasti, M. and Newman, S.P. (2001). A Comparison of the Lung Deposition of Budesonide from Easyhaler, Turbuhaler and pMDI Plus Spacer in Asthmatic Patients. Respir.
Med. 95: 720–727.
Hofmann, W. and Koblinger, L. (1992). Monte Carlo Modelling of Aerosol Deposition in Human Lungs. Part II: Deposition Fractions and Their Sensitivity to Parameter Variations. J. Aerosol Sci. 21: 675–688.
Hofmann, W., Asgharian, B. and Winkler-Heil, R. (2002).
Modelling Intersubject Variability of Particle Deposition in Human Lungs. J. Aerosol Sci. 33: 219–235.
Hofmann, W., Winkler-Heil, R. and Balásházy, I. (2006).
The Effect of Morphological Variability on Surface
Deposition Densities of Inhaled Particles in Human Bronchial and Acinar Airways. Inhalation Toxicol. 18:
809–819.
Horváth, A., Balásházy, I., Farkas, Á., Sárkány, Z., Hofmann, W., Czitrovszky, A. and Dobos, E. (2011). Quantification of Airway Deposition of Intact and Fragmented Pollens.
Int. J. Environ. Health Res. 21: 427–440.
ICRP Publication 66 (1994). Human Respiratory Tract Model for Radiological Protection. Annals of the ICRP 24, Pergamon Press.
Ikeda, T., Anisuzzaman, A.S.M., Yoshiki, H., Sasaki, M., Koshiji, T., Uwada, J., Nishimune, A., Itoh, H. and Muramatsu, I. (2012). Regional Quantification of Muscarinic Acetylcholine Receptors and β-Adrenoceptors in Human Airways. Br. J. Pharmacol. 166: 1804–1814.
Johal, B., Howald, M., Fischer, M., Marshall, J. and Venthoye, G. (2013). Fine Particle Profile of Fluticasone Propionate-formoterol Fumarate versus Other Combination Products: The DIFFUSE Study. Comb. Prod. Ther. 3:
39–51.
Jókay, Á., Farkas, Á., Füri, P., Balásházy, I., Horváth, A.
and Müller, V. (2015). Numerical Modelling of Airway Deposition of Inhalation Corticosteroid-ling Acting β2
Agonist (ICS-LABA) Combined Aerosol Drugs Commonly Used in Asthma Therapy (In Hungarian).
Med. Thor. 68: 43–54.
Kamin, W.E.S., Genz, T., Roeder, S., Scheuch, G., Trammer, T., Juenemann, R. and Cloes, R.M. (2002).
Mass Output and Particle Size Distribution of Glucocorticosteroids Emitted from Different Inhalation Devices Depending on Various Inspiratory Parameters.
J. Aerosol Med. 15: 65–73.
Koblinger, L. and Hofmann, W. (1985). Analysis of Human Lung Morphometric Data for Stochastic Aerosol Deposition Calculations. Phys. Med. Biol. 30: 541–556.
Koblinger, L. and Hofmann, W. (1990). Monte Carlo Modelling of Aerosol Deposition in Human Lungs. Part I: Simulation of Particle Transport in a Stochastic Lung Structure. J. Aerosol Sci. 21: 661–674.
Majid, H., Winkler-Heil, R. and Hofmann, W. (2011). Effect of Intersubject Variability of Extrathoracic Morphometry, Lung Airways Dimensions and Respiratory Parameters on Particle Deposition. J. Thorac. Dis. 3: 156–170.
Mak, J.C. and Barnes, P.J. (1990). Autoradiographic Visualization of Muscarinic Receptor Subtypes in Human and Guinea Pig Lung. Am. Rev. Respir. Dis. 141: 1559–
1568.
Marek, S.R., Smyth, H.D.C., Garcia-Contreras, L., Cooney, D.J., Garmise, R.J., Jones, L.D. and Hickey, A.J.
(2013). Medical and Pharmaceutical Aerosols. In Aerosols Handbook. Measurement, Dosimetry and Health Effects, Ruzer, L.S. and Harley, N.H. (Eds.), CRC Press: Boca Raton.
Martonen, T., Fleming, J., Schroeter, J., Conway, J. and Hwang, D. (2003). In Silico Modelling of Asthma. Adv.
Drug Deliv. Rev. 55: 829–849.
Melani, A.S., Bracci, L.S. and Rossi, M. (2005). Reduced Peak Inspiratory Effort through the Diskus and the Turbuhaler due to Mishandling is Common in Clinical Practice. Clin. Drug Invest. 25: 543–549.
Newman, S.P., Morén, F., Trofast, E., Talee, N. and Clarke, S.W. (1989). Deposition and Clinical Efficacy of Terbutaline Sulfate from Turbuhaler, a New Multi- dose Powder Inhaler. Eur. Respir. J. 2: 247–252.
Palen, J. (2003). Peak Inspiratory through Diskus and Turbuhaler, Measured by Means of Peak Inspiratory Flow Meter (In-Check DIAL). Resp. Med. 97: 285–289.
Pitcairn, G., Reader, S., Pavia, D. and Newman, S. (2005).
Deposition of Corticosteroid Aerosol in the Human Lung by Respimat Soft Mist Inhaler Compared to Deposition by Metered Dose Inhaler or by Turbuhaler Dry Powder Inhaler. J. Aerosol Med. 18: 264–272.
Quanjer, P.H., Tammeling, G.J., Cotes, J.E., Pedersen, O.F., Peslin, R. and Yernault, J.C. (1993). Lung Volumes and Forced Vital Capacity Flows. Report Working Party Standardization of Lung Function Tests, European Community for Steel and Coal. Official Statement of the European Respiratory Society. Eur. Resp. J. 16: 5–40.
Saillaja, A.K. (2014). An Overall Review on Chronic Asthma. Int. J. Pharm. Drug Anal. 2: 275–279.
Stahlhofen, W., Rudolf, G. and James, A.C. (1989).
Intercomparison of Experimental Regional Aerosol Deposition Data. J. Aerosol Med. 2: 285–308.
Tamura, G., Sakae, H. and Fujino, S. (2012). In Vitro Evaluation of Dry Powder Inhaler Devices of Corticosteroid Preparations. Allergol. Int. 61: 149–154.
Tarsin, W.Y., Pearson, S.B., Assi, K.H. and Chrystyn, H.
(2006). Emitted Dose Estimates from Seretide Diskus and Symbicort Turbuhaler Following Inhalation by Severe Asthmatics. Int. J. Pharm. 316: 131–137.
Thorsson, L., Edsbácker, S. and Conradson, T.B. (1994).
Lung Deposition of Budesonide from Turbuhaler is Twice that from a Pressurized Metered Dose Inhaler p-MDI.
Eur. Resp. J. 7: 1832–1844.
Tulic, M.K. and Hamid, Q. (2006). New Insights into the Pathophysiology of the Small Airways in Asthma. Clin.
Chest. Med. 27: 41–52.
Warren, S., Taylor, G., Smith, J., Buck, H. and Parry- Billings, M. (2002). Gamma Scintigraphic Evaluation of a Novel Budesonide Dry Powder Inhaler Using a Validated Radiolabelling Technique. J. Aerosol Med. 15: 15–25.
World Health Statistics (2008). http://www.who.int/whosis /whostat/2008/en.
Xi, J., Si, X. and longest W. (2014). Electrostatic Charge Effects on Pharmaceutical Aerosol Deposition in Human Nasal-laryngeal Airways. Pharmaceutics 6: 26–35.
Received for review, March 4, 2015 Revised, July 21, 2015 Accepted, August 13, 2015