INTERNATIONAL ELECTRONIC JOURNAL OF MATHEMATICS EDUCATION e-ISSN: 1306-3030. 2020, Vol. 15, No. 1, em0546 https://doi.org/10.29333/iejme/5882
Article History: Received 29 April 2019 Revised 24 May 2019 Accepted 26 May 2019
© 2020 by the authors; licensee Modestum Ltd., UK. Open Access terms of the Creative Commons Attribution 4.0 International License (http://creativecommons.org/licenses/by/4.0/) apply. The license permits unrestricted use, distribution, and reproduction in any medium, on the condition that users give exact credit to the original author(s) and the source, provide a link to the Creative Commons license, and indicate if they made any changes.
OPEN ACCESS
Formalization of Odometer Thinking and Indices for the Classification of Combinatorial Strategies
Zsófia Gál-Szabó 1,2*, Ákos Bede-Fazekas 3,4
1 Doctoral School of Education, University of Szeged, Szeged, HUNGARY
2 MTA-SZTE Science Education Research Group, Szeged, HUNGARY
3 MTA Centre for Ecological Research, Institute of Ecology and Botany, Vácrátót, HUNGARY
4 MTA Centre for Ecological Research, GINOP Sustainable Ecosystems Group, Tihany, HUNGARY
* CORRESPONDENCE: szabo.zsofi@edu.u-szeged.hu
ABSTRACT
Students’ solutions of enumerative combinatorial problems may be assessed along two main dimensions: the correctness of the solution and the method of enumeration. This study looks at the second dimension with reference to the Cartesian product of two sets, and at the ‘odometer’
combinatorial strategy defined by English (1991). Since we are not aware of any algorithm-based methods suitable for analysing combinatorial strategies on a large-scale sample, in this study we endeavour to formalize the odometer strategy and recommend a method of algorithm-based classification of solutions according to the strategy used. In the paper (1) odometer thinking is described using a formula based on its definition, and (2) constancy and cyclicity are characterized using mathematical formulae, which are then used to describe odometer thinking in a computationally efficient manner (‘odometricality’). Our hypothesis, i.e. that odometer thinking may be approximated by the odometricality index, is successfully tested on a random sample of automatically generated solutions (n=10,000) by calculating the correlation between odometricality and the formal measure of odometer thinking. Finally, we offer a method (and R script) for classifying strategy use.
Keywords: combinatorial reasoning, combinatorial strategies, enumerative combinatorial problems, odometer strategy, Cartesian product
INTRODUCTION
Combinatorial reasoning is both a part of mathematics education (e.g. DeTemple & Webb, 2014; English, 2016; Lockwood, 2013) and a component of thinking skills (Adey & Csapó, 2012). Teaching combinatorics and thus fostering the development of combinatorial reasoning is an important task of education as it exert a positive effect on many other areas. This is because combinatorial reasoning is used in many disciplines, such as physics, chemistry, biology, engineering, social sciences (e.g. Kapur, 1970), computer science, probability theory and statistics (e.g. DeTemple & Webb, 2014). Furthermore, it is an essential part of experimental thinking (see e.g. Poddiakov, 2011), contributes to understanding science knowledge (e.g. Bitner, 1991;
Cavallo, 1996; Yilmaz & Alp, 2006), is an important component of creativity (e.g. Simonton, 2010) and plays a role in problem solving (e.g. English, 1993). However, combinatorics is a difficult topic in mathematics education challenging both students’ knowledge and educators’ instruction methods (e.g. Mashiach Eizenberg
& Zaslavsky, 2004; Melusova & Vidermanova, 2015; Szitányi & Csíkos, 2015). Among other reasons, that is
Gál-Szabó & Bede-Fazekas
2 / 16 http://www.iejme.com
why Lockwood (2015) contends, “There is much to learn about students’ combinatorial thinking and activity.”
(p. 340.).
Studies on combinatorics and combinatorial reasoning target different levels of the issue, and theoretical, methodological and empirical papers are also found. These are concerned, among other things, with the importance of teaching combinatorial reasoning at several levels of the education system (e.g. Batanero, Godino & Navarra-Pelayo, 1997; Lockwood, 2013), they provide guidance for teachers (e.g. Abramovich &
Pieper, 1996; Batanero, Godino & Navarra-Pelayo, 1997; DeTemple & Webb, 2014; English, 1991; Kapur, 1970; Lockwood, 2013), discuss difficulties in solving combinatorial problems (e.g. Batanero, Godino &
Navarra-Pelayo, 1997; Harar & Hadass, 1981), evaluate the correctness of the solutions to combinatorial problems (e.g. Csapó, Pásztor & Molnár, 2015; English, 1991, 1993; Fishbein & Grosman, 1997; Mwamwenda, 1999; Poddiakov, 2011), and analyse the strategies used in solving combinatorial problems (e.g. English, 1991, 1993; Halani, 2012; Kosztolányi at al., 2016; Medova & Vidermanova, 2015; Szitányi & Csíkos, 2015). We shall now focus on the last two topics as these are of special relevance to our research.
In evaluating the solutions to combinatorial problems, two main characteristics of the solution can be analysed: whether it is correct or not and the method of arriving at the solution. While the literature usually discusses the first of these, the second characteristic is not always assessed. With respect to the assessment of the method of arriving at the solution, several approaches exist. Students’ verification strategies may be looked at (Mashiach Eizenberg & Zaslavsky, 2004), a given method may be observed while solving a combinatorial problem (Lockwood, 2015), problem-solving strategies may be analysed in problems in which the number of solutions is important (Kosztolányi at al., 2016; Melusova & Vidermanova, 2015; Szitányi &
Csíkos, 2015), and finally strategies may be investigated in solving enumerative combinatorial problems, in which a listing of the solutions is required (English, 1991, 1993; Halani, 2012; Lockwood, 2013). English (1991) uses the term combinatorial strategy for the last one of these, and that is the focus of our research. This is an important area because if we look at the strategies used in solving counting problems, Melusova and Vidermanova’s research (2015) finds that the most common strategy is the listing of elements, and as Kosztolányi at al. (2016) claim: “students need experience and opportunities to list all the events systematically before generalization” (p. 121).
As was explained above, we consider the analysis of combinatorial strategies crucial because learning more about them can help us foster the development of students’ combinatorial reasoning. Therefore, our research looks at enumerative combinatorial problems, specifically students’ methods of enumerating their solutions.
However, we are not aware of any established algorithm-based method suitable for examining combinatorial strategies. The availability of such a method would be especially important for large-scale studies. The aim of this study is therefore to develop a method which is suitable for identifying the strategy used by the problem solver.
Combinatorial Problems, Combinatorial Reasoning
Studies on combinatorial reasoning use a variety of terms, such as combinatorics, combinatorial reasoning, combinatorial thinking, combinatorial problems, combinatorial problem-solving, and so on. Precise definitions are not very common. One reason for this may be the generality of the topic. It probably makes most people think of permutations, k-combinations, k-permutations of n, n-tuples and a mixture of these. However, as Batanero, Godino and Navarra-Pelayo (1997) note, “the scope of combinatorics is much wider than simply solving permutation, arrangement, and combination problems” (p. 239). This view is supported by the papers mentioned in the previous section, which explore the topic from different perspectives.
In fact, a varied picture emerges even if we limit the subject to studies that analyse the solving of different combinatorial problems in various age groups. As there are numerous ways of presenting the results of different problems, we find it necessary to categorise these methods in some way. Our categorization of combinatorial problems follows the method suggested by Batanero, Godino and Navarra-Pelayo (1997). The authors distinguish four categories of combinatorial problems: existence problems (having a solution or not), counting problems (how many solutions there are), optimization problems (finding the best solution) and enumeration problems (listing all the solutions). Our research is directed at the last one of these.
We use the word combinatorial reasoning in our studies as defined by Adey and Csapó (2012), who look at it as a skill needed to analyse the complex relationships between various factors and to arrange a given set of elements into constructs according to given conditions. In Hungary, two models of combinatorial reasoning exist: those of Csapó (1988) and those of Nagy (2004). Measurement instruments were developed based on
INT ELECT J MATH ED
http://www.iejme.com 3 / 16
these models (Csapó, 2001; Hajdúné Holló, 2004; Nagy, 2004), and investigations were carried out using these tests (see e.g. Csapó, 2003; Csapó, Pásztor & Molnár, 2015; Szabó & Korom, 2017). Both of the theories specify different combinatorial operations, and the tests allow us to measure students’ combinatorial reasoning for enumeration problems, which are based on the given operations. In Csapó’s theoretical model (1988) and combinatorial test (2001), combinatorial reasoning is evaluated using the following six operations: Cartesian product of sets, all subsets, permutations, k-combinations, k-permutations of n and n-tuples.
Two directions can be distinguished in the measurement of combinatorial reasoning or of enumerative combinatorial problems (as discussed by Csapó, 2003). The first one, the quantitative dimension, focuses on the accuracy of the solutions, i.e. the proportion of correct and incorrect solutions. This contrasts with the qualitative dimension, which focuses on the method of enumerating the different options, which is an indication of the reasoning strategy used, i.e. a kind of map of the task solver’s way of thinking. The qualitative dimension can be considered to be the same as what English calls combinatorial strategies in her papers (1991, 1993). To summarise, in the case of the quantitative dimension, only the correctness of solutions is evaluated (as in most school tasks), while the qualitative dimension only assesses the method of enumerating the solutions regardless of whether the solutions are correct or not. Finally, after analysing these two dimensions, we may compare the results and reveal any relationships.
Combinatorial Strategies
Combinatorial strategies are defined by English (1991) as the system in the listing of the solutions, in other words, the reasoning strategy used during the enumeration of the solutions.
Piaget was one of the first to draw attention to this topic; according to his theory of cognitive development, the pre-operational stage, the concrete operational stage and the formal operational stage are characterized by different problem-solving strategies (see e.g. Inhelder & Piaget, 1958; Piaget, 2005; Piaget & Inhelder, 2004). At the first stage, random trial and error can be observed during problem solving, then thinking in a system appears (in the concrete operational stage), which develops fully at the third stage. At this formal operational stage, a strategy allowing the subject to find all possible solutions with systematic search emerges.
Based on Piaget’s ideas, English (1991, 1993) examined 4-9 and 7-12 year-old children’s strategies in solving enumerative combinatorial problems (Cartesian product of sets). In accordance with Piaget’s findings, English (1991, 1993) concluded that children could solve these combinatorial problems using different strategies from random item selection to systematic item selection. Six strategies were identified, which are, in order of increasing sophistication: random selection, trial-and-error procedure, emerging pattern, consistent and complete cyclical pattern, emergence of an ‘odometer’ pattern and complete odometer pattern (see English, 1991 for details). English (1991) considered the last three strategies to be algorithmic, as a consistent system appears in the enumeration of the solutions. Since this system becomes more and more complex, the strategy used is increasingly helpful in enumerating all the possible solutions without mistakes or corrections. As was mentioned above, English (1991) used the term ‘odometer’ for the last two strategies, which refers to the behaviour of an odometer, where one of the elements is fixed while the other varies systematically. To summarise, English (1991, 1993) found the ‘odometer’ pattern to be the most effective strategy, which involves a systematic order in the enumeration of the possible solutions, in which one element is always kept fixed, and all possibilities for the remaining elements are searched; another element is kept fixed next, and so on.
Despite the fact that English found the odometer strategies to be the most effective, she noted that the other strategies could also result in a perfect solution.
Other studies (Halani, 2012; Lockwood, 2013) on combinatorial problem solving conclude that there is no single most effective strategy that helps to find all possible solutions without mistakes. However, the effective strategies are always algorithmic, i.e., they are characterized by a systematic enumeration and constancy during the listing of the solutions (odometer pattern). Halani (2012) identified two types of odometer patterns for permutations: the standard and the wacky odometer methods of thinking, while Lockwood (2013) also found two different strategies for arrangements. In both cases one of the strategies is similar to English’s odometer pattern, while the other defines the fixation differently (based on the location of the item or on the type of the solution).
An assessment of combinatorial strategies is usually carried out through the post-evaluation of videos recorded during task solving (English, 1991) and the post-evaluation of task-based interviews (Halani, 2012).
To our knowledge, the type of the strategy used is identified by the persons carrying out the analysis rather than based on algorithms or in some other automated way.
Gál-Szabó & Bede-Fazekas
4 / 16 http://www.iejme.com
THE STUDY Aim of the Study
The broader goal of our research project is to analyse pupils’ combinatorial strategy use while solving enumerative combinatorial problems. As a computer based large-scale survey is planned to be carried out in the future, the development of an algorithm or other deterministic method is required to evaluate the solutions automatically. This would be important for two reasons: first, analysing strategy use in a large-scale sample is nearly impossible without a formula (or a great number of evaluators), and second, subjectivity can only be excluded this way. However, it is a challenge to develop a method which is suitable for classifying different combinatorial operations into the type of combinatorial strategies reported in the literature discussed above.
Hence, as a first step in our research project, the topic was narrowed down and this study looks at just one combinatorial operation (Cartesian product of sets), which was analysed by English (1991, 1993) as well.
Accordingly, the aim of this study is to develop a method which is suitable for classifying the solutions based on the strategy used in tasks involving the Cartesian product of two sets.
As we have to admit that a simple algorithm- or formula-based classification of the strategies has difficulties (e.g., it is difficult to characterise each strategy with a precise formula), we needed to approach the problem from a different direction. Thus, our hypothesis is that odometer thinking can be characterized by two indices: constancy and cyclicity. In order to test our hypothesis, (1) odometer thinking was described using a formula based on its definition, (2) then constancy and cyclicity were characterized using two formulae, which were then used to describe and odometer thinking (3) finally the two methods were compared to each other. Furthermore, using the evaluation indices (odometricality and cyclicality) of the solutions, we offer a method of classifying strategy use.
Methods
To attain the aim of the study, the following process was followed in our research:
1. Two types of odometer thinking – strict odometer strategy (SOS, e.g. A1, A2, A3, B1, B2, B3, C1, C2, C3) and permissive odometer strategy (POS, e.g. B3, B2, B1, C3, C2, C1, A3, A2, A1) – were defined and described using mathematical formulae.
2. Since measuring POS is computationally demanding (computation time is proportional to the product of the factorial of the cardinalities of the sets from which the elements of the solution are composed), a faster algorithm is needed for the evaluation and classification of a large number of solutions. Therefore, four alternative indices were developed that are easier to calculate. Two of these, constancy and cyclicity, characterize the solution independently of any strategy. The two other indices, cyclicality and odometricality, estimate the degree to which combinatorial strategies are followed. The latter is proposed as an easy-to- calculate alternative to measuring POS.
3. In order to test our evaluation method, an initial random sample of solutions (i.e. Cartesian product of two finite sets) from a discrete uniform distribution were generated (n=10,000). The cardinality of the two sets was randomly selected from {2; 3; 4} independently of each other, resulting in more than 1000 solutions for all the 9 cardinality combinations. The initial solutions were complete but not ordered, i.e., they contained all the combinations in random order. Next, the initial samples were artificially biased in three different ways:
(1) some elements of the solution were omitted; (2) some elements were duplicated; and (3) some elements were corrupted, i.e. made inadequate. Biases were randomly generated using 0.1222, 0.1143 and 0.0593 as experimental bias ratios of omission, duplication and corruption, respectively. Experimental bias ratios were calculated from a Hungarian large-scale study (see Gál-Szabó & Korom, 2018), where the data came from 4th and 6th grade pupils (n=1302, mean age=10.35, SD=1.14). The random sample reached the following bias ratios of omission, duplication and corruption, which approximate the experimental ratios to an acceptable degree: 0.1303, 0.0879 and 0.0559, respectively.
4. The degree to which a solution follows odometer strategy was calculated on the biased random sample in two different ways: (1) according to the formalized definition of the permissive odometer strategy and (2) based on two subsequently introduced indices of the solution, i.e., constancy and cyclicity. The two properties were compared using Pearson correlation for the entire sample and its subsamples grouped by the cardinalities of the sets and the degree of perfection of the solution.
INT ELECT J MATH ED
http://www.iejme.com 5 / 16
5. Based on the results of the random sample, a classification method of combinatorial strategies was suggested. The limits of the classes were selected based on an examination of the density plot and the selected (10th, 30th, 50th, 60th, 70th, 80th and 90th) percentiles of the distribution of odometricality and cyclicality values calculated on perfect solutions.
Bearing in mind the main purpose of our research, i.e. the future utilization of our indices in the analysis of real data, every step is formalized, and we give the R script for all calculations. Statistical analyses were carried out in R Statistical Software (R Core Team, 2017); plots were generated using the package ‘ggplot2’
(Wickham, 2009).
RESULTS
Formalization of Odometer Strategy
Strict odometer strategy (SOS) requires that both the elements of the sets and the sets themselves have an order. SOS is defined as the strategy that
1. iterates the elements of the second set while the element of the first set is held constant; and
2. after all the elements of the second set have been selected, iterates the element of the first set and restarts the iteration of the second set.
SOS results in a single perfect solution. It can be formalized in an iterative way. All the elements of the solution can be predicted based on the previous elements. Function fi predicts the ith element (ai and bi from the sets A and B, respectively) by examining whether the previous element is the final one of a subsequence (Eq 1).
𝑓𝑓1= {𝑎𝑎1=𝑚𝑚𝑚𝑚𝑚𝑚(𝐴𝐴) ;𝑏𝑏1=𝑚𝑚𝑚𝑚𝑚𝑚(𝐵𝐵)}
𝑓𝑓𝑖𝑖=�{𝑎𝑎𝑖𝑖=𝑎𝑎𝑖𝑖−1+ 1;𝑏𝑏𝑖𝑖=𝑚𝑚𝑚𝑚𝑚𝑚(𝐵𝐵)};𝑚𝑚𝑓𝑓 𝑏𝑏𝑖𝑖−1=𝑚𝑚𝑎𝑎𝑚𝑚(𝐵𝐵)
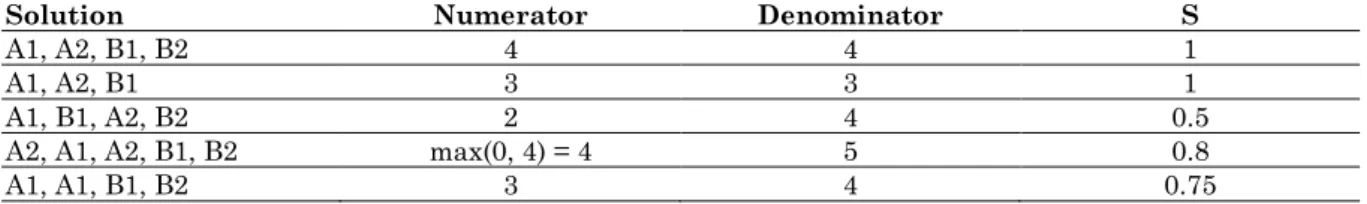
{𝑎𝑎𝑖𝑖=𝑎𝑎𝑖𝑖−1; 𝑏𝑏𝑖𝑖 =𝑏𝑏𝑖𝑖−1+ 1};𝑚𝑚𝑓𝑓 𝑏𝑏𝑖𝑖−1≠ 𝑚𝑚𝑎𝑎𝑚𝑚(𝐵𝐵) (Eq 1) Formal measure (S), which indicates to what extent a solution approximates SOS is defined as the ratio of (a) the quantity of those elements (si) of the n-length solution that corresponds to the formal definition of SOS (fi; Eq 1) and (b) the length of the solution (n). The numerator is calculated in a moving window of size
|A|*|B|, if the solution is longer than needed (Eq 2, Table 1). The moving window allows the odometer strategy to be recognized if it is started after some randomly selected element. The denominator ensures that an unfinished but perfect odometer strategy results in S = 1, while a finished odometer strategy that is preceded or followed by some unneeded elements results in S < 1.
𝑆𝑆=𝑗𝑗∈[0;𝑚𝑚𝑚𝑚𝑚𝑚(0;𝑛𝑛−|𝐴𝐴|∗|𝐵𝐵|)]𝑚𝑚𝑎𝑎𝑚𝑚 �∑𝑚𝑚𝑖𝑖𝑛𝑛(𝑛𝑛;|𝐴𝐴|∗|𝐵𝐵|)𝐼𝐼�𝑠𝑠𝑖𝑖+𝑗𝑗=𝑓𝑓𝑖𝑖�
𝑖𝑖=1 �
𝑚𝑚 ;𝑆𝑆 ∈[0; 1] (Eq 2)
Table 1. Examples for calculation of the formal measure of SOS (S) of solutions from two two-element sets
Solution Numerator Denominator S
A1, A2, B1, B2 4 4 1
A1, A2, B1 3 3 1
A1, B1, A2, B2 2 4 0.5
A2, A1, A2, B1, B2 max(0, 4) = 4 5 0.8
A1, A1, B1, B2 3 4 0.75
Permissive odometer strategy (POS) is defined as the strategy that is equal to the SOS given an appropriately chosen order of the sets and order of the elements of the sets. POS is defined as the strategy that
1. selects the order of the two sets, then chooses a permutation of the elements of the first set and those of the second set;
2. iterates the elements of the second set while the element of the first set is hold constant; and
3. after all the elements of the second set have been selected, iterates the element of the first set and restarts the iteration of the second set.
Gál-Szabó & Bede-Fazekas
6 / 16 http://www.iejme.com
According to the definition, SOS is always POS, and POS is an extension of SOS. In contrast to SOS, POS does not require sets and elements to be previously ordered, therefore several different solutions are accepted as perfect POS solutions. The number of the different perfect solutions (p), in case of two sets, is the product of the permutation of the two sets and the permutations of the elements of the sets (Eq 3).
𝑝𝑝= 2!∗|𝐴𝐴|!∗|𝐵𝐵|! (Eq 3)
Formal measure (P) that indicates to what extent a solution approximates POS (hereinafter ‘formal measure of POS’) is defined as a nested iterative maximum selection of Si,j,k, where Si,j,k is equal to S calculated for the ith permutation of the two sets, jth permutation of set A and kth permutation of set B (Eq 4, Table 2).
P is maximal if any of the set or element permutations results in maximal S.
𝑃𝑃=𝑖𝑖∈{1;2}𝑚𝑚𝑎𝑎𝑚𝑚� 𝑚𝑚𝑎𝑎𝑚𝑚𝑗𝑗∈[1;|𝐴𝐴|!]� 𝑚𝑚𝑎𝑎𝑚𝑚𝑘𝑘∈[1;|𝐵𝐵|!]𝑆𝑆𝑖𝑖,𝑗𝑗,𝑘𝑘��;𝑃𝑃 ∈[0; 1] (Eq 4)
Table 2. Examples for calculation of the formal measure of POS (P) of solutions from two two-element sets.
Intermediate columns contain formal measure of SOS (S) as a function of the expected order of the solution’s elements that is based on the 2×2×2 possible order of the sets and the elements of the sets
Solution S values as a function of the following expected element orders
P A1, A2,
B1, B2 A1, B1,
A2, B2 B1, B2,
A1, A2 B1, A1,
B2, A2 A2, A1,
B2, B1 A2, B2,
A1, B1 B2, B1,
A2, A1 B2, A2, B1, A1
A1, A2, B1, B2 1 0.5 0 0 0 0 0 0.5 1
A1, A2, B1, B1 0.75 0.25 0 0 0.25 0.25 0 0.5 0.75
A1, B1, A2, B2 0.5 1 0 0 0 0 0.5 0 1
B2, A2, B1, A1 0.5 0 0 0 0 0 0.5 1 1
A2, A1, B1 0 0 0 0.333 0.667 0.333 0 0.333 0.667
R script for calculating formal measure of SOS and POS of the solution and formal measures of SOS and POS of the random sample are provided in Github (2019).
Constancy and Cyclicity; Odometricality and Cyclicality
Four indices were developed. Two of them, odometricality and cyclicality, estimate the degree to which odometrical and cyclical strategies are followed. They are based on the two other indices, constancy and cyclicity, that allow the characterization of the solution independently of any supposed strategy. Both constancy and cyclicity describe only the half of the solution that is related to one set of the two initial sets of the Cartesian product, i.e. they characterize a simplified solution by omitting the symbols that belong to the other set.
Constancy (o) is the index of the half solution (i.e. the sequence of the elements sampled (repetitively) from a set A) that expresses unchangingness/fixedness of the symbols. Calculation of constancy is based on the number of symbol changes (k) in the sequence (Eq 5, Table 3), which is then compared to the number of the expected changes (|A|-1), divided by the optimal number of unchanged symbols (n-|A|), and this quotient (index of changingness) is subtracted from 1. Since the index of those sequences that (a) are shorter than the cardinality of the set (n<=|A|); or (b) do not contain all the elements of the set may exceed 1, constancy is limited to 1 (Eq 6, Table 3).
𝑘𝑘=�� 𝐼𝐼(𝑠𝑠𝑖𝑖≠ 𝑠𝑠𝑖𝑖+1)
𝑛𝑛−1 𝑖𝑖=1
;𝑚𝑚𝑓𝑓 𝑚𝑚> 1 0;𝑚𝑚𝑓𝑓 𝑚𝑚= 1
; 𝑘𝑘 ∈[0;𝑚𝑚 −1] (Eq 5)
𝑜𝑜=�𝑚𝑚𝑚𝑚𝑚𝑚 �1; 1−𝑘𝑘 −(|𝐴𝐴|−1)
𝑚𝑚 −|𝐴𝐴| �=𝑚𝑚𝑚𝑚𝑚𝑚 �1;𝑚𝑚 − 𝑘𝑘 −1
𝑚𝑚 −|𝐴𝐴| �;𝑚𝑚𝑓𝑓 𝑚𝑚> |𝐴𝐴|
1;𝑚𝑚𝑓𝑓 𝑚𝑚 ≤|𝐴𝐴| ;𝑜𝑜 ∈[0; 1] (Eq 6)
INT ELECT J MATH ED
http://www.iejme.com 7 / 16
Table 3. Examples for calculation of the symbol changes (k) and constancy (o) of solutions from two two- element sets. Indices related to set A (letters) are indicated by subscript a, indices related to set B (numbers) are indicated by subscript b. An incorrect element is indicated by ‘?’
Solution ka oa kb ob
A1, A2, B1, B2 1 1 3 0
A1, B1, A2, B2 3 0 1 1
A1, A1, A1, A1 0 1 0 1
A1, A2, B1, B2, A1 2 0.667 4 0
A1, ?2, B1, B2 2 0.5 3 0
Cyclicity (y) is the index of the half solution (i.e. the sequence of the elements sampled (repetitively) from a set A) that expresses the relative frequency of those symbols that are followed by |A|-1 different symbols.
Calculation of cyclicity is based on the number of unreasonable repetitions (cyclicity violation; h) computed within a moving window (iteratively moved short parts of the sequence whose lengths are equal to the cardinality of the set) (Eq 7, Table 4). Then h is divided by the number of the windows (n-|A|+1) and subtracted from 1. Cyclicity is defined to be 1 for those solutions that are shorter than the cardinality of the set and from which, therefore, window cannot be selected (Eq 8, Table 4).
ℎ=
⎩⎪
⎨
⎪⎧
� 𝐼𝐼 �𝑠𝑠𝑖𝑖 ∈ � 𝑠𝑠𝑖𝑖+𝑗𝑗
|𝐴𝐴|−1 𝑗𝑗=1
�
𝑛𝑛−|𝐴𝐴|+1 𝑖𝑖=1
;𝑚𝑚𝑓𝑓 𝑚𝑚 ≥|𝐴𝐴|
0;𝑚𝑚𝑓𝑓 𝑚𝑚< |𝐴𝐴|
; ℎ ∈[0;𝑚𝑚 −|𝐴𝐴| + 1] (Eq 7)
𝑦𝑦=�1− ℎ
𝑚𝑚 −|𝐴𝐴| + 1 ;𝑚𝑚𝑓𝑓 𝑚𝑚 ≥|𝐴𝐴|
1;𝑚𝑚𝑓𝑓 𝑚𝑚< |𝐴𝐴| ; 𝑦𝑦 ∈[0; 1] (Eq 8)
Table 4. Examples for calculation of the cyclicity violation (h) and cyclicity (y) of solutions from two two- element sets. Indices related to set A (letters) are indicated by subscript a, indices related to set B (numbers) are indicated by subscript b. An incorrect element is indicated by ‘?’
Solution ha ya hb yb
A1, A2, B1, B2 2 0.333 0 1
A1, B1, A2, B2 0 1 2 0.333
A1, B2, A1, B2 0 1 0 1
A1, A2, B1, B2, A1 2 0.5 0 1
A1, A?, B1, B2 2 0.333 1 0.667
For calculating constancy and cyclicity, missing elements are disregarded. However, incorrect elements, i.e. those that have a symbol selected from one of the sets but the other symbol from the other set is missing, are used for the calculation in a conservative way. One can omit a symbol intentionally or by mistake. The former means symbol changes and violation of cyclicity by definition. In the latter case, we cannot assume that the missing symbol could be the best choice from the set, and, therefore, we assume, again, symbol changes and violation of cyclicity.
Although o and y are not the reciprocal of each other in mathematical terms, they are inversely proportional in logical terms: if one of them is high, then the other one is necessarily low. E.g., ‘AAAA’ results in high constancy and low cyclicity, while ‘ABAB’ results in low constancy and high cyclicity.
If a solution is the Cartesian product of two sets (A and B), then it has four features: namely constancy and cyclicity of A (oa, ya) and B (ob, yb). Based on these four features, one can characterize the solution and estimate the strategy that resulted in the solution.
We define odometricality (Θ) as the maximum of the products of the constancy according to one of the sets and cyclicity according to the other set, calculated for both of the permutations of the sets (Eq 9). We assume that odometricality is an easily computable index of how a solution follows POS.
𝜃𝜃=𝑚𝑚𝑎𝑎𝑚𝑚(𝑜𝑜𝑚𝑚∗ 𝑦𝑦𝑏𝑏; 𝑜𝑜𝑏𝑏∗ 𝑦𝑦𝑚𝑚); 𝜃𝜃 ∈[0; 1] (Eq 9)
Gál-Szabó & Bede-Fazekas
8 / 16 http://www.iejme.com
Cyclical strategy, as defined by English (1991), can be measured by cyclicality (Φ), which is the product of the cyclicities calculated according to the two sets (Eq 10).
𝜙𝜙=𝑦𝑦𝑚𝑚∗ 𝑦𝑦𝑏𝑏; 𝜙𝜙 ∈[0; 1] (Eq 10)
R script for calculating constancies, cyclicities, odometricality and cyclicality of the solution, and also constancy, cyclicity, odometricality and cyclicality of the random sample are provided in Github (2019).
Odometricality as the Index of Permissive Odometer Strategy
Mean odometricality of the random sample was found to be 0.337, while the mean of the formal measure of POS was 0.468. Pearson correlation of the two properties (Table 5) was found to be higher for perfect solutions than for imperfect ones. Perfect solutions composed from sets of two elements resulted in an outstanding correlation (0.948). Similarly, studying both perfect and imperfect solutions, the highest correlation (0.675) is found in the 2×2 case. If the sample is not divided by cardinality, generally higher correlations (0.665 for imperfect, 0.769 for perfect, and 0.693 for both perfect and imperfect solutions) are measured.
Table 5. Pearson correlation (r) of odometricality and the formal measure of POS, calculated on a random sample of solutions (n=10,000), grouped by the cardinalities of the sets from which the solutions were composed (rows) and the perfection of the solution (columns). Sample size (n) and significance of correlations (p;
***<0.001<**<0.01<*<0.05) are also provided. Correlations for small subsamples (n < 30) were not calculated Cardinalities Imperfect solutions Perfect solutions All solutions
n r p n r p n r p
2 × 2 828 0.593 *** 319 0.948 *** 1147 0.675 ***
2 × 3 983 0.445 *** 141 0.54 *** 1124 0.451 ***
2 × 4 1021 0.372 *** 96 0.164 0.109 1117 0.358 ***
3 × 2 967 0.501 *** 159 0.518 *** 1126 0.502 ***
3 × 3 1048 0.329 *** 62 0.308 * 1110 0.328 ***
3 × 4 1048 0.308 *** < 30 n/a n/a 1071 0.303 ***
4 × 2 999 0.403 *** 83 0.268 * 1082 0.393 ***
4 × 3 1090 0.242 *** < 30 n/a n/a 1113 0.246 ***
4 × 4 1107 0.228 *** < 30 n/a n/a 1110 0.226 ***
all 9091 0.665 *** 909 0.769 *** 10000 0.693 ***
According to the density plots of cyclicity, odometricality and formal measure of POS (Figure 1), the distribution of odometricality is more similar to that of cyclicality in almost all cases than to that of the formal measure of POS. In the 2×2 case, odometricality and the formal measure of POS show similar distributions.
For other cardinalities, odometricality seems to systematically underestimate the measure of POS.
INT ELECT J MATH ED
http://www.iejme.com 9 / 16
Classification of Combinatorial Strategies
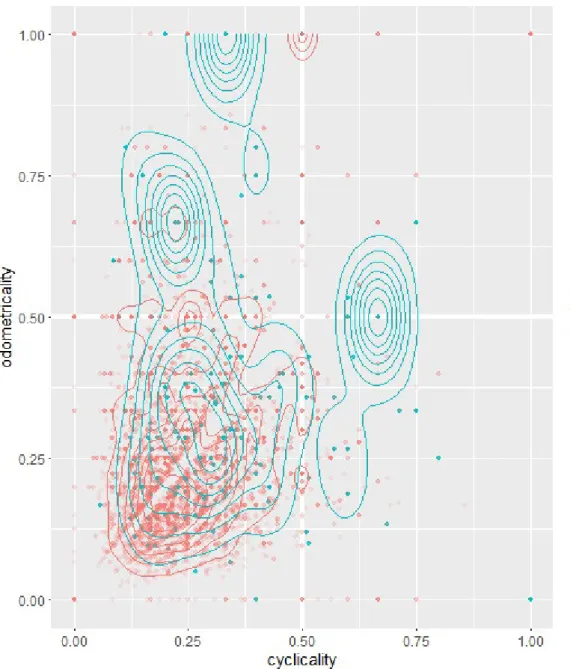
Since o and y are inversely proportional to each other in logical terms, normally, Θ and Φ cannot be high at the same time. This is confirmed by the random sample (Figure 2). Hence, they can assist the classification of a solution into strategy classes.
Figure 1. Density plots of odometricality (red) and formal measure of POS (green) calculated on the random sample of solution (n=10,000, bottom row), and on its subsamples (1st to 3rd rows) grouped by the cardinalities of the sets from which the solutions were composed
Gál-Szabó & Bede-Fazekas
10 / 16 http://www.iejme.com
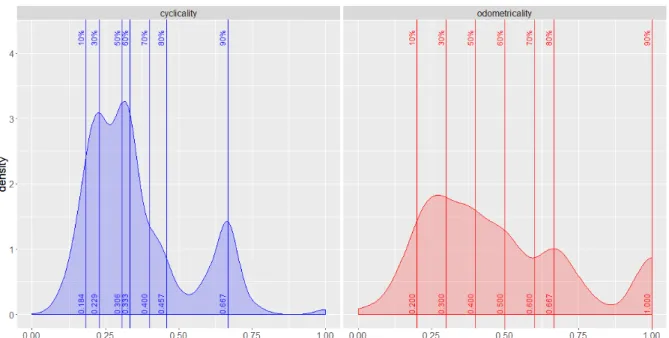
Density plots and selected percentiles of the observed distribution of odometricality and cyclicality (Figure 3) were studied, and two thresholds (0.5 and 0.666) were selected to serve as limits of the classes.
Threshold 0.5 is the 60th percentile of odometricality, while 0.666 is the truncated value of 0.6667 (90th percentile of cyclicality and 80th percentile of odometricality). Given the two thresholds selected, we propose a classification of the strategies into seven discrete classes based on the two indices of the solution, i.e.
odometricality and cyclicality (Table 6).
Figure 2. Cyclicality and odometricality of 9091 imperfect (red, highly transparent), and 909 perfect (blue, slightly transparent), randomly generated solutions, and their kernel density estimation
INT ELECT J MATH ED
http://www.iejme.com 11 / 16
R script for classifying the strategy, and the strategy classification of the random sample are provided in Github (2019).
DISCUSSION
Findings on the Random Sample
Bias ratios are not exactly the same in the generated random sample as in the experimental sample (see Item 3 in Methods section). The differences are the consequence of the two following properties. Because of the stochastic generation of biases, the ratios cannot be exactly the same. Furthermore, biases were created in a linear, element-wise way, creating the possibility of changing the pair of a previously generated repetition at a later step in the bias generating process, thus reducing the repetition ratio. However, the differences are small and irrelevant. The generation of a random sample using experimental bias ratios derived from a real sample in place of using random bias ratios will result in a more realistic sample and increase the soundness of our findings on the random sample.
Looking at the correlation between the odometricality and the formal measure of POS, there are different correlation coefficients for the cardinalities of the sets and for the degrees of perfection of the solutions (Table 5). In the case of perfect solutions of 2×2 problems, the two variables show an almost perfect match (r=0.948), while in other cases the correlation coefficients are considerably weaker. Regarding the correlation coefficient of all perfect solutions (0.769), since the rate of the 2x2 case is the largest (one third), the effect of this on the Figure 3. Density plot and selected (10th, 30th, 50th, 60th, 70th, 80th and 90th) percentiles of the distribution of odometricality and cyclicality values calculated on the perfect (n=909) subsample of the random sample of solutions
Table 6. Classification of combinatorial strategies based on odometricality and cyclicality of the solution.
Conditions related to odometricality (Column 2) and cyclicality (Column 3) must be fulfilled simultaneously (i.e. logical AND operator) for a solution being classified in a certain class (row). Size of the classified subsamples of the random sample is provided in Column 4
Strategy Θ (odometricality) Φ (cyclicality) size of subsample
completely odometrical 1 Φ ≤ Θ 495
completely cyclical Θ < Φ 1 14
nearly odometrical 0.666 ≤ Θ < 1 Φ ≤ Θ 632
nearly cyclical Θ < Φ 0.666 ≤ Φ < 1 219
slightly odometrical 0.5 ≤ Θ < 0.666 Φ ≤ Θ 817
slightly cyclical Θ < Φ 0.5 ≤ Φ < 0.666 478
random Θ < 0.5 Φ < 0.5 7345
Gál-Szabó & Bede-Fazekas
12 / 16 http://www.iejme.com
value is greater, and it improves the final value. However, for imperfect solutions, there are no such large differences between the values based on the cardinality of the sets. The trend, however, is the same: with an increase in the cardinality of the sets, the correlation becomes weaker. Further refinement of the odometricality index might result in a stronger correlation with the formal measure of POS, and, hence, could contribute to better classification. Furthermore, it would be interesting to examine the correlation coefficients calculated in a smaller real sample and compare them to our results.
Comparing the values of odometricality and measure of POS at different cardinalities of the sets (Figure 1), we can see that in most cases (except for 2x2), the measure of POS underestimates odometricality. The two values are very close in the 2x2 case, which means that the scale and distribution of odometricality and measure of POS are highly similar. In the 2×2 case, the findings on correlation and distribution reinforce each other. In the other cases (except for ‘all’), the distributions of odometricality and measure of POS differ consistently: the shapes of the curves resemble each other but the distribution of the measure of POS is systematically narrower and shifted towards higher values than that of odometricality. These findings confirm the usability of the proposed method of quantifying odometricality.
For the classification of combinatorial strategies, we offered a system based on the values of odometricality and cyclicality. Figure 2 shows the odometricality and cyclicality values of the random solutions. Given the randomness of the sample, the high proportion of low values is not surprising. We may assume that in real data, considerably more solutions show a strategy that results in higher values of odometricality and cyclicality. We found evidence for our hypothesis that the values of the two indices are unlikely to be high at the same time (i.e. odometricality and cyclicality are mostly inversely proportional if one of them is high), furthermore parallel high values do not occur for perfect solutions. Hence, we may contend that the two indices are suitable for separating the two thinking strategies. The reasons for density spots around (0.22; 0.67), (0.31;
1) and (0.67, 0.5) and for empty places around y=x, y=2x and y=x/2 lines require further investigation and might be an artefact of the sample generation process.
Regarding the distribution of odometricality and cyclicality values of the perfect subsample, different curves can be seen (Figure 3). Most of the cyclicality values scatter in the smaller range, from about 0.1 to 0.5, while in the case of odometricality, most of the values are between 0.1 and 0.75. Both curves have a local maximum in the 90th percentile, it is around 0.667 for cyclicality and exactly 1 for odometricality. The higher number of completely (=1) odometrical solutions is not surprising if we recall English’s (1991) argument:
complete odometer strategy can result in perfect solutions regardless of the cardinality of the sets, while a completely cyclical strategy is not always the best choice. It can result in perfect solutions only if the parity of the two cardinalities differ from each other (one of them is even and the other is odd).
For the classification, the same two thresholds were selected for odometricality and cyclicality to serve as limits of the classes (please see the last subsection for the reason for this decision). Both for odometrical and cyclical strategies, the size of the classified subsets of the random sample increases from complete to uncertain (‘slightly odometrical’, ‘slightly cyclical’) strategies (Table 6). Furthermore, the size of the subsamples classified as cyclical are consistently smaller than those classified as odometrical, which is the consequence of the different distributions of the two indices and the same thresholds. Finally, because of the randomness of the generated sample, unsurprisingly, most of the cases (almost three quarters) are assigned to the class of random strategy. We assume that the classification of real data would result in a lower frequency of this class.
Relevance and Suggested Application of the Research
Based on our results, the evaluation of combinatorial strategies using constancy and cyclicity seems to be a suitable method for computer-based large-scale investigations. Using these two indices, odometricality and cyclicality can be calculated, which are suitable for characterizing the task-solvers’ solutions in terms of the strategy applied. Although the correlation coefficients between odometricality and the formal measure of POS are not as high as expected, we recommend applying the method to real data. Since errors are accumulated and arranged into arrays in the case of real solutions rather than forming a random uniform distribution, the stronger correlations calculated for perfect solutions are certainly closer to reality.
In order to characterize strategy use, a classification method is required. Classification based on the values of odometricality and cyclicality has proved to be an appropriate method. In this study two thresholds for classification were recommended but we suggest reviewing and refining these thresholds based on experimental data. When presenting the data of classification, we suggest sharing the values of odometricality and cyclicality in addition to publishing the classification results. Furthermore, before carrying out the
INT ELECT J MATH ED
http://www.iejme.com 13 / 16
classification, it is worth filtering out solutions which are so inadequate that the identification of strategy is irrelevant. Based on our previous research, the following two cases often produce inappropriate solutions: (1) the solution contains only one or just a few elements (far fewer than expected); (2) the solution contains the expected number or more elements with many repetitions (mostly the result of a consistently applied repeating pattern). The exact rates for filtering need to be set based on the details of the task. We can safely assume that task-solvers producing the above mentioned solutions did not understand the problem or did not want to solve it in the way it was requested by the task. Therefore, we recommend classifying these solutions into a class separate from the proposed seven.
In summary, odometricality has been shown to be a computationally effective proxy measure for POS. Our results suggest that the calculation of odometricality and classification based on odometricality and cyclicality can be quickly and easily carried out on a large number of solutions. In Github (2019) we provide (1) independent functions for sample generation and characteristics calculation, and (2) a wrapper function (called combinatorial_wrapper) using a hybrid (command line and graphical) user interface for
1. opening previously saved solutions (in csv or RData files);
2. generating a random sample of solutions for which the following parameters can be set (other than the defaults): number of solutions to be generated, minimum and maximum cardinality of the sets, and probability of repeated, incorrect and missing elements;
3. the calculation of characteristics (i.e. error ratios, measure of SOS and POS, constancy, cyclicity, odometricality and cyclicality) of the solutions; and
4. saving the sample of solutions and the characteristics in csv and RData files.
Decisions Made and Suggested Future Research
We cannot ignore the fact that during the research process, decisions had to be made which could influence subsequent steps and the results.
− It is not certain that ‘odometer thinking’ was meant by English (1991) in exactly the same way as we defined POS. However, we are confident that SOS alone is certainly not suitable, as there are situations in which there is no order of the sets and of the elements within the set, hence POS is required.
− It was crucial for the measures of SOS and POS) and our new indices (constancy and cyclicity, odometricality and cyclicality) to be able to evaluate strategy use regardless of the correctness of the solution.
Therefore, the strategy and the correctness of the solution were separated for theoretical reasons and in order to allow the evaluation of their relationship.
− Since odometer strategy can be defined as a systematic listing of the solutions whereby an element is held constant and others are listed in a specific order (as argued by English, 1991), the odometricality of the solutions is calculated based on the constancy and cyclicity values of both of the sets. However, in the case of a cyclical pattern, both elements are listed in a specific cyclic order (as defined by English, 1991), and thus the cyclicality of the solutions is calculated based on only the cyclicity values.
− Whether incomplete, recurrent or incorrect solutions exceeding a predetermined ratio of biases should be excluded from the correlation analysis was also a dilemma. These solutions are likely to make the correlation values weaker. However, in the random sample, only a few solutions could be treated as incorrect without any doubt, as the distribution of the errors is uniform. For this reason, these were finally included in the analysis.
− The cases mentioned above are most common in real data because of the error accumulation discussed before. Creating a new strategy class for these solutions could be a solution but these are not exact strategies but simply cumulatively incorrect solutions. Hence filtering these cases can be a good approach.
− The thresholds of the strategy classes are the researcher’s decision. To choose these thresholds, values belonging to certain percentiles of the perfect solutions were used instead of the percentiles of all solutions.
This decision was made based on our previous findings on error accumulation and the fact that the perfect solutions are more similar to real data (please see the previous subsection).
− In this study, we used given thresholds (0.5 and 0.666) for the classification but others would be justifiable as well. As was discussed in the subsection ‘Findings on the random sample’, the same thresholds were used for both indices (odometricality and cyclicality) but not the same percentile values because of the
Gál-Szabó & Bede-Fazekas
14 / 16 http://www.iejme.com
differences between the two indices. However, using the same percentile values could have been an alternative option that may result in more balanced classes in terms of the number of solutions included.
In a survey of combinatorial strategy, it is virtually impossible to create test situations in which all irrelevant factors are held constant, and therefore compromises and difficult decisions are required in the evaluation of strategy use. Moreover, students’ thinking cannot be directly measured; it can only be inferred based on their task solving behaviour. However, with computer-based data collections, an analysis of the task solving behaviour (e.g. based on log files) also requires decisions. The order of elements can be interpreted in two - possibly different - ways: in terms of their position within the solution (spatial method) and in terms of the time when the element was selected (temporal method). For instance, in a survey that allows the modification of the solutions, either the first or the last drag and drop activity (or any other method of element placement) can be taken into consideration when analysing the order of the elements in the solution. Finally, thinking is a very complex phenomenon, and it is impossible to measure every factor.
Our results may give rise to further studies. The method needs to be tested on experimental data to corroborate our findings. This process must involve the following: (1) analysing the correlation between odometricality and POS; (2) reviewing the thresholds of strategy categories; and (3) using the method for classifying strategy use. At the next stage, strategy use could be compared with task performance and other variables. Extending the method to other combinatorial operations is also among tasks for the future. Our experiences suggest that it will be easier for operations that are closer to the Cartesian product of two sets (e.g.n-tuples), while it will be more complicated for other operations (e.g. all subsets).
Last but not least, our study raises other research questions as well. Cyclicality was defined in this paper but further analysis is required to study the correlation between cyclicality and English’s (1991) cyclical pattern. Another optional direction is analysing the density spots of cyclicality and odometricality values (Figure 2) or plotting the two constancy values and the two cyclicity values of the solutions in a four- dimensional figure in order to search for density spots and suggest alternative classification methods based on these findings.
CONCLUSION
This study discussed the development of a method for classifying combinatorial strategies for problems of the Cartesian product of two sets which is suitable for evaluating the solutions automatically.
In order to formalize the odometer strategy, a strict odometer strategy (SOS) and a permissive odometer strategy (POS) were defined and described by a formula. Since the calculation of POS values requires large computing capacity, four indices (constancy and cyclicity, and also odometricality and cyclicality) were developed, as these require less computing power. To find evidence for our hypothesis (that odometer thinking can be characterized by the constancy- and cyclicity-based odometricality indices), we compared POS values with odometricality values in a random sample. As we expected, there is a significant correlation between the two variables, and odometricality may serve as a computationally efficient proxy measure for POS. Based on the odometricality and cyclicality values, we offered a method for classifying strategy use.
Our present and future results contribute to our body of knowledge about combinatorial strategies, and to designing programs for the fostering of students’ thinking.
ACKNOWLEDGEMENT
This study was funded by the Content Pedagogy Research Program of the Hungarian Academy of Sciences and by the GINOP-2.3.2-15-2016-00019 grant, and supported by the UNKP-18-3 New National Excellence Program of the Ministry of Human Capacities.
The authors would like express their gratitude to Anna Babarczy for corrections regarding grammar and language correctness.
Disclosure statement
No potential conflict of interest was reported by the authors.
INT ELECT J MATH ED
http://www.iejme.com 15 / 16
Notes on contributors
Zsófia Gál-Szabó – Doctoral School of Education, University of Szeged, Szeged and MTA-SZTE Science Education Research Group, Szeged, Hungary.
Ákos Bede-Fazekas – MTA Centre for Ecological Research, Institute of Ecology and Botany, Vácrátót and MTA Centre for Ecological Research, GINOP Sustainable Ecosystems Group, Tihany, Hungary.
REFERENCES
Abramovich, S., & Pieper, A. (1996). Fostering recursive thinking in combinatorics through the use of manipulatives and computing technology. Mathematics Educator, 7(1), 4-12.
Adey, P., & Csapó, B. (2012). Developing and assessing scientific reasoning. In Csapó, B., & Szabó, G. (Eds.), Framework for diagnostic assessment of science (pp.17-53). Budapest, Hungary: Nemzeti Tankönyvkiadó.
Batanero, C., Godino J. D., & Navarro-Pelayo, V. (1997). Combinatorial reasoning and its assessment. In Gal, I., & Garfield, J. B. (Eds.), The Assessment Challenge in Statistics Education (pp. 239-252). Amsterdam, Netherlands: IOS Press.
Bitner, B. L. (1991). Formal operational reasoning modes: Predictors of critical thinking abilities and grades assigned by teachers in science and mathematics for students in grades nine through twelve. Journal of Research in Science Teaching, 28(3), 265-274. https://doi.org/10.1002/tea.3660280307
Cavallo, A. M. L. (1996). Meaningful learning, reasoning ability and students’ understanding and problem solving of genetics topics. Journal of Research in Science Teaching, 33(6), 625-656.
Csapó, B. (1988). A kombinatív képesség struktúrája és fejlődése [Structure and development of combinatorial ability]. Budapest, Hungary: Akadémiai Kiadó.
Csapó, B. (2001). A kombinativ képesség fejlődésének elemzése országos reprezentativ felmérés alapján [An analysis of the development of combinative ability: a large-scale survey]. Magyar Pedagógia, 101(4), 511-530.
Csapó, B. (2003). A képességek fejlődése és iskolai fejlesztése [The development and classroom fostering of skills].
Budapest, Hungary: Akadémiai Kiadó.
Csapó, B., Pásztor, A., & Molnár, Gy. (2015). Online assessment of combinatorial reasoning: Perspectives of measuring a challenging construct. 16th European Conference for Research on Learning and Instruction, Limassol, Cyprus, August 25-29, 2015. 1209.
DeTemple, D., & Webb, W. (2014). Combinatorial reasoning. An introduction to the art of counting. Hoboken, NJ, USA: John Wiley & Sons, Inc.
English, L. D. (1991). Young children’s combinatoric strategies. Educational Studies in Mathematics, 22(5), 451-474. https://doi.org/10.1007/BF00367908
English, L. D. (1993). Children’s strategies for solving two- and three-dimensional combinatorial problems.
Journal for Research in Mathematics Education, 24(3), 255-273. https://doi.org/10.2307/749347 English, L. D. (2016). Revealing and capitalising on young children’s mathematical potential. ZDM
Mathematics Education, 48(7), 1079-1087. https://doi.org/10.1007/s11858-016-0809-5
Fishbein, E., & Grosman, A. (1997). Schemata and intuitions in combinatorial reasoning. Educational Studies in Mathematics, 34(1), 27-47. https://doi.org/10.1023/A:1002914202652
Gál-Szabó, Zs. & Korom, E. (2018): Combinatorial reasoning among 4th and 6th grade pupils: preliminary results of a large-scale study. In Vidákovich T., & Fűz, N. (Eds.), 16th Conference on Educational Assessment - Programme and abstracts, Szeged, Hungary: Szegedi Tudományegyetem.
Github (2019). R script and random sample. https://github.com/bfakos/combinatiorial_reasoning
Hadar, N., & Hadass, R. (1981). The road to solving a combinatorial problem is strewn with pitfalls.
Educational Studies in Mathematics, 12(4), 435-443. https://doi.org/10.1007/BF00308141
Hajdúné Holló, K. (2004). Az elemi kombinatív képesség fejlődésének kritériumorientált diagnosztikus feltárása 4–8 évesek körében [Criterion-referenced diagnostic assessment of the development of the combinative ability of 4-8-year-olds]. Magyar Pedagógiai, 104(3), 263-292.
Gál-Szabó & Bede-Fazekas
16 / 16 http://www.iejme.com
Halani, A. (2012). Students’ ways of thinking about enumerative combinatorics solution sets: the odometer category. In Brown, S., Larsen, S., Marrongelle, K. & Oehrtman M. (Eds.), Proceedings of the 15th Annual Conference on Research in Undergraduate Mathematics Education, Portland, OR, USA: The Special Interest Group of the Mathematics Association of America (SIGMAA) for Research in Undergraduate Mathematics Education. 59-68.
Inhelder, B., & Piaget, J. (1958). The growth of logical thinking from childhood to adolescence. NY, USA: Basic Books. https://www.taylorfrancis.com/books/9781315009674 https://doi.org/10.4324/9781315009674 Kapur, J. N. (1970). Combinatorial analysis and school mathematics. Educational Studies in Mathematics,
3(1), 111-127. https://doi.org/10.1007/BF00381598
Kosztolányi, J., Pintér, K. Bagota, M., & Gábor Dancs, G. (2016). How do students solve combinatorial problems? – Some results of a research about difficulties and strategies of Hungarian students. In Csíkos, Cs., Rausch, A. & Szitányi, J. (Eds.), Proceedings of the 40th conference of the International Group for the Psychology of Mathematics Education: PME40. Szeged, Hungary: International Group for the Psychology of Mathematics Education. 115-122.
Lockwood, E. (2013). A model of students’ combinatorial thinking. The Journal of Mathematical Behavior, 32(2), 251-265. http://doi.org/10.1016/j.jmathb.2013.02.008
Lockwood, E. (2015). The Strategy of Solving Smaller, Similar Problems in the Context of Combinatorial Enumeration. International Journal of Research in Undergraduate Mathematics Education, 1(1), 339- 362. http://doi.org/10.1007/s40753-015-0016-8
Mashiach-Eizenberg M., & Zaslavsky, O. (2004). Students’ verification strategies for combinatorial problems.
Mathematical Thinking and Learning, 6(1), 15-36. https://doi.org/10.1207/s15327833mtl0601_2 Melusova, J., & Vidermanova, K. (2015). Upper-secondary Students’ Strategies for Solving Combinatorial
Problems. Procedia – Social and Behavioral Sciences, 197, 1703-1709.
https://doi.org/10.1016/j.sbspro.2015.07.223
Mwamwenda, T. S. (1999). Undergraduate and graduate students’ combinatorial reasoning and formal operations. Journal of Genetic Psychology, 160(4), 503-505. https://doi.org/10.1080/00221329909595563 Nagy József (2004). Az elemi kombinatív képesség kialakulásának kritériumorientált diagnosztikus feltárása
[Criterion referenced diagnostic assessment of basic combinatorial skills]. Iskolakultúra, 14(8), 3-20.
Piaget, J. (2005). The psychology of intelligence. NY, USA: Routlege Classics.
https://doi.org/10.4324/9780203981528
Piaget, J., & Inhelder, B. (2004). Gyermeklélektan [Child psychology]. Budapest, Hungary: Osiris Kiadó.
Poddiakov, A. (2011). Didactic objects for development of young children’s combinatorial experimentation and causal-experimental thought. International Journal of Early Years Education, 19(1), 65-78.
https://doi.org/10.1080/09669760.2011.571001
R Core Team (2017). R: A language and environment for statistical computing. Vienna, Austria: R Foundation for Statistical Computing. www.R-project.org
Simonton, D. K. (2010). Creative thought as blind-variation and selective-retention: Combinatorial models of exceptional creativity. Physics of life reviews, 7(2), 156-179. http://doi.org/10.1016/j.plrev.2010.02.002 Szabó, Zs. G., & Korom, E. (2017). Developing combinatorial reasoning among third grade pupils. 17th
Biennial conference of the European Association for Research on Learning and Instruction, Tampere, Finland, August 28-September 2, 2017. 448-449.
Szitányi, J., & Csíkos, Cs. (2015). Performance and strategy use in combinatorial reasoning among pre-service elementary teachers. In Beswick, K., Muir, T. és Wells, J. (Eds.), Proceedings of the 39th Conference of the International Group for the Psychology of Mathematics Education. Hobart, Australia: International Group for the Psychology of Mathematics Education. 4225-4232.
Wickham, H. (2009). ggplot2: Elegant Graphics for Data Analysis. New York, NY, USA: Springer-Verlag.
http://doi.org/10.1007/978-0-387-98141-3
Yilmaz, A., & Alp, E. (2006). Students’ understanding of matter: the effect of reasoning ability and grade level.
Chemistry Education Research and Practice, 7(1), 22-31. http://doi.org/10.1039/B5RP90013A
http://www.iejme.com