Consumption of penicillins in the community, European Union/European Economic Area, 1997–2017
Robin Bruyndonckx 1,2*, Niels Adriaenssens1,3, Niel Hens2,4, Ann Versporten1, Dominique L. Monnet5, Geert Molenberghs2,6, Herman Goossens1, Klaus Weist5and Samuel Coenen 1,3on behalf of the ESAC-Net
study group†
1Laboratory of Medical Microbiology, Vaccine & Infectious Disease Institute (VAXINFECTIO), University of Antwerp, Antwerp, Belgium;
2Interuniversity Institute for Biostatistics and statistical Bioinformatics (I-BIOSTAT), Data Science Institute, Hasselt University, Hasselt, Belgium;3Centre for General Practice, Department of Family Medicine & Population Health (FAMPOP), University of Antwerp, Antwerp,
Belgium;4Centre for Health Economic Research and Modelling Infectious Diseases, Vaccine & Infectious Disease Institute (VAXINFECTIO), University of Antwerp, Belgium;5Disease Programmes Unit, European Centre for Disease Prevention and Control, Stockholm, Sweden;6Interuniversity Institute for Biostatistics and statistical Bioinformatics (I-BIOSTAT), Catholic University of Leuven,
Leuven, Belgium
*Corresponding author. E-mail: robin.bruyndonckx@uhasselt.be
†Members are listed in the Acknowledgements section.
Objectives: Data on consumption of penicillins in the community were collected from 30 EU/European Economic Area (EEA) countries over two decades. This article reviews temporal trends, seasonal variation, presence of change-points and changes in the composition of the main subgroups of penicillins.
Methods: For the period 1997–2017, data on consumption of penicillins, i.e.b-lactam antibacterials, penicil- lins (ATC group J01C), in the community aggregated at the level of the active substance, were collected using the WHO ATC/DDD methodology (ATC/DDD index 2019). Consumption was expressed in DDD per 1000 inhabi- tants per day and in packages per 1000 inhabitants per day. Consumption of penicillins was analysed based on ATC-4 subgroups, and presented as trends, seasonal variation, presence of change-points and compositional changes.
Results: In 2017, consumption of penicillins in the community expressed in DDD per 1000 inhabitants per day varied by a factor of 4.9 between countries with the highest (Spain) and the lowest (the Netherlands) consumption. An increase in consumption of penicillins, which was not statistically significant, was observed between 1997 and 2003 and up to 2010. A decrease, which was not statistically significant, was observed from 2010 onwards. Proportional consumption of combinations of penicillins, includingb-lactamase inhibitors (J01CR) increased during 1997–2017, which coincided with a decrease in the proportional consumption of extended-spectrum penicillins (J01CA) and narrow-spectrum penicillins (J01CE).
Conclusions:Considerable variation in the patterns of consumption of penicillins was observed between EU/EEA countries. The consumption of penicillins in the EU/EEA community did not change significantly over time, while the proportional consumption of combinations of penicillins increased.
Introduction
This article presents data from the European Surveillance of Antimicrobial Consumption Network (ESAC-Net,1formerly ESAC) on consumption of penicillins for 30 EU/European Economic Area (EEA) countries in 2017 (Table1). It updates previous ESAC studies published in 2006 and 2011, and in doing so it provides updated comparable and reliable information on antibiotic consumption
that can aid in fighting the global problem of antimicrobial resist- ance.2,3In 2017, penicillins represented 42.3% of antibiotic con- sumption in the community.4The objective of this study was to analyse temporal trends, seasonal variation and the presence of change-points in consumption of penicillins in the community (i.e. primary care sector) for the period 1997–2017, as well as to analyse the composition of consumption of penicillins over time.
VC The Author(s) 2021. Published by Oxford University Press on behalf of the British Society for Antimicrobial Chemotherapy.
This is an Open Access article distributed under the terms of the Creative Commons Attribution License (http://creativecommons.org/licenses/
J Antimicrob Chemother2021;76Suppl 2: ii14–ii21 doi:10.1093/jac/dkab173
Downloaded from https://academic.oup.com/jac/article/76/Supplement_2/ii14/6328680 by University of Szeged user on 20 October 2021
Methods
The methods for collecting and analysing the data are described in the introductory article of this series.4In summary, data on consumption of penicillins, i.e.b-lactam antibacterials, penicillins (ATC group J01C, referred to as penicillins in this manuscript) aggregated at the level of the active
substance, were collected using the WHO ATC/DDD methodology (ATC/DDD index 2019)5and expressed in DDD per 1000 inhabitants per day. In add- ition, where data were available, consumption of penicillins was expressed in packages per 1000 inhabitants per day. Penicillins (J01C) are classified in five subgroups. Because b-lactamase inhibitors (J01CG) are given in conjunction with extended-spectrum penicillins (J01CA), we focused on only the four main subgroups: penicillins with extended-spectrum [J01CA;
extended-spectrum penicillins (ESP)], b-lactamase-sensitive penicillins [J01CE; narrow-spectrum penicillins (NSP)];b-lactamase-resistant penicil- lins [J01CF; penicillinase-resistant penicillins (PRP)], and combinations of penicillins includingb-lactamase inhibitors [J01CR; combinations of penicil- lins (COP)].
There are 46 unique ATC codes for penicillins in the ATC/DDD index 2019. Compared with previous descriptions of the consumption of penicil- lins in the community, two additional substances, i.e. nafcillin (J01CF06) and aspoxicillin (J01CA19), have been assigned an ATC code by the WHO (Table1).2
The evolution of the number of DDD per package over time was assessed using a linear mixed model. The temporal trend, seasonal vari- ation and presence of change-points in consumption of penicillins were assessed using a non-linear change-point mixed model fitted to quarterly data expressed in DDD per 1000 inhabitants per day from 1997 to 2017.6 The relative proportions of the main subgroups were assessed through a compositional data analysis modelling yearly data expressed in DDD per 1000 inhabitants per day from 1997 to 2017.7
Results
An overview of consumption of penicillins (ATC J01C) in the community, expressed in DDD and packages per 1000 inhabitants per day for all participating countries between 1997 and 2017 is available asSupplementary dataatJACOnline (TablesS1 and S2, respectively).
Consumption of penicillins in the community in 2017 In 2017, four substances accounted for 90% of the consumption of penicillins in the community expressed in DDD per 1000 inhabi- tants per day: amoxicillin/clavulanic acid (45.9% in 2017 compared with 42.4% in 2009), amoxicillin (34.8% in 2017 compared with Table 1. Classification ofb-lactam antibacterials, penicillins (J01C; ATC/
DDD index 2019)
Extended-spectrum penicillins
J01CA01 Ampicillin
J01CA02 Pivampicillin
J01CA03 Carbenicillina
J01CA04 Amoxicillinb
J01CA05 Carindacillina
J01CA06 Bacampicillin
J01CA07 Epicillina
J01CA08 Pivmecillinam
J01CA09 Azlocillin
J01CA10 Mezlocillin
J01CA11 Mecillinam
J01CA12 Piperacillin
J01CA13 Ticarcillin
J01CA14 Metampicillina
J01CA15 Talampicillina
J01CA16 Sulbenicillina
J01CA17 Temocillina
J01CA18 Hetacillina
J01CA19 Aspoxicillina
J01CA20 Combinationsa
J01CA51 Ampicillin, combinations
Narrow-spectrum penicillins
J01CE01 Benzylpenicillin
J01CE02 Phenoxymethylpenicillinb
J01CE03 Propicillin
J01CE04 Azidocillina
J01CE05 Pheneticillin
J01CE06 Penamecillin
J01CE07 Clometocillin
J01CE08 Benzathine benzylpenicillin
J01CE09 Procaine penicillin
J01CE10 phenoxymethylpenicillin
J01CE30 Combinations
Combinations of penicillins, includingb-lactamase inhibitors
J01CR01 Ampicillin and BLI
J01CR02 Amoxicillin and BLIb
J01CR03 Ticarcillin and BLI
J01CR04 Sultamicillin
J01CR05 Piperacillin and BLI
J01CR50 Combinations of penicillins
b-Lactamase inhibitors
J01CG01 Sulbactam
J01CG02 Tazobactama
Continued
Penicillinase-resistant penicillins
J01CF01 Dicloxacillin
J01CF02 Cloxacillin
J01CF03 Meticillina
J01CF04 Oxacillin
J01CF05 Flucloxacillinb
J01CF06 Nafcillinc
BLI,b-lactamase inhibitor;Bold typeindicates that consumption was part of the top 90% of the community consumption of penicillins (J01C) in 28 EU/EEA countries in 2017;Italic typeindicates that no consumption of this penicillin was reported in 28 EU/EEA countries in 2017.
aNo consumption of this penicillin was reported in 30 EU/EEA countries in 2009.
bConsumption was part of the top 90% of community consumption of penicillins (J01C) in 30 EU/EEA countries in 2009.
cThis penicillin was not included in the ATC/DDD index in 2009 and was therefore not reported in 2009.
Table 1. Continued
Downloaded from https://academic.oup.com/jac/article/76/Supplement_2/ii14/6328680 by University of Szeged user on 20 October 2021
34.7% in 2009), phenoxymethylpenicillin (9% in 2017 compared with 12.9% in 2009) and flucloxacillin (3.2% in 2017 compared with 2.5% in 2009) (Table1).
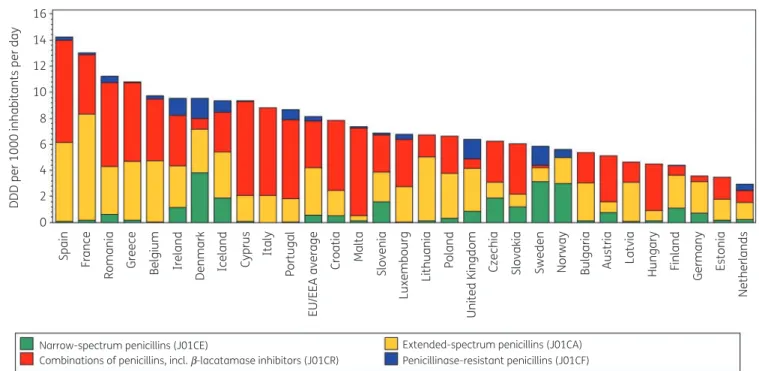
Figure1shows the consumption of penicillins in the community subdivided in the four main subgroups expressed in DDD per 1000 inhabitants per day for 30 EU/EEA countries in 2017. Consumption of penicillins in the community varied by a factor of 4.9 between the countries with the highest (14.23 DDD per 1000 inhabitants per day in Spain) and the lowest (2.92 DDD per 1000 inhabitants per day in the Netherlands) consumption in 2017, which was higher than in 2009 (factor of 3.6, from 10.91 DDD per 1000 inhabitants per day in France to 3.03 DDD per 1000 inhabitants per day in Estonia).
In 2017, NSP represented 10.1% (compared with 15.1% in 2009) of penicillin consumption in the community. Large variations in NSP consumption were found, ranging from 3.8 DDD per 1000 inhabitants per day in Denmark to 0.0006 DDD per 1000 inhabi- tants per day in Italy. Phenoxymethylpenicillin, commonly known as penicillin V, was the most widely reported NSP in most countries.
It represented >50% of penicillin consumption in the community in Sweden (53.8%) and Norway (53.5%), but represented <1% of penicillin consumption in Belgium, Cyprus (total care data, i.e. com- munity and hospital sector combined), Greece, Luxembourg, the Netherlands and Spain, with no consumption reported in Italy, Portugal and Slovenia. A wide variety of other NSPs was reported, which varied depending on the countries. For example, benzathine phenoxymethylpenicillin was mainly consumed in Austria, Croatia, Germany and Slovenia, and benzylpenicillin in Greece and Romania (total care data). Pheneticillin was exclusively consumed in the Netherlands, and procaine benzylpenicillin was exclusively consumed in Spain.
In 2017, ESP represented 38.6% (compared with 37.8% in 2009) of penicillin consumption in the community. ESP consump- tion ranged from 8.2 DDD per 1000 inhabitants per day in France to 0.37 DDD per 1000 inhabitants per day in Malta. Amoxicillin was by far the most commonly reported ESP. It represented >50% of penicillin consumption in the community in Lithuania (72.2%), Germany (68.4%), Latvia (64.0%), France (62.0%), Bulgaria (53.7%), Poland (52.4%) and the United Kingdom (51.2%). Malta had the lowest proportional consumption (5.0%). Pivmecillinam was commonly reported in Denmark (26.2%), Norway (23.2%), Finland (14.0%) and Iceland (13.0%). Mecillinam was only reported in Greece and Norway; pivampicillin was only reported in Denmark; and bacampicillin and piperacillin were only reported in Italy.
In 2017, COP represented 46.3% (compared with 42.8% in 2009) of penicillin consumption in the community. COP consump- tion ranged from 7.85 DDD per 1000 inhabitants per day in Spain to 0.01 DDD per 1000 inhabitants per day in Norway. Amoxicillin/
clavulanic acid was the most commonly reported COP. It repre- sented >50% of penicillin consumption in the community in Malta (91.7%), Hungary (80.1%), Cyprus (76.6%; total care data), Italy (76.5%), Portugal (70.2%), Austria (68.5%), Croatia (68.2%), Romania (56.9%; total care data), Spain (55.2%), Greece (55.2%) and Luxembourg (53.8%), but <5% in Sweden (3.4%). Sultamicillin consumption remained <1% of penicillin consumption in the com- munity for all countries but Estonia (2.4%), Germany (2.2%) and Lithuania (1.5%).
In 2017, PRP represented 5.0% (compared with 4.3% in 2009) of penicillin consumption in the community. PRP con- sumption ranged from 1.56 DDD per 1000 inhabitants per day in Denmark to 0.0001 DDD per 1000 inhabitants per day in 16
DDD per 1000 inhabitants per day
14 12 10 8 6 4 2 0
Narrow-spectrum penicillins (J01CE) Extended-spectrum penicillins (J01CA) Penicillinase-resistant penicillins (J01CF) Combinations of penicillins, incl. b-lacatamase inhibitors (J01CR)
Spain France Greece Belgium Ireland Italy Portugal Malta Slovenia Poland Czechia Slovakia Sweden Norway Bulgaria Austria Latvia Hungary Finland Germany Estonia Netherlands
United Kingdom
Lithuania
Luxembourg
Croatia
EU/EEA average
Cyprus
Iceland
Denmark
Romania
Figure 1. Consumption of penicillins (ATC J01C) in the community, expressed in DDD (ATC/DDD index 2019) per 1000 inhabitants per day, 30 EU/EEA countries, 2017. For Czechia, 2015 data are used. For Slovakia, 2016 data are used. For Cyprus and Romania, total care data, i.e. community and hos- pital sector combined, are used.
Bruyndonckxet al.
Downloaded from https://academic.oup.com/jac/article/76/Supplement_2/ii14/6328680 by University of Szeged user on 20 October 2021
Estonia, with no consumption reported in Bulgaria and Hungary.
Flucloxacillin was the most commonly reported PRP. It repre- sented >20% of penicillin consumption in the community in Sweden (25.2%) and the United Kingdom (23.7%) while it was not reported in Cyprus (total care data), France, Greece, Lithuania, Poland and Spain. With the exception of Lithuania, countries without flucloxacillin consumption reported con- sumption of cloxacillin as the sole PRP.
Figure2shows consumption of penicillins in the community expressed in packages per 1000 inhabitants per day for 20 EU/EEA countries in 2017. Based on this indicator, France showed the high- est consumption (2.7 packages per 1000 inhabitants per day) while Sweden showed the lowest consumption (0.5 packages per 1000 inhabitants per day). Denmark shifted from rank 6 for its con- sumption of penicillins in DDD per 1000 inhabitants per day (among the highest prescribing countries) to rank 12 in packages per 1000 inhabitants per day (among the lowest prescribing countries), Spain moved from the 1st to the 4th rank and Sweden from the 15th to the 20th rank, while Italy moved from the 8th to the 3rd rank (Table2). The lowest mean number of DDD per package was observed for France (4.9 DDD per package) and the highest for Spain and Sweden (10.7 DDD per package).
In the EU/EEA, the number of DDD per package increased signifi- cantly over time [!0.099 (SD 0.0274) DDD per year] during 1997–
2017.
Longitudinal data analysis, 1997–2017
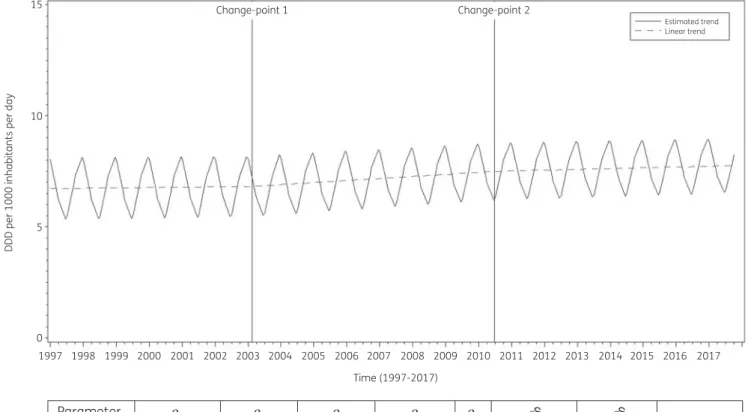
The best fit was obtained for a model including two change-points:
one in the first quarter of 2003 and another in the second quarter of 2010. The final model fits the observed data well (FigureS1).
The longitudinal data analysis estimated an average consumption of penicillins in the EU/EEA of 6.717 (SE 0.501) DDD per 1000 inhab- itants per day in the first quarter of 1997, which did not change sig- nificantly over time:!0.004 (SE 0.011) DDD per 1000 inhabitants per day per quarter until the first quarter of 2003; !0.022 (SE 0.019) DDD per 1000 inhabitants per day per quarter between the second quarter of 2003 and the second quarter of 2010; and
!0.008 (SE 0.030) DDD per 1000 inhabitants per day per quarter afterwards. Furthermore, the longitudinal data analysis showed significant seasonal variation with an amplitude of 1.413 (SE 0.164) DDD per 1000 inhabitants per day, which did not change significantly over time:#0.002 (SE 0.001) DDD per 1000 inhabi- tants per day per quarter (Figure3).
Based on the final fitted model, consumption of penicillins in the community in 1997 was significantly above average in Iceland and Slovakia, and significantly below average in Estonia, Finland, Germany, the Netherlands and the United Kingdom (observed profiles shown in FiguresS2andS3). The seasonal variation was significantly larger than average in Belgium, Italy, Lithuania, Luxembourg and Slovakia, and significantly smaller than average in Austria, Estonia, Finland, Germany, Greece, the Netherlands, Sweden and the United Kingdom. The increase in consumption of penicillins in the community between 1997 and the first quarter of 2003 was significantly larger than average in Croatia, Denmark and Poland. The increase in consumption of penicillins between the second quarter of 2003 and the second quarter of 2010 was significantly larger than average in Belgium, Italy and Luxembourg. The increase in consumption of penicillins between the third quarter of 2010 and the last quarter of 2017 was signifi- cantly larger than average in Ireland.
3.0 2.5 2.0 1.5
Packages per 1000 inhabitants per day
1.0 0.5 0.0
France Greece Italy Spain Belgium Iceland Ireland Croatia Slovenia Portugal Lithuania Denmark Czechia Latvia Slovakia Austria Bulgaria Finland Estonia Sweden
EU/EEA average
Narrow-spectrum penicillins (J01CE) Extended-spectrum penicillins (J01CA) Penicillinase-resistant penicillins (J01CF) Combinations of penicillins, incl. b-lacatamase inhibitors (J01CR)
Figure 2. Consumption of penicillins (ATC J01C) in the community, expressed in packages per 1000 inhabitants per day, 20 EU/EEA countries, 2017.
For Czechia, 2015 data are used. For Slovakia, 2016 data are used. For Cyprus and Romania, total care data, i.e. community and hospital sector com- bined, are used.
Downloaded from https://academic.oup.com/jac/article/76/Supplement_2/ii14/6328680 by University of Szeged user on 20 October 2021
Compositional data analysis, 1997–2017
The proportional consumption of ESP and COP significantly increased over time relative to that of NSP and PRP. In addition, the proportional consumption of COP significantly increased over time relative to that of ESP (Table3).
Trends of proportional consumption of penicillins in the com- munity for individual countries are shown in FigureS4. When com- paring the composition of the consumption of penicillins (J01C) in 2017 with that in 2009, the proportion of NSP decreased for most of the participating countries. The largest decreases were observed for Denmark (#13.74%), Lithuania (#10.77%) and Hungary (#10.70%). However, increases were also observed, with the larg- est increases reported for Poland (!2.58%), Malta (!1.45%) and Romania (!1.42%; total care data; coverage in 2009 limited to 30%–40%). For the proportions of ESP, COP and PRP, both increases and decreases were observed between 2009 and 2017. For ESP, the largest increases were reported for Belgium (!10.12%), France (!7.80%) and Spain (!7.06%; private prescriptions included from 2016 onwards), while the largest decreases were reported for Estonia (#18.63%), Cyprus (#14.29%; total care data) and Italy (#12.64%). For COP, the largest increases were reported for Estonia (!21.84%), Croatia (!18.72%) and Hungary (!18.16%), while the largest decreases were reported for Belgium (#9.37%), Luxembourg (#8.24%) and Ireland (#7.09%). For PRP, the largest increases were reported for the United Kingdom (!4.59%), the Netherlands (!4.15%) and Denmark (!4.10%), while the larg- est decreases were reported for France (#2.75%) and Iceland (#2.23%).
Discussion
Penicillins (J01C) were the most frequently consumed antibiotics in the community in the EU/EEA in 2017.4Consumption of penicillins in European countries that are not part of the ESAC-Net but cov- ered by the WHO Europe Antimicrobial Medicines Consumption Network also was substantial, ranging from 28% in Kazakhstan to 52.5% in Uzbekistan.8
In the EU/EEA, consumption of penicillins in the community remained high and stable between 1997 and 2017. Inter-country variability of consumption of penicillins in the community expressed in DDD per 1000 inhabitants per day was substantial, and increased when compared with data from 2009. Seasonal variation was high and remained stable over time.
Among the 46 penicillins with an ATC code, more substances were no longer prescribed in 2017 (21 out of 46) than in 2009 (12 out of 44). Overall, COP was the most frequently con- sumed subgroup of penicillins. Proportional consumption of COP increased in most countries at the expense of consumption of NSP or ESP. Given that total consumption of penicillins did not change significantly over time between 1997 and 2017, this implies that consumption of antibiotics from one subgroup was merely replaced by consumption of antibiotics from another subgroup, rather than being reduced overall. In Belgium, a 10%
decrease in consumption of COP was accompanied by a 10%
increase in consumption of ESP, most likely as the result of successful multi-faceted campaigning in the country.9Country- specific consumption of COP showed great variability, ranging from 7.85 DDD per 1000 inhabitants per day in Spain to 0.01 Table2.Rankingofconsumptionofpenicillins(ATCJ01C)inthecommunity,expressedinDDDorpackagesper1000inhabitantsperday,20EU/EEAcountries,2017 CountryFranceGreeceItalySpainBelgiumIcelandIrelandCroatiaSloveniaPortugalLithuaniaDenmarkCzechiaLatviaSlovakiaAustriaBulgariaFinlandEstoniaSweden Rankingfor packagesper 1000inhabitants perday
1234567891011121314151617181920 Rankingfor DDDper 1000inhabitants perday
2381475101191261317141716192015 NumberofDDD perpackage4.95.56.410.77.77.88.37.26.48.26.59.36.65.87.76.97.56.76.010.7 ForCzechia,2015dataareused.ForSlovakia,2016dataareused.ForCyprusandRomania,totalcaredataareused.ForIreland,nitrofurantoin(J01XE01)consumptionwasnot included.
Bruyndonckxet al.
Downloaded from https://academic.oup.com/jac/article/76/Supplement_2/ii14/6328680 by University of Szeged user on 20 October 2021
DDD per 1000 inhabitants per day in Norway. The most frequently reported substance was amoxicillin/clavulanic acid, which represented >50% of penicillin consumption in the com- munity in 11 countries. This finding, once again, raises concern about the appropriate prescribing of amoxicillin/clavulanic acid for respiratory tract infections (RTIs).10
Given that the mean number of DDD per package varied consid- erably and increased over time,11and that antimicrobial resistance best correlates with consumption expressed in packages,12we recommend evaluating antibiotic consumption expressed both in DDD per 1000 inhabitants per day and in packages per 1000 inhabitants per day.
With the exception of four penicillins that represented <1% of penicillin consumption in the community in EU/EEA countries, the
penicillins used were listed in the 2019 WHO Access, Watch or Reserve (AWaRe) classification list.13Most penicillins are listed as antibiotics belonging to the Access group. The antibiotics listed in the Watch group, which include pheneticillin (J01CE05), piperacillin (J01CA12), piperacillin and b-lactamase inhibitor (J01CR05) and temocillin (J01CA17), are mainly used in the hos- pital sector (consumption of these antibiotics in the community was <1% in the EU/EEA in 2017). Care should be taken by countries to optimize the availability of penicillins that belong to the Access group.
The continued seasonal variation in consumption of penicil- lins in the community found in this study confirms that penicil- lins are still prescribed for seasonal RTIs, which represent nearly 60% of antibiotic prescriptions in the community, even though
15 Change-point 1 Change-point 2
Estimated trend Linear trend
10
DDD per 1000 inhabitants per day
5
0
1997 1998 1999 2000 2001 2002 2003 2004 2005 2006 2007 Time (1997-2017)
2008 2009 2010 2011 2012 2013 2014 2015 2016 2017
Parameter
Estimate (std.
error)
6.717 (0.501)*
0.004 (0.011)
0.019 (0.019)
–0.014 (0.023)
–
1.413 (0.164)*
–0.002 (0.001)
0.383 (0.020)*
b0 b1 b2 b3 b4 bS0 bS1 d
Figure 3. Estimated trend (solid line) and linear trend (dashed line) of consumption of penicillins (ATC J01C) in the community based on quarterly data, 25 EU/EEA countries, 1997–2017.b0, predicted consumption in the first quarter of 1997;b1, predicted increase (if positive)/decrease (if negative) in consumption per quarter;b2, predicted difference in slope after versus before the first change-point;b3, predicted difference in slope after versus before the second change-point;b4, predicted difference in slope after versus before the third change-point;b0S, predicted amplitude of the upward winter and downward summer peak in consumption;b1S, predicted increase (if positive)/decrease (if negative) of the amplitude of the upward winter and downward summer peak in consumption per quarter;d, shift in timing of the upward winter and downward summer peak from one year to an- other. *Statistically significant at significance level 0.05.
Downloaded from https://academic.oup.com/jac/article/76/Supplement_2/ii14/6328680 by University of Szeged user on 20 October 2021
RTIs are mostly viral in origin.14–16Based on this finding, acute RTIs remain an ideal opportunity for antimicrobial stewardship activities in the community in EU/EEA countries.
For a detailed discussion on the limitations of the collected data, we refer to the article on antibacterials for systemic use, included in this series.17For a discussion on the limitations of the statistical approach used in this study and potential explanations for the common change-points detected through these analyses, we refer to the tutorial included in this series.6
In conclusion, neither the consumption nor the seasonal vari- ation in consumption of penicillins in the community changed over time. However, the proportional consumption of COP increased significantly over time during 1997–2017.
Acknowledgements
We are grateful to the National Focal Points for Antimicrobial Consumption, Operational Contact Points for Epidemiology — Antimicrobial Consumption and Operational Contact Points for TESSy/IT data manager — Antimicrobial Consumption, that constitute the European Surveillance of Antimicrobial Consumption Network (ESAC- Net), for their engagement in collecting, validating and reporting anti- microbial consumption data to ECDC. In addition, we would like to thank Vera Vlahovic-Palcevski (consultant for ECDC) for her critical reading of the manuscript.
Members of the ESAC-Net study group
Reinhild Strauss (Austria), Eline Vandael (Belgium), Stefana Sabtcheva (Bulgaria), Marina Payerl-Pal (Croatia), Isavella Kyriakidou (Cyprus), Jirı´
Vlcek (Czechia), Ute Wolff So¨nksen (Denmark), Elviira Linask (Estonia), Emmi Sarvikivi (Finland), Philippe Cavalie´ (France), Marc Schneider (Germany), Flora Kontopidou (Greece), Ria Benko (Hungary), Gudrun} Aspelund (Iceland), Ajay Oza (Ireland), Filomena Fortinguerra (Italy), Ieva Rutkovska (Latvia), Jolanta Kuklyte (Lithuania), Marcel Bruch_ (Luxembourg), Peter Zarb (Malta), Stephanie Natsch (the Netherlands), Hege Salvesen Blix (Norway), Anna Olczak-Pienkowska (Poland), Ana Silva (Portugal), Gabriel Adrian Popescu (Romania), Toma´s Tesar
(Slovakia), Milan Cizman (Slovenia), Mayte Alonso Herreras (Spain), Vendela Bergfeldt (Sweden) and Berit Mu¨ller-Pebody (the United Kingdom).
Funding
R.B. is funded as a postdoctoral researcher by the Research Foundation—
Flanders (FWO 12I6319N). N.H. acknowledges support from the University of Antwerp scientific chair in Evidence-Based Vaccinology, financed in 2009–2020 by an unrestricted grant from Pfizer and in 2016–2019 from GSK. Support from the Methusalem finance programme of the Flemish Government is gratefully acknowledged.
Transparency declarations
The authors have none to declare. This article forms part of a Supplement.
Supplementary data
TablesS1andS2and FiguresS1toS4are available asSupplementary data atJACOnline.
References
1 European Centre for Disease Prevention and Control (ECDC). European Surveillance of Antimicrobial Consumption Network (ESAC-Net). 2020.
https://www.ecdc.europa.eu/en/about-us/partnerships-and-networks/dis ease-and-laboratory-networks/esac-net.
2 Adriaenssens N, Coenen S, Versporten Aet al.European Surveillance of Antimicrobial Consumption (ESAC): outpatient antibiotic use in Europe (1997- 2009).J Antimicrob Chemother2011;66: vi3–12.
3 Ferech M, Coenen S, Dvorakova K et al. European Surveillance of Antimicrobial Consumption (ESAC): outpatient cephalosporin use in Europe.J Antimicrob Chemother2006;58: 413–7.
4 Bruyndonckx R, Adriaenssens N, Versporten Aet al.Consumption of antibi- otics in the community, European Union/European Economic Area, 1997–
2017.J Antimicrob Chemother2021;76Suppl 2: ii7–ii13.
5 WHO collaborating centre for drug statistics methodology. ATC Classification index with DDDs2019.Oslo; 2018.
6 Bruyndonckx R, Hoxha A, Quinten Cet al.Change-points in antibiotic con- sumption in the community, European Union/European Economic Area, 1997–2017.J Antimicrob Chemother2021;76Suppl 2: ii68–ii78.
7 Faes C, Molenberghs G, Hens Net al.Analysing the composition of out- patient antibiotic use: a tutorial on compositional data analysis.J Antimicrob Chemother2011;66: vi89–94.
8 WHO Regional Office for Europe Antimicrobial Medicines Consumption (AMC) Network. AMC data2011–2017. 2020.
9 Bruyndonckx R, Coenen S, Hens Net al.Antibiotic use and resistance in Belgium: the impact of two decades of multi-faceted campaigning.Acta Clin Belg2021;76: 280–8.
10 Versportern A, Coenen S, Adriaenssens Net al.European Surveillance of Antimicrobial Consumption (ESAC): outpatient penicillin use in Europe (1997- 2009).J Antimicrob Chemother2011;66: vi12–24.
11 Bruyndonckx R, Hens N, Aerts Met al.Measuring trends of outpatient antibiotic use in Europe: jointly modelling longitudinal data in defined daily doses and packages.J Antimicrob Chemother2014;69: 1981–6.
12 Bruyndonckx R, Hens N, Aerts Met al.Exploring the association between resistance and outpatient antibiotic use expressed as DDDs or packages.
J Antimicrob Chemother2015;70: 1241–4.
Table 3. Change in the composition of the consumption of penicillins (ATC J01C) in the community, expressed in DDD (ATC/DDD index 2019) per 1000 inhabitants per day, 30 EU/EEA countries, as a function of time during 1997–2017
NSP ESP COP PRP
NSP #0.0586 #0.1183 #0.0295
ESP 0.0586 #0.0597 0.0292
COP 0.1183 0.0597 0.0888
PRP 0.0295 #0.0292 #0.0888
Values are estimated changes in the log ratio of the row versus column subgroup of antibiotics with increasing time. Bold type indicates a statistically significant effect; positive values represent an increase and negative values represent a decrease.
NSP, narrow-spectrum penicillins (J01CE); ESP, extended-spectrum peni- cillins (J01CA); COP, combinations of penicillins, includingb-lactamase inhibitors (J01CR); PRP, penicillinase-resistant penicillins (J01CF).
Bruyndonckxet al.
Downloaded from https://academic.oup.com/jac/article/76/Supplement_2/ii14/6328680 by University of Szeged user on 20 October 2021
13 WHO. WHO 2019 AWaRe Classification Antibiotics release. https://www.
who.int/news/item/01-10-2019-who-releases-the-2019-aware-classifica tion-antibiotics.
14 Aabenhus R, Hansen MP, Saust LTet al.Characterisation of antibiotic prescriptions for acute respiratory tract infections in Danish general practice:
a retrospective registry based cohort study.NPJ Prim Care Respir Med2017;
27: 37.
15 Walsh TL, Taffe K, Sacca Net al.Risk Factors for Unnecessary Antibiotic Prescribing for Acute Respiratory Tract Infections in Primary Care.Mayo Clin Proc Innov Qual Outcomes2020;4: 31–9.
16 O’Doherty J, Leader LFW, O’Regan Aet al.Over prescribing of antibiotics for acute respiratory tract infections; A qualitative study to explore Irish gen- eral practitioners’ perspectives.BMC Fam Pract2019;20: 27.
17 Bruyndonckx R, Adriaenssens Versporten Aet al.Consumption of antibi- otics in the community, European Union/European Economic Area, 1997–
2017: data collection, management and analysis.J Antimicrob Chemother 2021;76Suppl 2: ii2–ii6. Downloaded from https://academic.oup.com/jac/article/76/Supplement_2/ii14/6328680 by University of Szeged user on 20 October 2021