Consumption of cephalosporins in the community, European Union/European Economic Area, 1997–2017
Ann Versporten1*†, Robin Bruyndonckx 1,2†, Niels Adriaenssens1,3, Niel Hens2,4, Dominique L. Monnet5, Geert Molenberghs2,6, Herman Goossens1, Klaus Weist5and Samuel Coenen 1,3on behalf of the ESAC-Net study
group‡
1Laboratory of Medical Microbiology, Vaccine & Infectious Disease Institute (VAXINFECTIO), University of Antwerp, Antwerp, Belgium;
2Interuniversity Institute for Biostatistics and statistical Bioinformatics (I-BIOSTAT), Hasselt University, Data Science Institute, Hasselt, Belgium;3Centre for General Practice, Department of Family Medicine & Population Health (FAMPOP), University of Antwerp, Antwerp,
Belgium;4Centre for Health Economic Research and Modelling Infectious Diseases, Vaccine & Infectious Disease Institute (VAXINFECTIO), University of Antwerp, Antwerp, Belgium;5Disease Programmes Unit, European Centre for Disease Prevention and Control, Stockholm, Sweden;6Interuniversity Institute for Biostatistics and statistical Bioinformatics (I-BIOSTAT), Catholic University of
Leuven, Leuven, Belgium
*Corresponding author. E-mail: ann.versporten@uantwerpen.be
†These authors contributed equally to this work.
‡Members are listed in the Acknowledgements.
Objectives: Data on cephalosporin consumption in the community were collected from 30 EU/EEA countries over two decades. This article reviews temporal trends, seasonal variation, presence of change-points and changes in the composition of the main subgroups of cephalosporins.
Methods: For the period 1997–2017, data on consumption of cephalosporins (i.e. first-, second-, third- and fourth-generation cephalosporins; ATC subgroups J01DB, J01DC, J01DD and J01DE, respectively) in the commu- nity and aggregated at the level of the active substance, were collected using the WHO ATC/DDD methodology (ATC/DDD index 2019). Consumption was expressed in DDD per 1000 inhabitants per day and in packages per 1000 inhabitants per day. Cephalosporin consumption was analysed based on ATC-4 subgroup, and presented as trends, seasonal variation, presence of change-points and compositional changes.
Results: In 2017, cephalosporin consumption in the community expressed in DDD per 1000 inhabitants per day varied by a factor of 285 between countries with the highest (Greece) and the lowest (the Netherlands) con- sumption. Cephalosporin consumption did not change significantly between the first quarter of 1997 and the last quarter of 2017. Seasonal variation decreased significantly over time. Proportional consumption of second- and third-generation cephalosporins significantly increased over time compared with that of first-generation cephalosporins, and proportional consumption of fourth-generation cephalosporins significantly decreased compared with that of second- and third-generation cephalosporins.
Conclusions: Despite considerable variation between countries in the composition of cephalosporin consump- tion and trends over time, a significant shift towards consumption of more broad-spectrum cephalosporins in the community was observed across the EU/EEA during 1997–2017.
Introduction
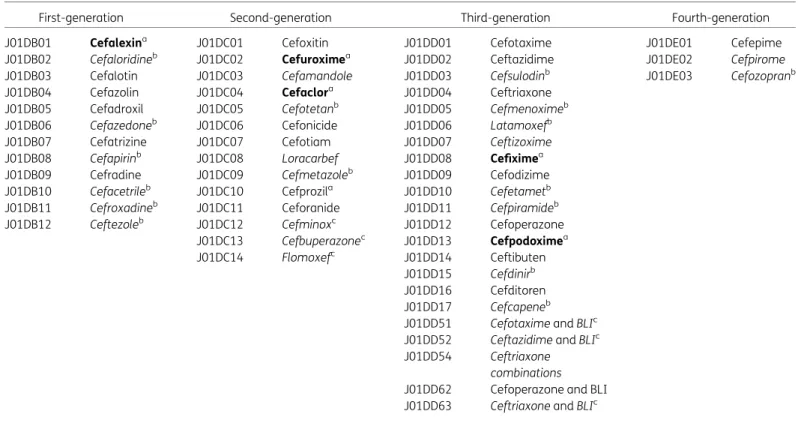
This article presents data from the European Surveillance of Antimicrobial Consumption Network (ESAC-Net,1formerly ESAC) on consumption of cephalosporins in the community (i.e. primary care sector) for 30 EU/EEA countries in 2017. Because consumption of monobactams, carbapenems and other cephalosporins and penems is very small in the community in EU/EEA countries, this article focusses on consumption of first-, second-, third- and
fourth-generation cephalosporins (Table 1).2The present study updates previous ESAC studies published in 2006 and 2011, and in doing so it provides updated comparable and reliable information on antibiotic consumption that can aid in fighting the global prob- lem of antimicrobial resistance.3,4In 2017, cephalosporins repre- sented 11.6% of antibiotic consumption in the community.5The objective of this study was to analyse temporal trends, seasonal variation and the presence of change-points in cephalosporin
VC The Author(s) 2021. Published by Oxford University Press on behalf of the British Society for Antimicrobial Chemotherapy.
This is an Open Access article distributed under the terms of the Creative Commons Attribution License (http://creativecommons.org/licenses/
J Antimicrob Chemother2021;76Suppl 2: ii22–ii29 doi:10.1093/jac/dkab174
Downloaded from https://academic.oup.com/jac/article/76/Supplement_2/ii22/6328681 by University of Szeged user on 20 October 2021
consumption in the community for the period 1997–2017, as well as to analyse the composition of cephalosporin consumption over time.
Methods
The methods for collecting and analysing the data are described in the introductory article of this series.6In summary, data on consumption of cephalosporins, i.e. first-, second-, third- and fourth-generation cephalo- sporins (ATC groups J01DB, J01DC, J01DD and J01DE, respectively), aggre- gated at the level of the active substance, were collected using the WHO ATC/DDD methodology (ATC/DDD index 2019) and expressed in DDD per 1000 inhabitants per day. In addition, where data were available, cephalo- sporin consumption was expressed in packages per 1000 inhabitants per day. There are 51 unique ATC codes for cephalosporins in the ATC/DDD index 2019. Compared with previous descriptions of the consumption of cephalosporins in the community,4 three additional second-generation cephalosporins and three additional third-generation cephalosporins have been assigned an ATC code by the WHO (Table1).
The evolution of the number of DDD per package over time was assessed using a linear mixed model. The temporal trend, seasonal vari- ation and presence of change-points in cephalosporin consumption were assessed using a non-linear change-point mixed model fitted to quarterly data expressed in DDD per 1000 inhabitants per day from 1997 to 2017.7
The relative proportions of the main subgroups were assessed through a compositional data analysis modelling yearly data expressed in DDD per 1000 inhabitants per day from 1997 to 2017.8
Results
An overview of consumption of cephalosporins (ATC J01DB, J01DC, J01DD and J01DE) in the community, expressed in DDD and pack- ages per 1000 inhabitants per day for all participating countries between 1997 and 2017 is available as Supplementary dataat JACOnline (TablesS1andS2, respectively).
Cephalosporin consumption in the community in 2017 In 2017, five substances accounted for 90% of cephalosporin consumption in the community expressed in DDD per 1000 inhabi- tants per day: cefuroxime (63.0% in 2017 compared with 56.5%
in 2009), cefixime (8.9% in 2017 compared with 7.3% in 2009), cefalexin (8% in 2017 compared with 9.5% in 2009), cefaclor (7.2% in 2017 compared with 10.1% in 2009) and cefpodoxime (3.1% in 2017 compared with 3.1% in 2009) (Table1).
Figure1shows the consumption of cephalosporins in the com- munity subdivided into the four generations expressed in DDD per Table 1. Classification of cephalosporins (J01DB, J01DC, J01DD and J01DE; ATC/DDD index 2019)
First-generation Second-generation Third-generation Fourth-generation
J01DB01 Cefalexina J01DC01 Cefoxitin J01DD01 Cefotaxime J01DE01 Cefepime
J01DB02 Cefaloridineb J01DC02 Cefuroximea J01DD02 Ceftazidime J01DE02 Cefpirome
J01DB03 Cefalotin J01DC03 Cefamandole J01DD03 Cefsulodinb J01DE03 Cefozopranb
J01DB04 Cefazolin J01DC04 Cefaclora J01DD04 Ceftriaxone
J01DB05 Cefadroxil J01DC05 Cefotetanb J01DD05 Cefmenoximeb
J01DB06 Cefazedoneb J01DC06 Cefonicide J01DD06 Latamoxefb
J01DB07 Cefatrizine J01DC07 Cefotiam J01DD07 Ceftizoxime
J01DB08 Cefapirinb J01DC08 Loracarbef J01DD08 Cefiximea
J01DB09 Cefradine J01DC09 Cefmetazoleb J01DD09 Cefodizime
J01DB10 Cefacetrileb J01DC10 Cefprozila J01DD10 Cefetametb
J01DB11 Cefroxadineb J01DC11 Ceforanide J01DD11 Cefpiramideb
J01DB12 Ceftezoleb J01DC12 Cefminoxc J01DD12 Cefoperazone
J01DC13 Cefbuperazonec J01DD13 Cefpodoximea
J01DC14 Flomoxefc J01DD14 Ceftibuten
J01DD15 Cefdinirb J01DD16 Cefditoren J01DD17 Cefcapeneb J01DD51 CefotaximeandBLIc J01DD52 CeftazidimeandBLIc J01DD54 Ceftriaxone
combinations J01DD62 Cefoperazone and BLI J01DD63 CeftriaxoneandBLIc
BLI,b-lactamase inhibitor;Bold typeindicates that consumption was part of the top 90% of the community consumption of cephalosporins (J01DB, J01DC, J01DD and J01DE) in 28 EU/EEA countries in 2017;Italic typeindicates that no consumption of this cephalosporin was reported in 28 EU/EEA countries in 2017.
aConsumption was part of the top 90% of the community consumption of cephalosporins (J01DB, J01DC, J01DD and J01DE) in 30 EU/EEA countries in 2009.
bNo consumption of this cephalosporin was reported in 30 EU/EEA countries in 2009.
cThis cephalosporin was not included in the ATC/DDD index in 2009 and was therefore not reported in 2009.
Downloaded from https://academic.oup.com/jac/article/76/Supplement_2/ii22/6328681 by University of Szeged user on 20 October 2021
1000 inhabitants per day for 30 EU/EEA countries in 2017.
Cephalosporin consumption in the community varied by a factor of 285 between the countries with the highest (7.65 DDD per 1000 inhabitants per day in Greece) and the lowest (0.03 DDD per 1000 inhabitants per day in the Netherlands) consumption, which was similar compared with 2009 (factor of 267, from 8.7 DDD per 1000 inhabitants per day in Greece to 0.03 DDD per 1000 inhabitants per day in Denmark). Inter-country variations were high when com- paring consumption of first-, second-, third- and fourth-generation cephalosporins (TableS1).
In 2017, first-generation cephalosporins represented 10.6%
(14% in 2009) of cephalosporin consumption in the community.
Consumption was the highest in Northern EU/EEA countries such as Finland (98.9% of cephalosporin consumption in the commu- nity), Iceland (98.2%), Sweden (97.3%), Norway (90.3%) and the United Kingdom (89.8%) and the lowest (<1%) in Greece, Hungary and Luxembourg. First-generation cephalosporin consumption was mostly represented by one substance, namely cefalexin (J01DB01), in Croatia, Finland and Malta (100%) and Iceland (99.4%). Cefadroxil (J01DB05) was the preferred first-generation cephalosporin in Estonia and Latvia (>90%) and in Lithuania (>80%). Cefradine (J01DB09) was only consumed in the United Kingdom (5.6%), Portugal (3.8%) and France (2.2%). First-gener- ation cephalosporins represented <5% of cephalosporin consump- tion in the community in Belgium, Bulgaria, France, Germany, Greece, Hungary, Italy, Luxembourg, Malta, Spain, Romania (total care data, i.e. community and hospital sector combined) and Cyprus (total care data).
In 2017, second-generation cephalosporins represented 73.0%
(71.5% in 2009) of cephalosporin consumption in the community.
The second-generation cephalosporins represented >60% of cephalosporin consumption in the community in 21 EU/EEA coun- tries. Consumption was the highest for cefuroxime (J01DC02), which represented >50% of second-generation cephalosporin consumption in the community in all but three countries (Ireland, Sweden, United Kingdom). Ireland had the highest consumption of cefaclor (J01DC04; 60.4%). Countries with the highest consump- tion of cefprozil (J01DC10) were Hungary (16.2%), Greece (10.3%) and Estonia (6.6%). Greece was the only country using ceforanide (J01DC11).
In 2017, third-generation cephalosporins represented 16.4%
(14.5% in 2009) of cephalosporin consumption in the community.
These were mostly cefixime (J01DD08), cefpodoxime (J01DD13) and ceftriaxone (J01DD04), from which 20.6% was for parenteral use (mainly ceftriaxone). The highest consumption of third-gener- ation cephalosporins was observed for Italy (>80% of cephalo- sporin consumption, of which mainly cefixime for oral use), France (>70%, mainly the oral substances cefpodoxime and cefixime), Romania (total care data: 26.0%, mainly cefixime and ceftriaxone), and Cyprus (total care data: 18.1%, mainly cefixime).
In 2017, 16 EU/EEA countries reported consumption of fourth- generation cephalosporins in the community. This consumption was very low, only representing 0.01% (0.02% in 2009) of cephalo- sporin consumption in the community in the EU/EEA. The highest consumption of fourth-generation cephalosporins was observed for Italy (0.15%). The only fourth-generation cephalosporin con- sumed was cefepime (J01DE01), with the exception of cefpirome (J01DE02) in Bulgaria.
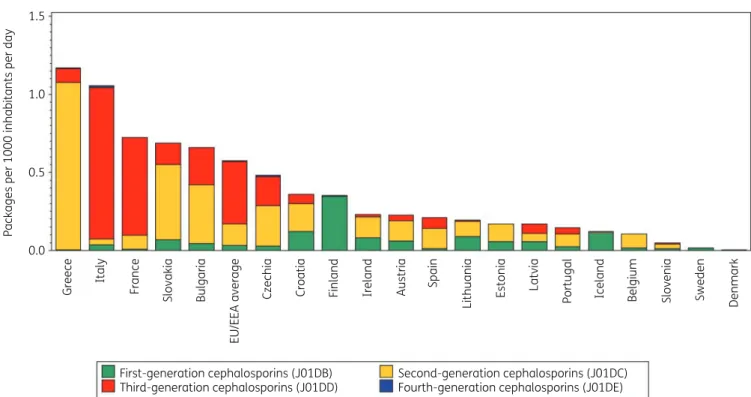
Figure2shows cephalosporin consumption in the community expressed in packages per 1000 inhabitants per day for 20 EU/EEA 8
7 6
DDD per 1000 inhabitants per day
5 4 3 2 1 0
Greece Cyprus Romania Slovakia Bulgaria
First-generation cephalosporins (J01DB) Third-generation cephalosporins (J01DD)
Second-generation cephalosporins (J01DC) Fourth-generation cephalosporins (J01DE)
Poland Malta Germany Croatia Luxembourg Spain Czechia Hungary EU/EEA average Finland Italy Portugal France Austria Lithuania Estonia Belgium Ireland Latvia Iceland Slovenia Sweden Norway Denmark Netherlands
United Kingdom
Figure 1. Consumption of cephalosporins (ATC J01DB, J01DC, J01DD and J01DE) in the community, expressed in DDD (ATC/DDD index 2019) per 1000 inhabitants per day, 30 EU/EEA countries, 2017. For Czechia, 2015 data are used. For Slovakia, 2016 data are used. For Cyprus and Romania, total care data, community and hospital sector combined, are used.
Versportenet al.
Downloaded from https://academic.oup.com/jac/article/76/Supplement_2/ii22/6328681 by University of Szeged user on 20 October 2021
countries in 2017. Portugal ranked 9th for its cephalosporin con- sumption in DDD per 1000 inhabitants per day and 15th in pack- ages per 1000 inhabitants per day, Spain 5th and 11th, Italy 8th and 2nd, and France 10th and 3rd, respectively (Table2). The num- ber of DDD per package ranged from 1.8 in Italy to 11.4 in Portugal.
In the EU/EEA countries, the number of DDD per package did not change significantly over time during the period 1997–2017.
Longitudinal data analysis, 1997–2017
The best fit was obtained for a model including two change-points:
one in the last quarter of 2003 and another in the second quarter of 2011. The final model fits the observed data well (FigureS1).
The longitudinal data analysis estimated an average cephalo- sporin consumption in the EU/EEA of 2.154 (SE 0.425) DDD per 1000 inhabitants per day in the first quarter of 1997, which did not change significantly over time:#0.003 (SE 0.006) DDD per 1000 inhabitants per day per quarter up to the last quarter of 2003;
!0.006 (SE 0.013) DDD per 1000 inhabitants per day per quarter until the second quarter of 2011; and!0.009 (SE 0.015) DDD per 1000 inhabitants per day per quarter afterwards. Furthermore, the longitudinal data analysis showed significant seasonal variation with an amplitude of 0.616 (SE 0.09) DDD per 1000 inhabitants per day, which decreased significantly over time with 0.004 (SE 0.001) DDD per 1000 inhabitants per day per quarter (Figure3). The sea- sonal variation in cephalosporin consumption is shown in Figures S2andS3. Seasonal variations were observed in all countries.
Based on the fitted model, cephalosporin consumption in the community in 1997 was significantly higher than average in Belgium, Cyprus (total care data), Greece, Italy, Luxembourg and
Portugal, and significantly lower than average in Denmark, Estonia, Germany, Iceland, Lithuania, the Netherlands, Slovenia, Sweden and the United Kingdom. The decrease in cephalosporin consumption between 1997 and the last quarter of 2003 was sig- nificantly larger than average in Belgium, Hungary and Spain, and smaller than average in Croatia and Slovakia. The increase in ceph- alosporin consumption between the first quarter of 2004 and the second quarter of 2011 was significantly larger than average in Germany, Lithuania and Slovakia. The increase in cephalosporin consumption between the third quarter of 2011 and 2017 was sig- nificantly larger than average in Lithuania and Slovakia. Seasonal variation was significantly larger than average in Belgium, Germany, Greece, Hungary, Italy, Luxembourg, Portugal and Slovakia, and significantly smaller than average in Denmark, Estonia, Finland, Iceland, Lithuania, the Netherlands, Slovenia, Sweden and the United Kingdom.
Between 2009 and 2017 cephalosporin consumption increased in 12 EU/EEA countries (TableS1). This increase was the highest in Bulgaria followed by Spain, Poland and Romania. Iceland, a coun- try with low cephalosporin consumption in the community, has doubled its consumption since 2009, mainly due to an increase in the consumption of the first-generation cephalosporin cefalexin.
As in 2009, the Netherlands and Denmark still had the lowest con- sumption of cephalosporins in the community in 2017. The Netherlands even showed a further decrease mainly due to the continuous decrease in the consumption of the second-generation cephalosporins (cefaclor and cefuroxime), but also the third-gen- eration cephalosporin ceftibuten. Fourth-generation cephalospor- ins were not consumed in most northern EU/EEA countries, or Portugal, during the period 2009–2017.
1.5
1.0
Packages per 1000 inhabitants per day
0.5
0.0
Greece Italy France Slovakia
First-generation cephalosporins (J01DB) Third-generation cephalosporins (J01DD)
Second-generation cephalosporins (J01DC) Fourth-generation cephalosporins (J01DE)
Bulgaria Czechia
EU/EEA average Croatia Finland Ireland Austria Spain Lithuania Estonia Latvia Portugal Iceland Belgium Slovenia Sweden Denmark
Figure 2. Consumption of cephalosporins (ATC J01DB, J01DC, J01DD and J01DE combined) in the community, expressed in packages per 1000 inhab- itants per day, 20 EU/EEA countries, 2017. For Czechia, 2015 data are used. For Slovakia, 2016 data are used. For Cyprus and Romania, total care data, i.e. community and hospital sector combined, are used.
Downloaded from https://academic.oup.com/jac/article/76/Supplement_2/ii22/6328681 by University of Szeged user on 20 October 2021
Compositional data analysis, 2009–2017
The proportional consumption of both second- and third-gener- ation cephalosporins significantly increased over time relative to that of first- and fourth-generation cephalosporins. The propor- tional consumption of third-generation cephalosporins significant- ly increased relative to that of second-generation cephalosporins (Table3).
Trends of proportional consumption in individual countries are shown in Figure S4. When comparing the composition of the consumption of cephalosporins in 2017 with that in 2009, both increases and decreases were observed. For first-generation cephalosporins, changes were substantial, with increases >10%
reported for Iceland (!58.37%), Sweden (!21.94%) and Ireland (!13.37%), and decreases >10% reported for Bulgaria (#33.72%), Latvia (#29.89%), Lithuania (#28.57%), Croatia (#13.64%), and Estonia (#12.33%). In addition, increases >5% were reported for three countries (Austria, the Netherlands and Slovenia) while decreases >5% were reported for five countries [Czechia (2015 data), Denmark, Norway, Portugal and Romania (total care data;
coverage in 2009 limited to 30%–40%)]. The increase observed for the Netherlands was minimal in absolute value with consumption of first-generation cephalosporins consistently representing <0.01 DDD per 1000 inhabitants per day. Substantial decreases were observed due to the discontinuation of cefatrizine (J01DB07) in four countries and of cefradine (J01DB09) in nine countries. The changes in proportions of first-generation cephalosporins were matched by changes in proportions of either second-generation or third-generation cephalosporins. For second- and third-generation cephalosporins, decreases >5% were observed for 10 and 7 coun- tries, respectively, while increases >5% were observed for 11 and 8 countries, respectively. The largest changes in the proportional consumption of second-generation cephalosporins were observed for Lithuania (!34.20%) and Latvia (!30.01%), and for Iceland (#59.39%). The largest changes in the proportional consumption of third-generation cephalosporins were observed for Romania (!22.11%; total care data; coverage in 2009 limited to 30%–40%) and Malta (!15.91%), and for Austria (#27.91%). Changes in the proportional consumption of fourth-generation cephalosporins were minimal and never exceeded 1%.
Discussion
This study describes the consumption of cephalosporins in the community in the EU/EEA. The longitudinal data analysis showed no significant changes in the trend of cephalosporin consumption between 1997 and 2017. On the other hand, its seasonal variation decreased significantly over time. We also observed considerable variation in trends and composition over time at the country level.
Overall, the significantly increasing consumption of second- and third-generation cephalosporins went hand-in-hand with a pro- portional decrease of first-generation cephalosporins in most countries. These trends had already been observed for the period 1997–2009.4
The proportional consumption of cephalosporins (a subgroup of otherb-lactam antibacterials, ATC group J01D) out of all anti- bacterials for systemic use (J01) in 2017 ranged from 0.22%
in Denmark to 23.96% in Greece.5In 2017, consumption of cepha- losporins (J01D) in European countries that are not part of the Table2.Rankingofconsumptionofcephalosporins(ATCJ01DB,J01DC,J01DDandJ01DEcombined)inthecommunity,expressedinDDDorpackagesper1000inhabitantsperday,20EU/EEAcountries, 2017 CountryGreeceItalyFranceSlovakiaBulgariaCzechiaCroatiaFinlandIrelandAustriaSpainLithuaniaEstoniaLatviaPortugalIcelandBelgiumSloveniaSwedenDenmark Rankingfor packagesper 1000inhabitants perday
1234567891011121314151617181920 Rankingfor DDDper 1000inhabitants perday
1810236471511512131691714181920 Numberof DDDperpackage6.51.82.26.76.24.56.95.54.66.710.96.77.03.911.45.011.27.84.69.9 ForCzechia,2015dataareused.ForSlovakia,2016dataareused.ForCyprusandRomania,totalcaredata,i.e.communityandhospitalsectorcombined,areused.
Versportenet al.
Downloaded from https://academic.oup.com/jac/article/76/Supplement_2/ii22/6328681 by University of Szeged user on 20 October 2021
ESAC-Net but covered by the WHO Europe Antimicrobial Medicines Consumption (AMC) Network also showed considerable variation and ranged between 9.5% (Armenia) to 27.5% (Uzbekistan) of total, i.e. community and hospital sector combined, consumption of antibacterials for systemic use (J01).9
A remarkable gradient in cephalosporin consumption was observed in the EU/EEA, with a higher consumption and seasonal variation in southern and eastern countries than in northern coun- tries. However, while the countries with the highest cephalosporin consumption in the community, i.e. Greece and Cyprus (total care data), decreased their consumption, it nearly doubled in Bulgaria and Romania (total care data; coverage in 2009 limited to 30%–40%). In Malta, after a considerable increase up to 2009,
consumption of, mostly second-generation, cephalosporins has decreased since 2014. Furthermore, we observed a continuous decreasing trend of cephalosporin consumption in the community in several countries since 1997, in particular in Belgium, France and Italy. Denmark and the Netherlands remained the countries with the lowest cephalosporin consumption in the community.4,5
Since 1997, the consumption of first-generation cephalosporins in the community continued to decrease significantly, which could be explained by the decreased or discontinued consumption of cefadroxil, cefatrizine and cefradine, mainly in high cephalosporin consuming countries such as France, Greece, Luxembourg, and also in Portugal. The consumption of the older (first-generation) cephalosporins also continued to decrease in favour of the newer
5
4
3
DDD per 1000 inhabitants per day
2
1
0
1997 1998 1999 2000 2001 2002 2003 2004 2005 2006 2007 Time (1997-2017)
Change-point 1 Change-point 2
Estimated trend Linear trend
2008 2009 2010 2011 2012 2013 2014 2015 2016 2017
Parameters
Parameter
Estimate (std.
error)
2.154 (0.425)*
–0.003 (0.006)
0.009 (0.012)
0.003 (0.009)
–
0.616 (0.088)*
–0.004 (0.0005)*
0.351 (0.017)*
b0 b1 b2 b3 b4 bS0 bS1 d
Figure 3. Estimated trend (solid line) and linear trend (dashed line) of consumption of cephalosporins (ATC J01DB, J01DC, J01DD and J01DE) in the community based on quarterly data, 25 EU/EEA countries, 1997–2017.b0, predicted consumption in the first quarter of 1997;b1, predicted increase (if positive)/decrease (if negative) in consumption per quarter;b2, predicted difference in slope after versus before the first change-point;b3, predicted difference in slope after versus before the second change-point;b4, predicted difference in slope after versus before the third change-point;b0S, pre- dicted amplitude of the upward winter and downward summer peak in consumption;b1S, predicted increase (if positive)/decrease (if negative) of the amplitude of the upward winter and downward summer peak in consumption per quarter;d, shift in timing of the upward winter and downward summer peak from one year to another. An asterisk indicates the result is statistically significant at significance level 0.05.
Downloaded from https://academic.oup.com/jac/article/76/Supplement_2/ii22/6328681 by University of Szeged user on 20 October 2021
(second- and third-generation) cephalosporins in most countries.
In 2017, second-generation cephalosporins were consumed twice as much compared with 1997, which was due to the four-fold increase of cefuroxime consumption. Observed increases in the proportional consumption of second- and third-generation cephalosporins are not only due to the decrease in the consump- tion of first-generation cephalosporins, but also due to the increase of the more extended-spectrum cephalosporins. Half of the EU/EEA countries showed an increased consumption of third- generation cephalosporins during 1997–2017. Fourth-generation cephalosporins were consumed in 16 countries.
In a recently published study based on the ESAC-Net data from the period 2001–2018, a decreasing trend was observed for both in the community and hospital consumption of third- generation cephalosporins in the EU/EEA. During the same period, third-generation cephalosporin resistance percentages in invasiveEscherichia coliandKlebsiella pneumoniaeisolates seemed to be stabilizing, thus suggesting an effect of recent public health efforts in promoting prudent antimicrobial use in the EU/EEA.10
The highest proportions of parenterally administered cephalo- sporins (mainly ceftriaxone) in the community were observed for France, Greece, Italy and Latvia. In Italy, consumption of paren- teral ceftriaxone increased until 2013 and decreased steadily thereafter. Outpatient parenteral antimicrobial therapy (OPAT) is common in Italy.11
Although cephalosporins are also used for the treatment of urinary tract infections, and skin and soft tissue infections, the observed seasonal variation in cephalosporin consumption suggests that cephalosporins are mostly prescribed to treat seasonal respiratory infections, which are often viral in nature, and the prescriptions are therefore not following treatment guidelines.12,13 However, confirmation of this hypothesis would require information on the indication for cephalosporin prescriptions.
The substantial variations between countries and over time suggest that cephalosporins, in particular the more extended- spectrum cephalosporins such as third-generation cephalosporins, are to a large extent inappropriately used. In Bulgaria, a country with high consumption of third-generation cephalosporins in the
community, the percentage of invasive isolates with acquired non- susceptibility to third-generation cephalosporins reached 41.0% in E. coliand 75.9% inK. pneumoniaein 2016.10These resistance percentages are considerably higher than in countries such as Belgium, for which we observed a lower consumption of third-gen- eration cephalosporins.14
With the exception of six cephalosporins that represented
<0.05% of cephalosporin consumption in the EU/EEA, all second- and third-generation cephalosporins consumed in the EU/EEA are listed as Watch group antibiotics in the 2019 WHO Access, Watch or Reserve (AWaRe) classification list.15The Watch group includes antibiotics that have higher resistance potential than Access group antibiotics and includes most of the highest priority agents among the Critically Important Antimicrobials for Human Medicine.16In view of our observation that, in most EU/EEA countries, the absolute and proportional consumption of second- and third- generation cephalosporins significantly increased at the expense of the consumption of first-generation cephalosporins, all second- and third-generation cephalosporins should be prioritized as key targets of stewardship programmes and monitoring in these countries.
For a more-detailed discussion on the limitations of the collected data, we refer to the article on antibacterials for systemic use, included in this series.6For a discussion on the limitations of the statistical approach used in this study and potential explan- ations for the common change-points detected through these analyses, we refer readers to the tutorial included in this series.7
In conclusion, the longitudinal and compositional trends of cephalosporin consumption in the community in EU/EEA countries during 1997–2017 continued to follow the same patterns as al- ready reported for 1997–2009, namely a significant increase in consumption of the more extended-spectrum cephalosporins.
Further research is needed to better understand the observed trends and seasonal variations. These results from ESAC-Net may be used as a reference to gauge future interventions to optimize cephalosporin consumption in the community in EU/EEA countries.
Acknowledgements
We are grateful to the National Focal Points for Antimicrobial Consumption, Operational Contact Points for Epidemiology — Antimicrobial Consumption and Operational Contact Points for TESSy/IT data manager — Antimicrobial Consumption, that constitute the European Surveillance of Antimicrobial Consumption Network (ESAC- Net), for their engagement in collecting, validating and reporting anti- microbial consumption data to ECDC. In addition, we would like to thank Vera Vlahovic-Palcevski (consultant for ECDC) for her critical reading of the manuscript.
Members of the ESAC-Net study group
Reinhild Strauss (Austria), Eline Vandael (Belgium), Stefana Sabtcheva (Bulgaria), Marina Payerl-Pal (Croatia), Isavella Kyriakidou (Cyprus), Jirı´
Vlcek (Czechia), Ute Wolff So¨nksen (Denmark), Elviira Linask (Estonia), Emmi Sarvikivi (Finland), Karima Hider-Mlynarz (France), Katja Niepraschk-von Dollen (Germany), Flora Kontopidou (Greece), Ma´ria Matuz (Hungary), Gudrun Aspelund (Iceland), Karen Burns (Ireland), Filomena Fortinguerra (Italy), Elı¯na Dimin¸a (Latvia), Jolanta Kuklyt_e (Lithuania), Marcel Bruch (Luxembourg), Peter Zarb (Malta), Stephanie Natsch (the Netherlands), Hege Salvesen Blix (Norway), Anna Olczak- Pienkowska (Poland), Ana Silva (Portugal), Gabriel Adrian Popescu Table 3. Change in the composition of the consumption of cephalospor-
ins (ATC J01DB, J01DC, J01DD and J01DE) in the community, expressed in DDD (ATC/DDD index 2019) per 1000 inhabitants per day, 30 EU/EEA countries, as a function of time during 1997–2017
J01DB J01DC J01DD J01DE
J01DB #0.0702 #0.0995 #0.0139
J01DC 0.0702 #0.0293 0.0563
J01DD 0.0995 0.0293 0.0856
J01DE 0.0139 #0.0563 #0.0856
Values are estimated changes in the log ratio of the row versus column subgroup of antibiotics with increasing time. Bold type indicates a statis- tically significant effect; positive values represent an increase and nega- tive values represent a decrease. J01DB, first-generation cephalosporins;
J01DC, second-generation cephalosporins; J01DD, third-generation cephalosporins; J01DE, fourth-generation cephalosporins.
Versportenet al.
Downloaded from https://academic.oup.com/jac/article/76/Supplement_2/ii22/6328681 by University of Szeged user on 20 October 2021
(Romania), Toma´s Tesar (Slovakia), Milan Cizman (Slovenia), Antonio Lo´pez Navas (Spain), Vendela Bergfeldt (Sweden) and Berit Mu¨ller- Pebody (the United Kingdom).
Funding
R.B. is funded as a postdoctoral researcher by the Research Foundation—
Flanders (FWO 12I6319N). N.H. acknowledges support from the University of Antwerp scientific chair in Evidence-Based Vaccinology, financed in 2009–2020 by an unrestricted grant from Pfizer and in 2016–2019 from GSK. Support from the Methusalem finance programme of the Flemish Government is gratefully acknowledged.
Transparency declarations
The authors have none to declare. This article forms part of a Supplement.
Supplementary data
TablesS1andS2and FiguresS1toS4are available asSupplementary data atJACOnline.
References
1 European Centre for Disease Prevention and Control (ECDC). European Surveillance of Antimicrobial Consumption Network (ESAC-Net). https://www.
ecdc.europa.eu/en/about-us/partnerships-and-networks/disease-and-labora tory-networks/esac-net.
2 WHO Collaborating Centre for Drug Statistics Methodology. Guidelines for ATC classification and DDD assignment. https://www.whocc.no/atc_ddd_
index_and_guidelines/guidelines/.
3 Coenen S, Ferech M, Dvorakova K et al. European Surveillance of Antimicrobial Consumption (ESAC): outpatient cephalosporin use in Europe.J Antimicrob Chemother2006;58: 413–7.
4 Versporten A, Coenen S, Adriaenssens Net al.European Surveillance of Antimicrobial Consumption (ESAC): outpatient cephalosporin use in Europe (1997–2009. ).J Antimicrob Chemother2011;66Suppl 6: vi25–35.
5 Bruyndonckx R, Adriaenssens N, Versporten Aet al.Consumption of antibi- otics in the community, European Union/European Economic Area, 1997–
2017.J Antimicrob Chemother2021;76Suppl 2: ii7–ii13.
6 Bruyndonckx R, Adriaenssens N, , Versporten Aet al.Consumption of anti- biotics in the community, European Union/European Economic Area, 1997–
2017: data collection, management and analysis.J Antimicrob Chemother 2021;76Suppl 2: ii2–ii6.
7 Bruyndonckx R, Coenen S, Adriaenssens Net al.Analysing the trend over time of antibiotic consumption in the community: a tutorial on the detection of common change-points.J Antimicrob Chemother2021;76 Suppl 2: ii79–ii85.
8 Faes C, Molenberghs G, Hens Net al.Analysing the composition of out- patient antibiotic use: a tutorial on compositional data analysis.J Antimicrob Chemother2011;66Suppl 6: vi89–94.
9 WHO Regional Office for Europe. Antimicrobial Medicines Consumption (AMC) Network, AMC data 2011–2017 (2020). http://www.
euro.who.int/en/publications/abstracts/who-regional-office-for-europe- antimicrobial-medicines-consumption-amc-network.-amc-data-20112017- 2020.
10 Penalva G, Hogberg LD, Weist Ket al.Decreasing and stabilising trends of antimicrobial consumption and resistance inEscherichia coli andKlebsiella pneumoniaein segmented regression analysis, European Union/European Economic Area, 2001 to 2018.Euro Surveill2019;24:
pii=1900656.
11 Esposito S, Noviello S, Boccia Get al.Changing modalities of outpatient parenteral antimicrobial therapy use over time in Italy: a comparison of two time periods.Infez Med2016;24: 137–9.
12 Woodhead M. Prescribing and guidelines: both must improve to combat antimicrobial resistance.Eur Respir J2011;38: 9–11.
13 Woodhead M, Blasi F, Ewig Set al.Guidelines for the management of adult lower respiratory tract infections–full version.Clin Microbiol Infect2011;
17Suppl 6: E1–59.
14 Jarlier V, Diaz HL, Heuer OEet al.Strong correlation between the rates of intrinsically antibiotic-resistant species and the rates of acquired resistance in Gram-negative species causing bacteraemia, EU/EEA, 2016.Euro Surveill 2019;24: pii=1800538.
15 WHO. WHO 2019 AWaRe Classification Antibiotics release. https://www.
who.int/news/item/01-10-2019-who-releases-the-2019-aware-classifica tion-antibiotics.
16 World Health Organization. Critically important antimicrobials for human medicine, 6th rev. 2019. https://apps.who.int/iris/handle/
10665/312266.
Downloaded from https://academic.oup.com/jac/article/76/Supplement_2/ii22/6328681 by University of Szeged user on 20 October 2021