Consumption of macrolides, lincosamides and streptogramins in the community, European Union/European Economic Area, 1997–2017
Niels Adriaenssens1,2*†, Robin Bruyndonckx 1,3,†, Ann Versporten1, Niel Hens3,4, Dominique L. Monnet5, Geert Molenberghs3,6, Herman Goossens1, Klaus Weist5and Samuel Coenen 1,2on behalf of the ESAC-Net study
group‡
1Laboratory of Medical Microbiology, Vaccine & Infectious Disease Institute (VAXINFECTIO), University of Antwerp, Antwerp, Belgium;2Centre for General Practice, Department of Family Medicine & Population Health (FAMPOP), University of Antwerp, Antwerp,
Belgium;3Interuniversity Institute for Biostatistics and statistical Bioinformatics (I-BIOSTAT), Data Science Institute, Hasselt University, Hasselt, Belgium;4Centre for Health Economic Research and Modelling Infectious Diseases, Vaccine & Infectious Disease Institute (VAXINFECTIO), University of Antwerp, Antwerp, Belgium;5Disease Programmes Unit, European Centre for Disease
Prevention and Control, Stockholm, Sweden;6Interuniversity Institute for Biostatistics and statistical Bioinformatics (I-BIOSTAT), Catholic University of Leuven, Leuven, Belgium
*Corresponding author. E-mail: niels.adriaenssens@uantwerpen.be
†These authors contributed equally to this work.
‡Members are listed in the Acknowledgements section.
Objectives:Data on the consumption of macrolides, lincosamides and streptogramins (MLS) in the community were collected from 30 EU/European Economic Area (EEA) countries over two decades. This article reviews tem- poral trends, seasonal variation, presence of change-points and changes in composition of the main subgroups of MLS.
Methods: For the period 1997–2017, data on consumption of MLS, i.e. ATC group J01F, in the community and aggregated at the level of the active substance, were collected using the WHO ATC/DDD methodology (ATC/
DDD index 2019). Consumption was expressed in DDD per 1000 inhabitants per day and in packages per 1000 inhabitants per day. Consumption of MLS was analysed and presented as trends, seasonal variation, presence of change-points and compositional changes, using a classification based on mean plasma elimination half-life for macrolides.
Results: In 2017, consumption of MLS in the community expressed in DDD per 1000 inhabitants per day varied by a factor of 13 between countries with the highest (Greece) and the lowest (Sweden) consumption.
Consumption of MLS did not change significantly up to 2003, after which it significantly increased up to 2007.
No significant change was observed after 2007. Consumption of MLS showed high seasonal variation. The proportional consumption of long-acting macrolides significantly increased over time compared with that of intermediate-acting macrolides, and proportional consumption of the latter increased compared with that of short-acting macrolides.
Conclusions: Consumption of MLS did not change significantly over time during 2007–2017, while the propor- tional consumption of long-acting macrolides increased. Seasonal variation remained high, which suggests that MLS are still prescribed inappropriately in many countries.
Introduction
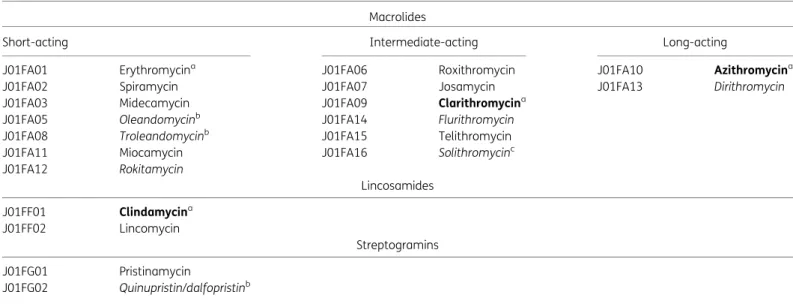
This article presents data from the European Surveillance of Antimicrobial Consumption Network (ESAC-Net,1 formerly ESAC) on community (i.e. primary care sector) consumption of macrolides, lincosamides and streptogramins (MLS) for 30 EU/European Economic Area (EEA) countries in 2017 (Table1).
It updates previous ESAC studies published in 2006 and 2011, and in doing so it provides updated comparable and reliable in- formation on antibiotic consumption that can aid in fighting the global problem of antimicrobial resistance.2,3In 2017, con- sumption of MLS represented 16.1% of antibiotic consumption in the community.4As in the previous series, a classification of
VC The Author(s) 2021. Published by Oxford University Press on behalf of the British Society for Antimicrobial Chemotherapy.
This is an Open Access article distributed under the terms of the Creative Commons Attribution License (http://creativecommons.org/licenses/
J Antimicrob Chemother2021;76Suppl 2: ii30–ii36 doi:10.1093/jac/dkab175
Downloaded from https://academic.oup.com/jac/article/76/Supplement_2/ii30/6328676 by 81728827 user on 20 October 2021
macrolides based on their mean plasma elimination half-life was adopted. The objective of this study was to analyse temporal trends, seasonal variation and the presence of change-points in consumption of MLS in the community for the period 1997–2017, as well as to analyse the composition of consumption of MLS over time.
Methods
The methods for collecting and analysing the data are described in the introductory article of this series.5In summary, data on consumption of MLS, i.e. ATC group J01F and aggregated at the level of the active sub- stance, were collected using the WHO ATC/DDD methodology (ATC/DDD index 20195) and expressed in DDD per 1000 inhabitants per day. In add- ition, where data were available, consumption of MLS was also expressed in packages per 1000 inhabitants per day. For macrolides, a classification according to the mean plasma elimination half-life, subdividing macrolides into short- (half-life <4 h), intermediate- (half-life from 4 to 24 h) and long-acting macrolides (half-life >24 h), was used to assess macrolide consumption in the community in more detail (Table1).
The evolution of the number of DDD per package over time was assessed using a linear mixed model. The temporal trend, seasonal vari- ation and presence of change-points in consumption of MLS were assessed using a non-linear change-point mixed model fitted to quarterly data expressed in DDD per 1000 inhabitants per day from 1997 to 2017.6 The relative proportions of the main subgroups were assessed through a compositional data analysis modelling yearly data expressed in DDD per 1000 inhabitants per day from 1997 to 2017.7
Results
An overview of consumption of MLS (ATC J01F) in the community, expressed in DDD and packages per 1000 inhabitants per day for
all participating countries between 1997 and 2017 is available as Supplementary dataatJACOnline (TablesS1 and S2, respectively).
Consumption of MLS in the community in 2017
In 2017, three substances accounted for 90% of the consumption of MLS in the community expressed in DDD per 1000 inhabitants per day: clarithromycin (45.8% in 2017 compared with 54.2%
in 2009), azithromycin (35.5% in 2017 compared with 23.3% in 2009) and clindamycin (10.3% in 2017 compared with 6.6% in 2009) (Table1).
Figure 1 shows the consumption of MLS in the community expressed in DDD per 1000 inhabitants per day for 30 EU/EEA countries in 2017. Consumption of MLS in the community varied by a factor of 13 between countries with the highest (6.98 DDD per 1000 inhabitants per day in Greece) and the lowest (0.54 DDD per 1000 inhabitants per day in Sweden) consumption, which was lower than in 2009 (factor of 18, from 11.54 DDD per 1000 inhabi- tants per day in Greece to 0.63 DDD per 1000 inhabitants per day in Sweden). Inter-country variations for macrolides (J01FA) were high for short-acting macrolides, intermediate-acting macrolides and long-acting macrolides. While lincosamide (J01FF; mainly clin- damycin) consumption was reported in all countries, streptogra- min (J01FG, pristinamycin) consumption in the community was only reported in France (TableS1).
In 2017, short-acting macrolides (mainly erythromycin) were the most consumed subgroup of MLS in Norway (>40% of con- sumption of MLS in the community), and accounted for >20% of consumption in the United Kingdom and >10% in Iceland and Sweden. Intermediate-acting macrolides (mainly clarithromycin, except Denmark mainly roxithromycin) were the most consumed Table 1. Classification of macrolides, lincosamides and streptogramins (J01F; ATC/DDD index 2019)
Macrolides
Short-acting Intermediate-acting Long-acting
J01FA01 Erythromycina J01FA06 Roxithromycin J01FA10 Azithromycina
J01FA02 Spiramycin J01FA07 Josamycin J01FA13 Dirithromycin
J01FA03 Midecamycin J01FA09 Clarithromycina
J01FA05 Oleandomycinb J01FA14 Flurithromycin
J01FA08 Troleandomycinb J01FA15 Telithromycin
J01FA11 Miocamycin J01FA16 Solithromycinc
J01FA12 Rokitamycin
Lincosamides
J01FF01 Clindamycina
J01FF02 Lincomycin
Streptogramins
J01FG01 Pristinamycin
J01FG02 Quinupristin/dalfopristinb
Bold typeindicates that consumption was part of the top 90% of the community consumption of macrolide, lincosamide and streptogramin (MLS) antibiotics (J01F) in 28 EU/EEA countries in 2017;Italic typeindicates that no consumption of this MLS antibiotic was reported in 28 EU/EEA countries in 2017.
aConsumption was part of the top 90% of the community consumption of MLS antibiotics (J01F) in 30 EU/EEA countries in 2009.
bNo consumption of this MLS antibiotic was reported in 30 EU/EEA countries in 2009.
cThis MLS antibiotic was not included in the ATC/DDD index in 2009 and was therefore not reported in 2009.
Downloaded from https://academic.oup.com/jac/article/76/Supplement_2/ii30/6328676 by 81728827 user on 20 October 2021
subgroup of MLS in Austria, Bulgaria, Cyprus (total care data, i.e.
community and hospital sector combined), Czechia, Denmark, Estonia, France, Germany, Greece, Ireland, Italy, Latvia, Lithuania, Malta, Portugal, Romania (total care data), Slovakia and the United Kingdom. Clarithromycin and roxithromycin consumption repre- sented >30% of consumption of MLS in Belgium, Croatia, Hungary, Poland and Slovenia. Long-acting macrolides were the most con- sumed subgroup of MLS in Belgium, Croatia, Finland, Hungary, Iceland, Luxembourg, the Netherlands, Poland, Slovenia and Spain. Compared with 2009, the proportional consumption of long-acting macrolides increased in most countries. Lincosamides were the most consumed MLS in Sweden and represented >20%
of the consumption of MLS in the community in Austria, Finland, Germany, Hungary and Luxembourg.
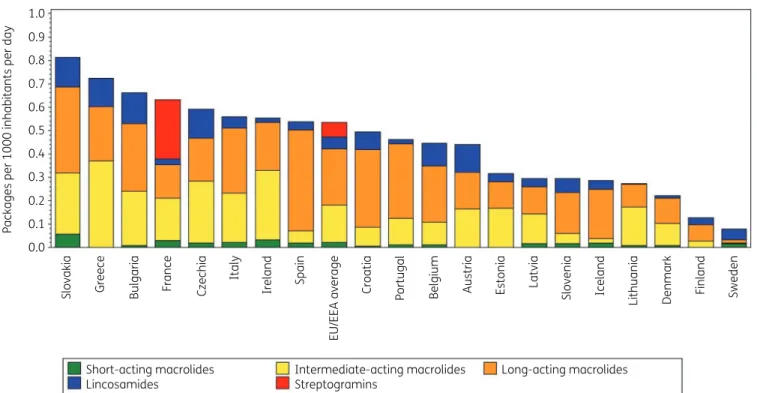
Figure 2 shows consumption of MLS in the community expressed in packages per 1000 inhabitants per day for 20 EU/EEA countries in 2017. France ranked 9th for its consumption of MLS in DDD per 1000 inhabitants per day and 4th in packages per 1000 inhabitants per day (Table2). The number of DDD per package ranged from 4.8 in France to 9.6 in Greece. In the EU/EEA countries, the number of DDD per package did not change significantly over time during 1997–2017.
Longitudinal data analysis, 1997–2017
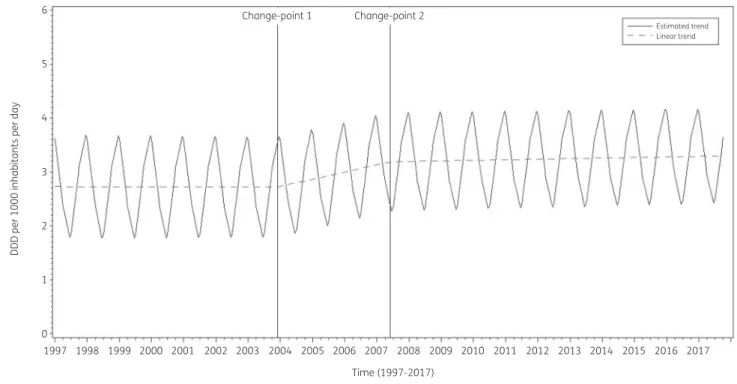
The best model fit was obtained for a model including two change-points: one in the last quarter of 2003 and another in the second quarter of 2007. The final model fits the observed data well (FigureS1). The longitudinal data analysis estimated an aver- age consumption of MLS in the EU/EEA of 2.73 (SE 0.39) DDD per
1000 inhabitants per day in the first quarter of 1997. Consumption of MLS did not change significantly (#0.0004, SE 0.006, DDD per 1000 inhabitants per day per quarter) between 1997 and the last quarter of 2003. After this first change-point, consumption of MLS significantly increased (!0.033, SE 0.015, DDD per 1000 inhabitants per day per quarter). After the second change point, consumption of MLS did not change significantly (!0.0028, SE 0.017, DDD per 1000 inhabitants per day per quarter; Figure3).
The longitudinal analysis showed significant seasonal variation with an amplitude of 0.98 (SE 0.21) DDD per 1000 inhabitants per day, which did not change significantly over time (#0.0006, SE 0.0006, DDD per 1000 inhabitants per day per quarter).
Based on the fitted model, consumption of MLS in 2017 was significantly higher than average in Austria, Belgium, Greece and Italy, and significantly lower than average in Croatia, Estonia, Finland, Iceland, Lithuania, the Netherlands, Poland and Sweden (observed profiles shown in FiguresS2andS3). The seasonal vari- ation was significantly larger than average in Greece, Italy and Slovakia and significantly smaller than average in Denmark, Finland, Iceland, the Netherlands, Sweden and the United Kingdom. The decrease in consumption of MLS between 1997 and the last quarter of 2003 was significantly larger than average in Austria, Belgium, Spain and the United Kingdom. The increase in consumption of MLS between 2004 and the second quarter of 2007 was significantly larger than average in Croatia, Estonia, Ireland, Slovakia and Lithuania.
TableS1provides an overview of the trends in consumption of MLS in the participating countries between 1997 and 2017.
Consumption of MLS decreased in most countries, in particular in Greece. Conversely, an increase in consumption of MLS was 8
6
4
DDD per 1000 inhabitants per day
2
0
Short-acting macrolides Intermediate-acting macrolides Long-acting macrolides Streptogramins
Lincosamides
Greece Luxembourg Malta Poland Ireland Czechia Italy Spain France EU/EEA average United Kingdom Cyprus Romania Austria Hungary Croatia Portugal Estonia Germany Lithuania Latvia Slovenia Denmark Iceland Norway Finland Sweden
Netherlands
Belgium
Bulgaria
Slovakia
Figure 1. Consumption of macrolides, lincosamides and streptogramins (ATC J01F) in the community, expressed in DDD (ATC/DDD index 2019) per 1000 inhabitants per day, 30 EU/EEA countries, 2017. For Czechia, 2015 data are used. For Slovakia, 2016 data are used. For Cyprus and Romania, total care data, i.e. community and hospital sector combined, are used.
Adriaenssenset al.
Downloaded from https://academic.oup.com/jac/article/76/Supplement_2/ii30/6328676 by 81728827 user on 20 October 2021
observed for Luxembourg, Spain and Latvia. The seasonal variation in consumption of MLS is shown in FiguresS2andS3. The mean consumption of MLS in the first and fourth quarters (winter) was
>50% higher than the mean consumption of MLS in the second and third quarters (summer) in Estonia, Italy and Latvia; >40% in Belgium, Croatia, and Portugal; and >30% in Germany and Luxembourg. Clarithromycin consumption was >50% higher in winter quarters than in summer quarters in Belgium, Croatia, Estonia, Finland, Hungary, Italy, Latvia and Luxembourg.
Azithromycin consumption was >50% higher in winter quarters than in summer quarters in Croatia, Estonia, Italy, Latvia, Luxembourg and Portugal.
Compositional data analysis, 1997–2009
The proportional consumption of long-acting macrolides and streptogramins significantly increased over time relative to that of short- and intermediate-acting macrolides and lincosamides. The proportional consumption of streptogramins did not change sig- nificantly relative to that of long-acting macrolides. The propor- tional consumption of intermediate-acting macrolides and lincosamides significantly increased relative to that of short-acting macrolides (Table3).
Trends of proportional consumption in individual countries are shown in FigureS4. When comparing the composition of macrolide consumption in 2017 with that in 2009, the proportion of short- acting macrolides decreased in all participating countries, mainly as the result of decreasing erythromycin consumption. The largest decreases were observed for the United Kingdom (#35.47%), Sweden (#28.01%), Romania (#26.08%; total care data; coverage
in 2009 limited to 30%–40%) and Denmark (#23.15%). The propor- tion of intermediate-acting macrolides decreased in most of the participating countries. Decreases >10% were observed for 13 out of 30 participating countries, with the largest decreases observed for Luxembourg (#28.84%), the Netherlands (#26.12%), Belgium (#24.07%), Hungary (#22.74%) and France (#20.40%). However, increases were also observed, with the largest increases being reported for the United Kingdom (!23.37%), Denmark (!9.80%) and Lithuania (!4.17%). The proportion of long-acting macrolides increased in all countries except Slovenia (#3.12%). Increases
>10% were observed for 17 out of 30 participating countries, with the largest increases observed for Latvia (!29.09%), Belgium (!25.64%), Iceland (!24.51%), the Netherlands (!24.46%), Hungary (!24.08%) and Luxembourg (!21.06%).
The proportion of lincosamides increased for most countries, with increases >10% being reported for Germany (!19.04%), Sweden (!15.71%), Finland (!13.20%) and Luxembourg (!11.90%). Streptogramins were only consumed in France, where their proportion increased (!8.00%).
Discussion
This study describes consumption of MLS in the community in the EU/EEA and found that the observed increasing trend of consump- tion of MLS up to 2009 in many countries continued afterwards.
However, in more than half of the countries we observed a lower consumption of MLS in DDD per 1000 inhabitants per day in 2017 than in 2009. Greece was still, in 2017, the EU/EEA country with the highest consumption of MLS. We did not observe any important shifts in the ranking of EU/EEA countries when using packages per 1.0
0.9 0.8 0.7 0.6 0.5
Packages per 1000 inhabitants per day
0.4 0.3 0.2 0.1 0.0
Slovakia Greece Bulgaria
Short-acting macrolides Intermediate-acting macrolides Long-acting macrolides Streptogramins
Lincosamides
France Czechia Italy Ireland Spain EU/EEA average Croatia Portugal Belgium Austria Estonia Latvia Slovenia Iceland Lithuania Denmark Finland Sweden
Figure 2. Consumption of macrolides, lincosamides and streptogramins (ATC J01F) in the community, expressed in packages per 1000 inhabitants per day, 20 EU/EEA countries, 2017. For Czechia, 2015 data are used. For Slovakia, 2016 data are used. For Cyprus and Romania, total care data, i.e.
community and hospital sector combined, are used.
Downloaded from https://academic.oup.com/jac/article/76/Supplement_2/ii30/6328676 by 81728827 user on 20 October 2021
1000 inhabitants per day instead of DDD per 1000 inhabitants per day as consumption metric.
In 2017, the consumption of MLS ranged from 4.77% in Sweden to 26.29% in Luxembourg.4In European countries that are not part of the ESAC-Net but covered by the WHO Europe Antimicrobial Medicines Consumption (AMC) Network, the inter- country variation was less pronounced, i.e. from 4.8% (Kyrgyzstan) to 15.9% (Russian Federation) of the total (i.e. community and hos- pital sector combined) consumption.8
Three substances, i.e. clarithromycin, azithromycin and clinda- mycin, represented more than 90% of the community consump- tion of MLS in the EU/EEA. For most EU/EEA countries, the proportional consumption of long-acting macrolides (i.e. azithro- mycin) increased at the expense of that of the other subgroups.
Only in Norway did the consumption of short-acting macrolides (i.e. erythromycin) remain predominant. In comparison with 2009,3spiramycin only represented <1% of the community con- sumption of MLS in 2017. Given that total macrolide consumption did not change significantly after 2007, this implies that consump- tion of one subgroup was merely replaced by consumption of an- other subgroup, rather than consumption being reduced overall.
Both azithromycin and clarithromycin use have been shown to increase the proportion of macrolide-resistant streptococci in healthy volunteers but, while this proportion was higher after azithromycin use than clarithromycin use, only clarithromycin use selected for theerm(B) gene that confers high-level macrolide re- sistance.9The observed increasing proportional consumption of azithromycin in the EU/EEA corresponds to that reported for the USA.10–12The current European guidelines for the management of community-acquired lower respiratory tract infections in adults recommend amoxicillin as first-line therapy with macrolides being reserved for patients with penicillin allergy and regions where macrolide resistance in pneumococcal isolates is low.13Yet, the seasonal variation in the consumption of MLS in the EU/EEA remained substantial compared with that of overall antibiotic con- sumption (ATC J01) and other main groups of antibiotics.4,14–17 While a minimal amount of seasonal variation could be associated with seasonality in bacterial pathogens, the extent of the observed seasonality suggests inappropriate prescribing during the winter in many countries.
In Belgium, maintaining macrolide consumption below a critic- al threshold was associated with both maintenance of a low prevalence of macrolide-resistant Streptococcus pyogenes and emergence of milder resistance mechanisms with lower fitness costs.18,19In addition, Megraudet al.20found a significant associ- ation between the use of specifically long-acting macrolides and clarithromycin resistance in Helicobacter pylori. A high rate of clarithromycin resistance no longer allows for its empirical use as standard regimen for the treatment ofH. pyloriinfections. Current antibiotic guidelines for the treatment ofH. pyloriinfections recom- mend bismuth quadruple therapy (A02BD08) in case of high macrolide resistance rates.
France is the only country using streptogramins (i.e. pristinamy- cin). Pristinamycin is included in guidelines for the treatment of sinusitis, exacerbation of chronic bronchitis, pneumonia and skin infections, mostly in case of penicillin allergy.21–23Linking antibiotic prescribing data with indications for these prescriptions would be helpful to achieve a better understanding of inter-country variations and trends in the consumption of MLS.
Table2.Rankingofconsumptionofmacrolides,lincosamidesandstreptogramins(ATCJ01F)inthecommunity,expressedinDDDsorpackagesper1000inhabitantsperday,20EU/EEAcountries,2017 CountrySlovakiaGreeceBulgariaFranceCzechiaItalyIrelandSpainCroatiaPortugalBelgiumAustriaEstoniaLatviaSloveniaIcelandLithuaniaDenmarkFinlandSweden Rankingfor packagesper 1000inhabitants perday 1234567891011121314151617181920 RankingforDDDper 1000inhabitants perday
2159463811127101315161814171920 NumberofDDD perpackage6.79.65.84.86.76.77.65.75.55.37.76.47.26.75.75.67.67.45.97.0 ForCzechia,2015dataareused.ForSlovakia,2016dataareused.ForCyprusandRomania,totalcaredata,i.e.communityandhospitalsectorcombined,areused.
Adriaenssenset al.
Downloaded from https://academic.oup.com/jac/article/76/Supplement_2/ii30/6328676 by 81728827 user on 20 October 2021
With the exception of clindamycin, all MLS (ATC J01F) are listed as Watch or Reserve group antibiotics in the 2019 WHO Access, Watch or Reserve (AWaRe) classification list.24The continuous monitoring of the consumption of MLS in the community can help to assess the impact of future interventions promoting better use of these antibiotics.
For a more-detailed discussion on the limitations of the col- lected data, we refer to the article on antibacterials for systemic use, included in this series.5For a discussion on the limitations of the statistical approach used in this study and potential explana- tions for the common change-points detected through these analyses, we refer to the tutorial included in this series.6
In conclusion, the increase in the consumption of MLS in the EU/
EEA ended in 2007, after which consumption of MLS remained sta- ble. The proportional consumption of long-acting macrolides, i.e.
azithromycin, increased over time during 1997–2017. Seasonal variation remained high, which suggests that MLS are still prescribed inappropriately in the community in many countries.
6 Change-point 1 Change-point 2
Estimated trend Linear trend
5
DDD per 1000 inhabitants per day
4
3
2
1
0
1997 1998 1999 2000 2001 2002 2003 2004 2005 2006 2007 Time (1997-2017)
2008 2009 2010 2011 2012 2013 2014 2015 2016 2017
Parameter b0 b1 b2 b3 b4 bS0 bS1 d
Estimate (std. error)
2.730 (0.388)*
–0.0004 (0.006)
0.034 (0.015)*
–0.031 (0.014)*
–
0.975 (0.205)*
–0.001 (0.001)
0.385 (0.014)*
Figure 3. Estimated trend (solid line) and linear trend (dashed line) of consumption of macrolides, lincosamides and streptogramins (ATC J01F) in the community based on quarterly data, 25 EU/EEA countries, 1997–2017.b0, predicted consumption in the first quarter of 1997;b1, predicted in- crease (if positive)/decrease (if negative) in consumption per quarter;b2, predicted difference in slope after versus before the first change-point;b3, predicted difference in slope after versus before the second change-point;b4, predicted difference in slope after versus before the third change-point;
b0S, predicted amplitude of the upward winter and downward summer peak in consumption;b1S, predicted increase (if positive)/decrease (if negative) of the amplitude of the upward winter and downward summer peak in consumption per quarter;d, shift in timing of the upward winter and down- ward summer peak from one year to another. An asterisk indicates that the result was statistically significant at significance level 0.05.
Table 3. Change in composition of the consumption of macrolides, linco- samides and streptogramins (ATC J01F) in the community, expressed in DDD (ATC/DDD index 2019) per 1000 inhabitants per day, 30 EU/EEA countries, as a function of time during 1997–2017
SAM IAM LAM J01FF J01FG
SAM #0.1276 #0.1895 #0.1824 #0.2271
IAM 0.1276 #0.0619 #0.0549 #0.0995
LAM 0.1895 0.0619 0.0071 #0.0376
J01FF 0.1824 0.0549 #0.0071 #0.0447
J01FG 0.2271 0.0995 0.0376 0.0447
Values are estimated changes in the log ratio of the row versus column subgroup of antibiotics with increasing time. Bold type indicates a statis- tically significant effect; positive values represent an increase and nega- tive values represent a decrease.
SAM, short-acting macrolides; IAM, intermediate-acting macrolides; LAM, long-acting macrolides; J01FF, lincosamides; J01FG, streptogramins.
Downloaded from https://academic.oup.com/jac/article/76/Supplement_2/ii30/6328676 by 81728827 user on 20 October 2021
Acknowledgements
We are grateful to the National Focal Points for Antimicrobial Consumption, Operational Contact Points for Epidemiology — Antimicrobial Consumption and Operational Contact Points for TESSy/IT data manager — Antimicrobial Consumption, that constitute the European Surveillance of Antimicrobial Consumption Network (ESAC-Net), for their engagement in collecting, vali- dating and reporting antimicrobial consumption data to ECDC. In addition, we would like to thank Vera Vlahovic-Palcevski (consultant for ECDC) for her critical reading of the manuscript.
Members of the ESAC-Net study group
Reinhild Strauss (Austria), Eline Vandael (Belgium), Stefana Sabtcheva (Bulgaria), Arjana Tambic Andrasevic (Croatia), Isavella Kyriakidou (Cyprus), Jirı´ Vlcek (Czechia), Ute Wolff So¨nksen (Denmark), Elviira Linask (Estonia), Emmi Sarvikivi (Finland), Karima Hider-Mlynarz (France), Muna Abu Sin (Germany), Flora Kontopidou (Greece), Ria Benk}o (Hungary), Gudrun Aspelund (Iceland), Ajay Oza (Ireland), Filomena Fortinguerra (Italy), Ieva Rutkovska (Latvia), Rolanda Valint_elien_e (Lithuania), Marcel Bruch (Luxembourg), Peter Zarb (Malta), Stephanie Natsch (the Netherlands), Hege Salvesen Blix (Norway), Anna Olczak-Pienkowska (Poland), Ana Silva (Portugal), Gabriel Adrian Popescu (Romania), Toma´s Tesar (Slovakia), Milan Cizman (Slovenia), Mayte Alonso Herreras (Spain), Vendela Bergfeldt (Sweden) and Berit Mu¨ller-Pebody (the United Kingdom).
Funding
R.B. is funded as a postdoctoral researcher by the Research Foundation—
Flanders (FWO 12I6319N). N.H. acknowledges support from the University of Antwerp scientific chair in Evidence-Based Vaccinology, financed in 2009–2020 by an unrestricted grant from Pfizer and in 2016–2019 from GSK. Support from the Methusalem finance programme of the Flemish Government is gratefully acknowledged.
Transparency declarations
The authors have none to declare. This article is part of a Supplement.
Supplementary data
TablesS1 and S2and FiguresS1 to S4are available asSupplementary data atJACOnline.
References
1 European Centre for Disease Prevention and Control (ECDC). European Surveillance of Antimicrobial Consumption Network (ESAC-Net).Stockholm.
2020. https://www.ecdc.europa.eu/en/about-us/partnerships-and-networks/
disease-and-laboratory-networks/esac-net.
2 Coenen S, Ferech M, Malhotra-Kumar Set al.European Surveillance of Antimicrobial Consumption (ESAC): outpatient macrolide, lincosamide and streptogramin (MLS) use in Europe.J Antimicrob Chemother2006;58:
418–22.
3 Adriaenssens N, Coenen S, Versporten Aet al.European Surveillance of Antimicrobial Consumption (ESAC): outpatient macrolide, lincosamide and streptogramin (MLS) use in Europe (1997–2009).J Antimicrob Chemother 2011;66: vi37–45.
4 Bruyndonckx R, Adriaenssens N, Versporten Aet al.Consumption of antibi- otics in the community, European Union/European Economic Area, 1997–
2017.J Antimicrob Chemother2021;76Suppl 2: ii7–ii13.
5 Bruyndonckx R, Adriaenssens N, Versporten Aet al.Consumption of antibi- otics in the community, European Union/European Economic Area, 1997–
2017: data collection, management and analysis.J Antimicrob Chemother 2021;76Suppl 2: ii2–ii6.
6 Bruyndonckx R, Coenen S, Adriaenssens Net al.Analysing the trend over time of antibiotic consumption in the community: a tutorial on the detection of common change-points. J Antimicrob Chemother 2021; 76 Suppl 2:
ii79–ii85.
7 Faes C, Molenberghs G, Hens Net al.Analysing the composition of out- patient antibiotic use: a tutorial on compositional data analysis.J Antimicrob Chemother2011;66Suppl 6: vi89–94.
8 WHO Regional Office for Europe Antimicrobial Medicines Consumption (AMC) Network. AMC data 2011–2017. 2020.
9 Malhotra-Kumar S, Lammens C, Coenen Set al.Effect of azithromycin and clarithromycin therapy on pharyngeal carriage of macrolide-resistant strep- tococci in healthy volunteers: a randomised, double-blind, placebo-controlled study.Lancet2007;369: 482–90.
10 Hicks LA, Bartoces MG, Roberts RMet al.US outpatient antibiotic prescrib- ing variation according to geography, patient population, and provider spe- cialty in 2011.Clin Infect Dis2015;60: 1308–16.
11 Centers for Disease Control and Prevention. Antibiotic prescribing and use in the US, 2017. https://www.cdc.gov/antibiotic-use/stewardship-report/
index.html.
12 Goossens H, Ferech M, Coenen Set al.Comparison of outpatient systemic antibiotic use in 2004 between the United States and 27 European countries.
Clin Infect Dis2007;44: 1091–5.
13 Woodhead M, Blasi F, Ewig Set al.Guidelines for the management of adult lower respiratory tract infections - full version.Clin Microbiol Infect2011;
17: E1–59.
14 Bruyndonckx R, Adriaenssens N, Hens Net al.Consumption of penicillins in the community, European Union/European Economic Area, 1997–2017.J Antimicrob Chemother2021;76Suppl 2: ii14–ii21.
15 Versporten A, Bruyndonckx R, Adriaenssens Net al.Consumption of ceph- alosporins in the community, European Union/European Economic Area, 1997–2017.J Antimicrob Chemother2021;76Suppl 2: ii22–ii29.
16 Versporten A, Bruyndonckx R, Adriaenssens Net al.Consumption of tetra- cyclines, sulphonamides and trimethoprim, and other antibacterials in the community, European Union/European Economic Area, 1997–2017. J Antimicrob Chemother2021;76Suppl 2: ii45–ii59.
17 Adriaenssens N, Bruyndonckx R, Versporten Aet al.Consumption of qui- nolones in the community, European Union/European Economic Area, 1997–
2017.J Antimicrob Chemother2021;76Suppl 2: ii37–ii44.
18 Van Heirstraeten L, Coenen S, Lammens Cet al.Antimicrobial drug use and macrolide-resistantStreptococcus pyogenes, Belgium.Emerg Infect Dis 2012;18: 1515–8.
19 Malhotra-Kumar S, Mazzariol A, Van Heirstraeten Let al.Unusual resist- ance patterns in macrolide-resistant Streptococcus pyogenesharbouring erm(A).J Antimicrob Chemother2008;63: 42–6.
20 Megraud F, Coenen S, Versporten Aet al. Helicobacter pyloriresistance to antibiotics in Europe and its relationship to antibiotic consumption.Gut2013;
62: 34–42.
21 VIDAL FRANCE. https://www.vidal.fr/Medicament/pyostacine-14052-indi cations.htm.
22 ANTIBIOCLIC. https://antibioclic.com/strategie/83/596.
23 Klotz C, Courjon J, Michelangeli Cet al.Adherence to antibiotic guidelines for erysipelas or cellulitis is associated with a favorable outcome.Eur J Clin Microbiol Infect Dis2019;38: 703–9.
24 WHO. AWaRe Classification antibiotics. https://www.who.int/news/item/
01-10-2019-who-releases-the-2019-aware-classification-antibiotics.
Adriaenssenset al.
Downloaded from https://academic.oup.com/jac/article/76/Supplement_2/ii30/6328676 by 81728827 user on 20 October 2021