The effect of primary care availability on antibiotic consumption in Hungary:
a population based panel study using unfilled general practices
Aniko Biro,1 Peter Elek1,2
To cite: Biro A, Elek P. The effect of primary care availability on antibiotic consumption in Hungary: a population based panel study using unfilled general practices. BMJ Open 2019;9:e028233. doi:10.1136/
bmjopen-2018-028233
►Prepublication history and additional material for this paper are available online. To view these files, please visit the journal online (http:// dx. doi.
org/ 10. 1136/ bmjopen- 2018- 028233).
Received 28 November 2018 Revised 31 July 2019 Accepted 14 August 2019
1Institute of Economics at the Centre for Economic and Regional Studies of the Hungarian Academy of Sciences, Budapest, Hungary
2Eötvös Loránd University, Budapest, Hungary Correspondence to Dr Aniko Biro;
Biro. Aniko@ krtk. mta. hu
© Author(s) (or their employer(s)) 2019. Re-use permitted under CC BY-NC. No commercial re-use. See rights and permissions. Published by BMJ.
Strengths and limitations of this study
► To estimate the effects of access to primary care on the consumption of antibiotics, we use geographi- cal and time variation in unfilled general practices in Hungary.
► Our results are based on administrative records of antibiotic use of the entire population of Hungary liv- ing in villages between years 2010 to 2015.
► We analyse the quantity and quality of antibiotic consumption, by separating the narrow-spectrum versus broad-spectrum as well as the Access versus Watch-Reserve antibiotic prescriptions according to the AWaRe classification.
► The external validity of the findings is restricted to healthcare systems with mostly single-handed gen- eral practices, which serve as the first point of con- tact to the system.
AbStrACt
Objective We analyse the effect of primary care availability on antibiotic consumption and on the quality of antibiotic prescribing behaviour.
Design Retrospective panel design, secondary analysis of settlement-level administrative panel data (n=2320 settlements, T=72 months).
Participants and setting We analyse antibiotic consumption of the population of villages in Hungary, over years 2010 to 2015. We exploit the geographical and time variation in unfilled (mainly single-handed) general practices as a source of exogenous variation in the availability of primary care. We control for socioeconomic characteristics and settlement fixed effects in a panel regression framework.
Outcome measures Antibiotic expenditures and days of therapy (DOT); consumption of narrow-spectrum and broad-spectrum antibiotics; consumption of Access, Watch and Reserve antibiotics according to the AWaRe categorisation; number of visits to the general practitioner (GP).
results If the general practice of a village becomes unfilled, the number of GP visits decreases on average by 9.3% (95% CI 5.6% to 12.9%), antibiotics DOT decrease on average by 3.2% (95% CI 1.0% to 5.4%) and expenditures on antibiotics decrease on average by 2.5% (95% CI 0.3% to 4.7%). The negative effect on antibiotic consumption is stronger in settlements where secondary care is less available, and where antibiotics were previously overprescribed. The quality of prescribing behaviour measured by the relative changes in the narrow-spectrum vs broad-spectrum as well as the Access versus Watch and Reserve antibiotics deteriorates significantly as a consequence of worse primary care availability.
Conclusions Limited availability of primary care reduces the consumption of antibiotics and at the same time impairs the quality of prescriptions through a decrease of the number of doctor-patient encounters.
IntrODuCtIOn
‘Antibiotic resistance is one of the most signif- icant threats to patients’ safety in Europe.
It is driven by overusing antibiotics and prescribing them inappropriately.’1 Global consumption of antibiotic drugs increased
by 35% between 2000 and 2010.2 Antibiotics can be life-saving, however, overuse of them can increase the susceptibility to infections and disease.3 The WHO identifies antimicro- bial resistance as one of the top 10 threats to global health in 2019.4
We analyse the effect of primary care avail- ability on antibiotic consumption and on the quality of antibiotic prescribing behaviour.
In European countries, with the exception of Turkey, the average age of general prac- titioners (GPs) is between 45 and 55 years5 so lack of supply in primary care is either already a problem, or will be a problem in the near future, in many places. For instance, in Britain, around 10% of GP positions were unfilled in 2015, and the situation is wors- ening daily.6
Little is known about the relationship between primary care availability and antibi- otic consumption. Limited access to primary care is likely to lead to fewer consultations, hence lower access to prescriptions. However, it can also have opposite effects since if GPs spend more time with their patients then the
on September 15, 2019 by guest. Protected by copyright.http://bmjopen.bmj.com/
prescription of antibiotics can be reduced.7 Results from Switzerland and also from 17 European countries show that the density of physicians is positively related to outpa- tient antibiotic consumption.8 9 Based on regional data from Hungary, a previous study did not find evidence for a relationship between antibiotic use and the density of pharmacies or the number of enrolled patients per GP.10 In this paper, we use more detailed longitudinal adminis- trative data from a later period from Hungary and exploit the process of general practices becoming unfilled as a natural experiment to analyse the question and reach different conclusions.
Institutional background in Hungary
The following summary of primary care in Hungary is based on Gaál et al, 2011, Wilm et al, 2015.11 12 In Hungary, the municipalities are responsible for the provision of primary care. The majority of primary care services are provided by general practitioners (family physicians or family paedi- atricians). Local governments designate primary care districts to the GPs, who are not allowed to refuse patients from their district. On the other hand, patients have the right to choose their GP. The overwhelming majority of GPs work in single-handed practices, group practices are very rare.12 To work in a primary care district with a terri- torial supply obligation, family doctors must purchase a licence. Thus practices can be bought and sold, while local governments still keep a control over who serves as a GP. GP care is provided for free, and at least in principle, GPs act as gatekeepers. However, several specialist care services can be accessed without the referral of a GP (eg, dermatology, ear, nose and throat diseases, gynaecology, traumatology). GPs’ financing is mostly based on capita- tion, with some supplements depending for example on the age composition of the patients and the type of settle- ments covered. In 2015, there were 6277 practising GPs in Hungary, the average number of patients per GP was 1566. Meanwhile, there are 3155 settlements in Hungary, and the total population is 9.8 million.13
A severe problem of the Hungarian primary care system is that around 5% of the – overwhelmingly single-handed – GP practices are unfilled. The high ratio of unfilled GP positions in Hungary is despite the fact that the govern- ment offers financial subsidies if a GP takes up a practice that has been unfilled for at least 6 months. The unfilled practices are mostly located in remote, less developed areas of the country. If a practice becomes unfilled it will be partly covered by the GPs of neighbouring primary care districts. Hence, on the one hand, deputy GPs in the remote areas have to travel a lot, so as to provide some care at the unfilled practices. On the other hand, patients in unfilled districts cannot access a GP locally every day of the week. If they need to see a GP when the deputy GP is not around, they have to travel to another district (typi- cally to another settlement).
Consumption of antibiotics in Hungary
Hungary had the ninth lowest per capita consumption of antibiotics for systemic use out of 30 European Union
(EU)/European Economic Area (EEA) countries in 2016 (the defined daily dose (DDD) per 1000 inhabitant-days was 15.4 in Hungary, 21.9 in the EU/EEA).14 However, quality indicators of antibiotic prescribing behaviour do not show such a bright picture. For instance Juhasz et al,15 report some inappropriateness of antibiotic treat- ment in acute cystitis and Marton et al16 already showed alarming evidence of high incidence of antibiotic resis- tance in Hungary almost three decades ago. Regarding the quality indicators in international comparison, the ratio of broad-spectrum to narrow-spectrum antibotics in community consumption is the second largest in the EU/
EEA17 (Broad-spectrum antibiotics are known to have a high potential to cause antimicrobial resistance.18 19). Out of 12 quality indicators such as the seasonal variation of antibiotic prescriptions or the use of certain broad-spec- trum antibiotics, Hungary is in the worst quartile of EU/
EEA countries in five cases, in the second worst quartile in four cases and in the better half in only three cases.20
Furthermore, the recent WHO Essential Medicines List21 classifies antibiotics into Access, Watch, Reserve and Other categories to ensure appropriate prescribing behaviour (AWaRe classification). In Hungary, compared with the median value in the European region, a smaller share of antibiotic consumption belongs to the Access group (48% vs 56%) and a larger share to the Watch group (38% vs 29%) as well as to the Reserve group (0.5%
vs 0.2%), putting the country into the worst quartile in terms of these quality measures as well.18 Responding to these results, the prescription rate of antibiotics has become part of the primary care performance indicator system in Hungary since 2011.22
MetHODS Data
We combine three data sources to create settlement-level monthly administrative panel data (n=2320 settlements, T=72 months over years 2010 to 2015).
General practices
We obtained the list of filled and unfilled general practices from the National Health Insurance Fund Administration (NHIFA) for the time between 2004 to 2017. (These data were provided to us by the NHIFA free of charge in the framework of secondary use of public data.) We know the zip code of the site of the practice, the list of settlements the practice caters for and the start and end date (month) of the practice having been unfilled. In those settlements where there is only one general practice, we exactly know whether it is unfilled or not in a given month. However, our information is less precise in settlements (mainly towns and cities) where more than one general practice is available. We know if some of them are unfilled, but cannot identify the exact part of the settlement that is not covered by GP care. To alleviate the consequences of this data limitation, we focus our analysis on villages, of which 77% are covered by only one general practice.
on September 15, 2019 by guest. Protected by copyright.http://bmjopen.bmj.com/
Meanwhile, the lack of GP care availability is typically an issue in villages: although only 30% of the population live there, 81% of unfilled general practices are located there.
Our main explanatory variable on the settlement level is the ratio of the unfilled practices relative to the total number of practices (filled plus unfilled) covering the given settlement. If a village is covered by one unfilled practice then the ratio of unfilled practices equals one there. (Most of the villages (72.5%) are covered by prac- tices that cater for adults and children as well; 18.3% of the practices covering villages cater for adults only and 9.2% for children only).
Settlement-level demographic, socioeconomic and GP care data We also use the T-STAR municipal statistical system of the Central Statistical Office of Hungary. This contains wide- range annual settlement-level demographic data (such as the gender and age composition of the population) and socioeconomic data (such as the unemployment rate).
Furthermore, the database contains, by settlement, the annual number of visits to all GPs based in the given settlement. Thus if a general practice caters for several settlements then all the visits are attached to the basis settlement. Due to this limitation, we take the following steps to generate the database of the number of GP visits.
First, using the register of general practices, for each settlement we identify the settlement that provides the GP care (this is important for small villages, which do not host a health centre). Second, we calculate the popu- lation of the catchment area of the general practices of a given settlement, using the population statistics from T-STAR. Finally, we divide the number of GP visits with the estimated population to construct the per capita indi- cator on the catchment area level.
Consumption of antibiotics
Data on the use of antibiotics, covering the entire popu- lation of Hungary, come from the National Healthcare Services Centre (NHSC) through an agreement between the NHSC and the Institute of Economics, Centre for Economic and Regional Studies of the Hungarian Academy of Sciences. They contain information on phar- maceuticals in the Anatomical Therapeutic Chemical (ATC) group ‘J01’ (antibiotics with systemic use) that were purchased through pharmacies, hence only relate to the ambulatory setting and exclude hospital care. Only prescription drugs are recorded (over-the-counter sales are excluded) but this is not a limitation because of the prescription-only status of antibiotics in Hungary (Some non-prescription sales do occur but they constitute only around 2% of all sales.23). Our data cover prescriptions both in primary care and specialist outpatient care, hence we measure the overall effect on the use of antibiotics.
The NHSC data set covers years 2010 to 2015. It provides information on the name, identifier code and detailed ATC code of the antibiotic medication, the date of the purchase, the amount purchased and the associated expenditure (the sum of social security and out-of-pocket
payments). It also includes the zip code of the patient’s address, the patient’s year of birth and gender and the International Statistical Classification of Diseases code of the diagnosis for which the prescription was given. Using the zip codes, we construct monthly indicators of anti- biotic use (days of therapy (DOT) and expenditure of all antibiotics as well as of various subcategories) on the settlement level.
We define various subcategories so as to analyse the quality of antibiotic prescription. First, following Cormican et al,17 we distinguish the consumption of narrow-spectrum penicillins, cephalosporins, macro- lides (ATC codes J01(CA+CE+CF+DB+FA01)) and of broad-spectrum penicillins, cephalosporins, macrolides and fluoroquinolones (J01(CR+DC+DD+(F-FA01)+MA)).
Then, we define a quality index as the ratio of the consumption of the narrow-spectrum and the broad-spec- trum categories. (This is the reciprocal of the index used by Juhasz et al.15 Since there are a lot of zero values in the consumption of narrow-spectrum antibiotics on the settlement-month level, the original index is not defined in many cases, hence we use its reciprocal). To lower the risk of antibiotic resistance, a higher value of this quality indicator is desirable.
Second, we use the AWaRe (Access – Watch – Reserve) classification of the list of essential medicines21 to assess the quality of consumption. The Access category includes first and second choice antibiotics that should be widely available in healthcare settings, while antibiotics in the Watch and Reserve categories have a higher potential for resistance to develop and their use as first and second choice treatment should be limited.18 Since the Reserve category comprises only a small fraction (0.5%) of antibi- otic consumption in Hungary, we analyse the consump- tion of Watch and Reserve categories jointly.
Finally, to generate descriptive statistics and to relate the consumption of antibiotics to total pharmaceutical consumption, we also use publicly available county-level statistics on pharmaceutical sales from the NHIFA.
(Since they come from the same administrative sources, the NHSC and NHIFA antibiotic consumption data are very similar both in their levels and in their county-level variation (the correlation is above 0.95)).24 Similarly to the NHSC data above, only prescribed pharmaceutical purchases in public pharmacies are included in these statistics.
Statistical analysis
Regressions for the quantity and quality of antibiotic consumption In our baseline analysis, we estimate the effect of unfilled general practices on antibiotic consumption using the settlement-month panel of antibiotic DOT and expendi- tures, which was created from the NHSC data. We restrict the analysis to villages and estimate the following panel model:
antibioticss,t=γ0+γuunfilleds,t+γdDtdate+γhhs,t+νs+εs,t (1)
on September 15, 2019 by guest. Protected by copyright.http://bmjopen.bmj.com/
Table 1 Average antibiotic days of therapy per 1000 inhabitant-days by gender and age
Age group
Males Females
Mean SE Median Mean SE Median 0–5 18.43 0.03 16.64 17.10 0.03 15.18 6–17 17.25 0.03 14.75 17.79 0.03 15.50 18–39 10.41 0.01 9.78 15.39 0.02 14.85 40–59 9.12 0.01 8.75 13.83 0.02 13.47 60– 13.91 0.02 13.35 13.54 0.02 13.19 Total 11.97 0.01 10.68 14.77 0.01 14.03 Statistics weighted by the size of each settlement-gender-age group. SE is the standard error of the mean. NHSC data, years 2010 to 2015.
where s indicates settlements and t the time measured in months. In various model specifications the outcome variables (antibioticss,t) are the level and logarithm of antibiotic DOT per 1000 inhabitant-days as well as the logarithm of social security expenditures per 1000 inhab- itants. (The monthly settlement-level DOT or expendi- tures are zero only for a tiny fraction of observations, hence the logarithms are missing only in very few cases).
Also, as quality indicators, we examine the DOT of the subcategories (narrow-spectrum, broad-spectrum, Access and Watch-Reserve) as well as the quality index (ratio of narrow-spectrum and broad-spectrum antibiotics) defined above.
Our main explanatory variable is the ratio of unfilled general practices among all practices covering settle- ment s in month t (unfilleds,t). Further explanatory vari- ables include time fixed effects (Dtdate) to control for time trends and various settlement-level indicators (hs,t) from the T-STAR database to control for health needs and healthcare supply. In particular, we proxy health needs, that is, the demand-side determinants of antibiotic consumption, with the age-gender distribution and the socioeconomic characteristics of the settlement (ratio of females, ratio of residents aged 0 to 17 years and aged 60+
years, local unemployment rate, prescription exemption rate). According to table 1, the use of antibiotics differs by gender and age, hence the age-gender distribution can partly capture the settlement-specific demand for anti- biotics. Socioeconomic characteristics are expected to affect the demand via income and health effects. Finally, we measure the supply of healthcare beyond primary care with the local (micro-regional) specialist outpatient capacities (annual specialist outpatient hours per 1000 inhabitants).
We also include settlement-level fixed effects in equa- tion (1), (vs), which capture all time-invariant charac- teristics of the settlements (such as region, distance to the nearest town or location of the GP practice). Hence
this estimation method yields unbiased estimates for the parameters even if we allow that settlements with unfilled and filled practices may systematically differ from each other across time-invariant dimensions that we cannot measure (Wooldridge, 2010; section Fixed Effects Methods).25 In other words, the inclusion of settlement fixed effects allows us to identify the impact of primary care availability on antibiotic consumption from the with- in-settlement time variation of filled/unfilled status, not just from the cross-sectional geographical variation.
The dependent variables in equation (1) are calculated on per capita basis and hence the models are inherently heteroscedastic, with larger variances observed in smaller settlements (as also shown in online supplementary figure A1 in appendix A1). Hence we estimate the equation with weighted fixed effects least squares, using the (time-aver- aged) population of the settlements as weights. According to online supplementary figure A2 in appendix A1, the weighted residuals are much closer to homoscedasticity.
We cluster SEs on the micro-regional level to take into account potential interdependencies of shocks in the local healthcare systems (in line with Cameron et al26; the clustering formula is provided by Cameron and Trivedi, 200927 (section Cluster-robust standard errors)).
For the sake of comparison, we re-estimate equation (1) with a random effects specification for vs as well.
This specification assumes that the settlement-level time-invariant unobserved factors are uncorrelated with the explanatory variables(Wooldridge, 2010;25 section Random Effects Methods). We choose between the fixed effects and the random effects specifications with a Haus- man-type test (Wooldridge, 2010;25 section The Hausman Test Comparing the RE and FE Estimators), imple- mented with the xtoverid function28 of the Stata statistical software.29 All other calculations are performed in Stata as well.
Heterogeneity analyses
We also investigate effect heterogeneities. First, we extend equation (1) and interact the ratio of unfilled general practices (unfilleds,t) with the micro-regional specialist outpatient hours per 1000 inhabitants (popu- lation-weighted mean=1.22, SD=0.80), with the binary indicator of the presence of a pharmacy in the settlement (weighted proportion=0.775) and, to capture the socio- economic conditions, with settlement-level unemploy- ment rate (weighted mean=0.105, SD=0.071) and with the prescription exemption rate (weighted mean=0.039, SD=0.025).
Second, we analyse effect heterogeneities according to the initial consumption level of antibiotics. Our aim is to understand if the negative estimated effect of unfilled practices originates from settlements where the use of antibiotics was relatively high, conditional on health needs and healthcare supply. To do so, first we estimate a cross-sectional regression of the annual antibiotic use in year 2010, and generate the residuals:
on September 15, 2019 by guest. Protected by copyright.http://bmjopen.bmj.com/
Figure 1 Spatial distribution of settlements with unfilled general practices, December 2015 (data source: National Health Insurance Fund Administration).
antibioticss,2010=γ02010+γu2010unfilleds,2010+γh2010hs,2010+εs,2010
(2) The outcome variable in equation (2) is the logarithm of the annual antibiotic DOT in 2010, and settlement-level controls (hs) are the same as in equation (1). The gener- ated residuals have a SD of 0.35 (with zero mean). Then, we re-estimate equation (1), with adding the interaction term between the ratio of unfilled general practices and the year 2010 residual of equation (2). Here we use data for years 2013 to 2015, so that we can interpret the inter- action term as the heterogenous effect according to the baseline use of antibiotics.
Regressions for GP care use
Finally, to investigate the mechanisms of how primary care availability affects the use of antibiotics, we estimate the impact of the ratio of unfilled general practices on the annual number of GP visits, and on antibiotic prescrip- tions per GP visit. We use the settlement-level (more precisely, GP catchment area level) GP care use statistics as described in section Settlement-level demographic, socio-economic and GP care data and restrict the analysis to villages. We estimate the following fixed effects model:
ln ys,t=β0+βuunfilleds,t+βdDdatet +βhhs,t+νsGP+εs,tGP
(3) The notations and the explanatory variables are essen- tially the same as in equation (1). Since the data are on the annual level, the time dummies are year dummies now. The dependent variables (lnys,t) are the logarithm of the per capita annual number of GP visits and the loga- rithm of the ratio of antibiotic prescriptions to GP visits.
Patient and public involvement
No patients were involved in the research, as it was based on the retrospective analysis of administrative data.
reSultS
Descriptive analysis Unfilled general practices
The number and the share of unfilled general practices increased from 150 (2.3%) in 2008 to 350 (5.5%) in 2016. Based on the (censored) data covering years 2004 to 2017, the observed mean duration of a practice being unfilled is 4.9 years, the median is 3.3 years.
Figure 1 shows the spatial distribution of settlements with unfilled general practices as of December 2015.
While unfilled practices are scattered all over Hungary, their distribution is more dense in the Eastern part of the country, especially in the poorer North-Eastern part.
Between years 2010 to 2015 (in the period on which our main antibiotic analysis is based), about two-third of unfilled general practices were in villages, and the share of unfilled practices increased from 5.8% to the substan- tial 10.9% in this settlement category. As the analysis presented in online supplementary appendix A2 shows, unfilled general practices are on average more common
in the less affluent villages, for example, where the unem- ployment rate is higher.
Within villages over years 2010 to 2015, the annual per capita number of GP visits was 8.0.
Consumption of antibiotics
Based on the NHIFA data, throughout years 2010 to 2015, the average per capita annual expenditures on antibiotics (social security plus out-of-pocket payments) were 4.5 EUR (1350 HUF), which accounted for 3.0% of the total per capita expenditures on prescribed pharmaceuticals (148 EUR (44 300 HUF)). Thirty per cent of antibiotic expenditures were paid by the social security. The DOT of antibiotics was 14.2 per 1000 inhabitant-days throughout years 2010 to 2015, without major time trend (15.1 in 2010, 14.8 in 2015).
Antibiotic consumption is strongly seasonal: compared with the summer months, expenditures more than double in the winter (online supplementary figure A3 in appendix A3). According to table 1, antibiotic DOT per 1000 inhabitant-days is higher for women than for men (by 23%), and higher for children than for adults, but the age differences are more pronounced for men than for women. Gender differences are partly due to the common use of antibiotics for the treatment of urinary tract infec- tions among women. There is a non-negligible variation in per capita antibiotic consumption across counties in Hungary. In line with Matuz et al,10 the use of antibiotics tends to be higher in the poorer areas (Eastern, North- Eastern and Southern Hungary – online supplementary figure A4 in appendix A3).
effects on the quantity of antibiotic consumption
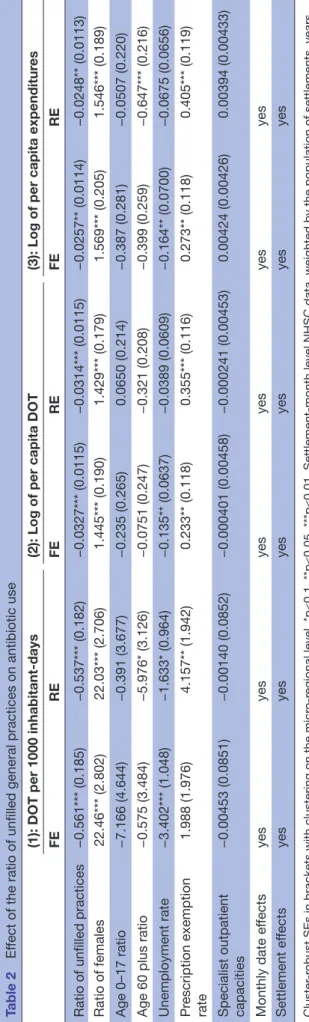
The estimation results of equation (1) are reported in table 2. The fixed effects logarithmic models show that when the single general practice covering a village becomes unfilled, then antibiotic DOT decreases by 0.033 on the logarithmic scale, that is, by 3.2% (95% CI 1.0% to 5.4%) and antibiotic expenditures by 0.026 on the loga- rithmic scale, that is, by 2.5% (95% CI 0.3% to 4.7%).
(If γ is an effect parameter in the logarithmic model then 100·(exp(γ)−1) is the percentage effect on the orig- inal scale, which is roughly 100·γ if γ is close to zero). In
on September 15, 2019 by guest. Protected by copyright.http://bmjopen.bmj.com/
Table 2Effect of the ratio of unfilled general practices on antibiotic use (1): DOT per 1000 inhabitant-days(2): Log of per capita DOT(3): Log of per capita expenditures FEREFEREFERE Ratio of unfilled practices−0.561*** (0.185)−0.537*** (0.182)−0.0327*** (0.0115)−0.0314*** (0.0115)−0.0257** (0.0114)−0.0248** (0.0113) Ratio of females22.46*** (2.802)22.03*** (2.706)1.445*** (0.190)1.429*** (0.179)1.569*** (0.205)1.546*** (0.189) Age 0–17 ratio−7.166 (4.644)−0.391 (3.677)−0.235 (0.265)0.0650 (0.214)−0.387 (0.281)−0.0507 (0.220) Age 60 plus ratio−0.575 (3.484)−5.976* (3.126)−0.0751 (0.247)−0.321 (0.208)−0.399 (0.259)−0.647*** (0.216) Unemployment rate−3.402*** (1.048)−1.633* (0.964)−0.135** (0.0637)−0.0389 (0.0609)−0.164** (0.0700)−0.0675 (0.0656) Prescription exemption rate1.988 (1.976)4.157** (1.942)0.233** (0.118)0.355*** (0.116)0.273** (0.118)0.405*** (0.119) Specialist outpatient capacities−0.00453 (0.0851)−0.00140 (0.0852)−0.000401 (0.00458)−0.000241 (0.00453)0.00424 (0.00426)0.00394 (0.00433) Monthly date effectsyesyesyesyesyesyes Settlement effectsyesyesyesyesyesyes Cluster-robust SEs in brackets with clustering on the micro-regional level, *p<0.1, **p<0.05, ***p<0.01. Settlement-month level NHSC data, weighted by the population of settlements, years 2010 to 2015. Number of observations: 162 720 in model (1), 162 311 in models (2) and (3) (number of settlements: 2316). DOT, days of therapy; FE, fixed effects;NHSC, National Healthcare Services Centre; RE, random effects.
absolute terms, the reducing effect is 0.6 DOT per 1000 inhabitant-days if the ratio of unfilled practices increases from zero to one.
Table 2 also shows that the random effects models yield almost identical estimates for the impact of the unfilled practices, so the above results are robust to this spec- ification change. Meanwhile, the parameters of some control variables differ substantially across the fixed/
random effects specifications. As a consequence, the Hausman-type overidentification test rejects the random effects model in favour of the fixed effects specification even at the 0.1% significance level for all three depen- dent variables. In the following we will display the fixed effects results.
Further specification checks were also performed. The estimation results change only slightly if the main explan- atory variable – the continuous indicator of the ratio of unfilled practices – is replaced with a categorical variable that takes three distinct values: it equals 0 if the ratio of unfilled practices is 0, equals 1 if the ratio of unfilled practices is between 0 and 1 and equals 2 if the ratio of unfilled practices is 1. In other words, here we distinguish the settlements where no practices are unfilled, where all practices are unfilled and where some practices are filled and some are unfilled (middle category). Additionally, to check for non-linearities, we include the squared terms of all control variables in the model.
According to the parameter estimates in this specifica- tion, if all GP practices (typically the single available GP practice) become unfilled, that implies a 3.7% lower per capita antibiotic DOT (95% CI: 1.5% to 5.8%) compared with the ‘none unfilled’ category, which is very close to the estimate of the linear specification presented in table 2 (ie, 3.2%). Meanwhile, if there are more than one GP practices and some but not all of them become unfilled, that has no significant effect on antibiotic consumption (effect size is −0.5%, 95% CI −2.5% to +1.4%).
Finally, specification checks (not shown here in detail) reveal that above the contemporaneous effect, past and future (ie, previous and next year’s) unfilled status of the general practice have no significant effect on antibiotic use. Thus, we find no evidence for adjustment in anti- biotic use after the immediate negative effect of a prac- tice becoming unfilled. We also do not see evidence that people would adjust their antibiotic use in anticipation of a practice becoming unfilled.
Heterogeneity analyses
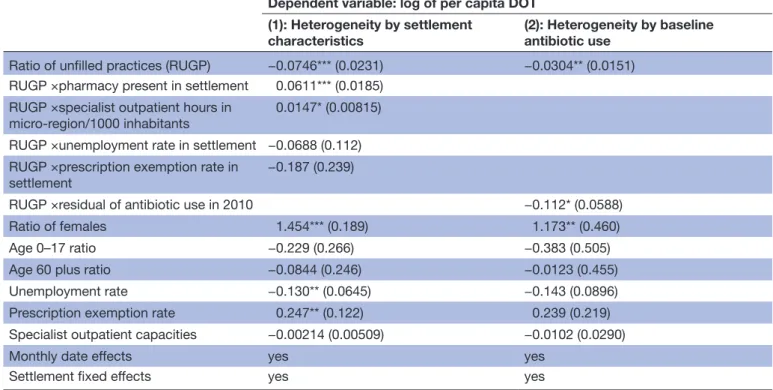
The heterogeneity analyses are reported in table 3.
According to the first column, a poorer supply of health- care services (as captured by the availability of specialist care and pharmacies) strengthens the negative effect of unfilled general practices on antibiotic consumption.
Lower supply of specialist care implies less opportunity for substitution of primary care, leading to the stronger effect of the availability of primary care on antibiotic use.
Meanwhile, there is no effect heterogeneity according to
on September 15, 2019 by guest. Protected by copyright.http://bmjopen.bmj.com/
Table 3 Heterogeneous effect of the ratio of unfilled general practices
Dependent variable: log of per capita DOT (1): Heterogeneity by settlement
characteristics (2): Heterogeneity by baseline antibiotic use
Ratio of unfilled practices (RUGP) −0.0746*** (0.0231) −0.0304** (0.0151) RUGP ×pharmacy present in settlement 0.0611*** (0.0185)
RUGP ×specialist outpatient hours in
micro-region/1000 inhabitants 0.0147* (0.00815)
RUGP ×unemployment rate in settlement −0.0688 (0.112) RUGP ×prescription exemption rate in
settlement −0.187 (0.239)
RUGP ×residual of antibiotic use in 2010 −0.112* (0.0588)
Ratio of females 1.454*** (0.189) 1.173** (0.460)
Age 0–17 ratio −0.229 (0.266) −0.383 (0.505)
Age 60 plus ratio −0.0844 (0.246) −0.0123 (0.455)
Unemployment rate −0.130** (0.0645) −0.143 (0.0896)
Prescription exemption rate 0.247** (0.122) 0.239 (0.219)
Specialist outpatient capacities −0.00214 (0.00509) −0.0102 (0.0290)
Monthly date effects yes yes
Settlement fixed effects yes yes
Cluster-robust SEs in brackets with clustering on the micro-regional level, *p<0.1, **p<0.05, ***p<0.01. Settlement-month level NHSC data, weighted by the population of settlements,years: 2010 to 2015 in model (1), 2013 to 2015 in model (2). Number of observations: 162 311 in model (1), 79.432 in model (2) (number of settlements: 2316).
DOT, days of therapy; NHSC, National Healthcare Services Centre; RUGP, ratio of unfilled general practices.
socioeconomic conditions measured by the local unem- ployment rate and the prescription exemption rate.
The results reported in the second column of table 3 suggest that a major fraction of the negative effect of unfilled general practices originates from settlements where the baseline use of antibiotics was comparatively high. In settlements where the initial use of antibiotics was higher by one standard deviation (by 0.35 on loga- rithmic scale), the negative effect on the logarithm of antibiotic consumption is stronger by 0.039, comparable with the magnitude of the average effect.
effects on quality indicators
We investigate some further indicators of antibiotic use that can provide evidence whether the quality of anti- biotic prescriptions is affected by the unfilled status of general practices.
First, we look at the effect of the ratio of unfilled general practices on the use of narrow-spectrum versus broad-spec- trum antibiotics. According to fixed effects panel regres- sions (table 4), this quality index decreases substantially by 0.023 (from an average level of 0.18) if a practice becomes unfilled, suggesting quality deterioration. The numerator (consumption of narrow-spectrum antibiotics) decreases by 7.5% (ie, by 0.078 on the logarithmic scale), while the denominator (consumption of broad-spectrum antibiotics) decreases by a statistically insignificant 1.4%.
Second, table 4 also shows that the consumption of Access antibiotics decreases statistically significantly by 3.1%
(ie, by 0.032 on the logarithmic scale) if a practice becomes
unfilled, while the consumption of Watch and Reserve anti- biotics decreases by a statistically insignificant 1.9%. These results again suggest a quality worsening effect.
GP care use and antibiotics: understanding the mechanism We also examine how the effect of unfilled general prac- tices on the number of GP visits interferes with the effect on antibiotic use. Our regression results show that living in a village where the single general practice is unfilled implies on average 9.3% fewer GP visits (95% CI 5.6% to 12.9%; −0.098 on the logarithmic scale), holding settle- ment-level controls and time invariant characteristics fixed, and netting out time effects (table 5, first column).
Due to the measurement error in the GP care use indicator (measured at the centre of a catchment area, as explained in section Settlement-level demographic, socio-economic and GP care data), the true effect could be even higher.
Nevertheless, the results indicate a substantial negative effect of unfilled practices on GP care use.
It is also known from our results that per capita antibi- otic DOT decreases on average only by 3.2% (table 2).
The smaller decrease in antibiotic use than in GP visits suggests that the limited availability of GP care is partly compensated by a higher likelihood of antibiotic prescrip- tion per GP visit. Indeed, as shown in the second column of table 5, a general practice becoming unfilled increases antibiotic prescriptions per GP visits by 7.5% (ie, by 0.073 on the logarithmic scale). Hence the overall negative effect of unfilled practices on antibiotic use stems from
on September 15, 2019 by guest. Protected by copyright.http://bmjopen.bmj.com/
Table 4 Effect of the ratio of unfilled general practices on the use of selected antibiotic categories Log of per capita DOT
Quality index Broad spectrum Narrow spectrum Access Watch & Reserve Ratio of unfilled
practices −0.0233** (0.0101) −0.0139 (0.0129) −0.0781** (0.0387) −0.0319**
(0.0137) −0.0187 (0.0176) Ratio of females −0.134 (0.122) 1.625*** (0.212) 1.500*** (0.519) 1.466*** (0.246) 1.376*** (0.290) Age 0–17 ratio 0.154 (0.1860) −0.373 (0.279) −1.087 (0.766) −0.0951 (0.329) −0.411 (0.404) Age 60 plus ratio 0.257* (0.154) −0.268 (0.273) 0.0341 (0.704) −0.162 (0.302) −0.101 (0.369) Unemployment
rate −0.0393 (0.0423) −0.0904 (0.0637) −0.591*** (0.194) −0.224** (0.0934) −0.0415 (0.0788) Prescription
exemption rate −0.0371 (0.0819) 0.209* (0.109) 0.276 (0.407) 0.230 (0.153) 0.407*** (0.150) Specialist
outpatient capacities
−0.00293 (0.00381) −0.00119 (0.00463) 0.00252 (0.0211) 0.00290 (0.00795) −0.00168 (0.00864)
Monthly date
effects yes yes yes yes yes
Settlement fixed
effects yes yes yes yes yes
Observations 162 256 162 256 141 208 161 866 161 261
Cluster-robust SEs in brackets with clustering on the micro-regional level, *p<0.1, **p<0.05, ***p<0.01. Settlement-month level NHSC data, weighted by the population of settlements, years: 2010 to 2015. Number of settlements: 2316. Quality index: ratio of DOT of narrow-spectrum vs broad-spectrum antibiotics.
DOT, days of therapy; NHSC, National Healthcare Services Centre.
Table 5 Effect of the ratio of unfilled general practices on annual GP visits and antibiotics prescription per GP visit Log of annual GP visits per capita Log of antibiotic DOT per GP visit Ratio of unfilled practices −0.0980*** (0.0207) 0.0726*** (0.0230)
Ratio of females 1.440*** (0.333) −0.252 (0.388)
Age 0–17 ratio −1.126*** (0.371) 1.042** (0.437)
Age 60 plus ratio 0.592 (90.392) −0.632 (0.475)
Unemployment rate −0.0202 (0.0847) −0.117 (0.0999)
Prescription exemption rate 0.498*** (0.180) −0.339* (0.195)
Specialist outpatient capacities −0.00425 (0.00596) 0.000564 (0.00585)
Year effects yes Yes
GP catchment area fixed effects yes Yes
Cluster-robust SEs in brackets with clustering on the micro-regional level, *p<0.1, **p<0.05, ***p<0.01. GP catchment area-year level T-STAR data, weighted by the population of GP catchment areas, years: 2010 to 2015. Number of observations: 8505 (number of GP catchment areas: 1438).
DOT, days of therapy; GP, general practitioner.
the limited access to GP care, and not from the deputy GPs prescribing fewer antibiotics per visit.
DISCuSSIOn
Using administrative data from Hungary, we estimated the effect of primary care availability on antibiotic use.
We exploited the geographical and time variation in unfilled general practices as a source of exogenous vari- ation in primary care supply. We estimated a negative
3.2% average effect on per capita antibiotic use if the ratio of unfilled general practices increase from 0 to 1 in a settlement (eg, if the only general practice becomes unfilled in a settlement). Larger effects are observed for settlements with limited availability of specialist care and pharmacies. While the use of antibiotics decreases as a consequence of the supply-side effects, we also find evidence that the quality of antibiotic prescriptions deteriorates.
on September 15, 2019 by guest. Protected by copyright.http://bmjopen.bmj.com/
In our main specification, we estimated panel regres- sions with settlement-level fixed effects. This strengthens the identification of the parameters of our interest because we could control for any time-invariant unmeasured char- acteristics of the settlements that could interfere with the probability of a general practice being unfilled. We also demonstrated that the use of settlement-level random effects, or a non-linear specification in the explanatory variables give almost identical estimates for the impact of unfilled practices on antibiotic indicators, so our results are robust to these specification changes.
Our results come from a healthcare system where general practices are overwhelmingly single-handed and group practices are extremely rare. Therefore, our main explanatory variable, the ratio of unfilled practices in a village, captures the availability of primary care reasonably well. We note, however, that using a more conventional indicator such as the number of GPs per 1000 inhabitants gives similar results: higher density of GPs is associated with higher use of antibiotics. Specifically, if the number of available GPs per 1000 inhabitants in a settlement increases by one (the average of this measure is 1.7 in our sample) then per capita antibiotic use increases by 2.2%
(95% CI 1.3% to 3.2%), according to our calculations.
Our results are in line with the literature showing that geographical distance to healthcare facilities nega- tively affects healthcare use (Haynes et al, Hyndman et al, Elek et al30–32, among others). Also, we contribute to the literature on the determinants of antibiotic prescribing behaviour of GPs. There is evidence that pay-for-perfor- mance programmes can reduce broad-spectrum antibi- otic prescribing.33 34 Our results indicate that reduced availability of primary care worsens the quality of antibi- otic prescribing; the share of broad-spectrum antibiotics increases.
The study is subject to some limitations. The external validity is restricted to similar healthcare systems, that is to systems with mostly single-handed general practices, which serve as the first point of contact to the system.
Also, while the consumption of pharmaceuticals other than antibiotics is also likely to be affected by the avail- ability of primary care, it remains for future research to investigate these effects. Finally, despite the richness of the administrative data used, we face some data limita- tions. There could still remain unobserved time-varying confounders that are related both to antibiotic use and the availability of GP care (such as changing population health status and health behaviour). We do not have infor- mation on who exactly – among the other GPs – provide service as deputy GP and how exactly the opening hours change if a general practice becomes unfilled. Also, we do not know to what extent patients switch from an unfilled general practice to another, filled one. These details could provide further insights into the mechanisms how primary care availability affects antibiotic use.
Overall, the results suggest that given the socioeco- nomic status of a settlement, and given the supply of secondary care, the availability of primary care has a
non-negligible effect on the quantity and quality of anti- biotic consumption. The main message is that antibiotic use can be influenced by supply-side factors, the usage is sensitive to the access to primary care. The overuse of antibiotics might be limited if the number of avoidable visits to primary care physicians is decreased. However, it is important to keep in mind that for avoiding antibiotic resistance, it is desirable not only to reduce the overall use of antibiotics, but also to shift consumption towards narrow-spectrum antibiotics. According to our results, such a quality improvement cannot be achieved with limiting the availability of primary care.
Acknowledgements The authors would like to thank Gábor Kertesi for his help in carrying out this research, Hedvig Horváth, Norbert Kiss and Balázs Váradi for their useful comments.
Contributors AB and PE designed the study together, they both contributed to the data analysis and both were major contributors in writing the paper. Both authors read and approved the final manuscript.
Funding AB and PE were supported by the Momentum programme of the Hungarian Academy of Sciences (grant number: LP2018-2/2018). PE was supported by the ÚNKP-17-4 New National Excellence Programme of the Ministry of Human Capacities of Hungary.
Map disclaimer The depiction of boundaries on the map(s) in this article do not imply the expression of any opinion whatsoever on the part of BMJ (or any member of its group) concerning the legal status of any country, territory, jurisdiction or area or of its authorities. The map(s) are provided without any warranty of any kind, either express or implied.
Competing interests None declared.
Patient consent for publication Not required.
ethics approval The research was approved by the Research Ethics Committee of the Hungarian Medical Research Council (No 18493 – 2/2018/EKU).
Provenance and peer review Not commissioned; externally peer reviewed.
Data availability statement The administrative data on the use of antibiotics were obtained from the National Healthcare Services Centre (NHSC) of Hungary through an agreement between the NHSC and the Institute of Economics, Centre for Economic and Regional Studies of the Hungarian Academy of Sciences. The authors obtained the list of filled and unfilled general practices from the National Health Insurance Fund Administration (NHIFA). The authors got access to the T-STAR database through the Databank of the Institute of Economics, Centre for Economic and Regional Studies of the Hungarian Academy of Sciences. The authors are not permitted to make these datasets available to third parties. County-level statistics on pharmaceutical sales from were obtained from the public website of the National Health Insurance Fund Administration: http://www. neak. gov. hu/ felso_ menu/
szakmai_ oldalak/ publikus_ forgalmi_ adatok/ gyogyszer_ forgalmi_ adatok.
Open access This is an open access article distributed in accordance with the Creative Commons Attribution Non Commercial (CC BY-NC 4.0) license, which permits others to distribute, remix, adapt, build upon this work non-commercially, and license their derivative works on different terms, provided the original work is properly cited, appropriate credit is given, any changes made indicated, and the use is non-commercial. See: http:// creativecommons. org/ licenses/ by- nc/ 4. 0/.
reFerenCeS
1. NHS. The antibiotic awareness campaign, 2018. Available: https://
www. nhs. uk/ NHSEngland/ ARC/ Pages/ AboutARC. aspx [Accessed : 2018-01-08].
2. Van Boeckel TP, Gandra S, Ashok A, et al. Global antibiotic consumption 2000 to 2010: an analysis of national pharmaceutical sales data. Lancet Infect Dis 2014;14:742–50.
3. Blaser M. Antibiotic overuse: stop the killing of beneficial bacteria.
Nature 2011;476:393–4.
4. WHO. Ten threats to global health in 2019, 2019. Available: https://
www. who. int/ emergencies/ ten- threats- to- global- health- in- 2019
on September 15, 2019 by guest. Protected by copyright.http://bmjopen.bmj.com/
5. Lember M, Cartier T, Bourgueil Y, et al. Structure and organization of primary care. In: Kringos DS, Boerma WGW, Hutchinson A, et al, eds. Building primary care in a changing Europe: case studies.
Copenhagen, Denmark: European Observatory on Health Systems and Policies, 2015(Observatory Studies Series, No. 40).
6. Spence D. General practice in meltdown. Br J Gen Pract 2016;66.
7. Lundkvist J, Åkerlind I, Borgquist L, et al. The more time spent on listening, the less time spent on prescribing antibiotics in general practice. Fam Pract 2002;19:638–40.
8. Filippini M, Masiero G, Moschetti K. Socioeconomic determinants of regional differences in outpatient antibiotic consumption: evidence from Switzerland. Health Policy 2006;78:77–92.
9. Masiero G, Filippini M, Ferech M, et al. Socioeconomic determinants of outpatient antibiotic use in Europe. Int J Public Health
2010;55:469–78.
10. Matuz M, Benko R, Doro P, et al. Regional variations in community consumption of antibiotics in Hungary, 1996-2003. Br J Clin Pharmacol 2006;61:96–100.
11. Gaál P, Szigeti S, Csere M, et al. Hungary health system review.
Health Syst Transit 2011;13:1–266.
12. Wilm S, Vajer P, Rurik I. Hungary. In: Kringos DS, Boerma WGW, Hutchinson A, et al, eds. Building primary care in a changing Europe:
case studies. Copenhagen, Denmark: European Observatory on Health Systems and Policies, 2015(Observatory Studies Series, No.
40).
13. Hungarian Central Statistical Office. Primary health care database, 2018. Available: https://www. ksh. hu/ docs/ hun/ xstadat/ xstadat_ eves/
i_ fea001. html [Accessed 08 Jan 2018].
14. European Centre for Disease Prevention and Control (ECDPC).
Summary of the latest data on antibiotic consumption in Eu: 2017, 2017. Available: https:// ecdc. europa. eu/ en/ publications- data/
summary- latest- data- antibiotic- consumption- eu- 2017 [Accessed 23 Feb 2018].
15. Juhasz Z, Benko R, Matuz M, et al. Treatment of acute cystitis in Hungary: comparison with national guidelines and with disease- specific quality indicators. Scand J Infect Dis 2013;45:612–5.
16. Marton A, Gulyas M, Munoz R, et al. Extremely high incidence of antibiotic resistance in clinical isolates of Streptococcus pneumoniae in Hungary. J Infect Dis 1991;163:542–8.
17. Cormican M, Hopkins S, Jarlier V, et al. ECDC, EFSA and EMA joint scientific opinion on a list of outcome indicators as regards surveillance of antimicrobial resistance and antimicrobial consumption in humans and food-producing animals ECDC and EFSA panel on biological hazards (BIOHAZ) and EMA committee for medicinal products for veterinary use committee for medicinal products for veterinary use (CVMP)*. EFSA J 2017;15:e05017.
18. WHO. Who report on surveillance of antibiotic consumption: 2016–
2018 early implementation. Geneva: World Health Organization, 2018.
19. Melander RJ, Zurawski DV, Melander C. Narrow-spectrum antibacterial agents. Medchemcomm 2018;9:12–21.
20. Adriaenssens N, Coenen S, Versporten A, et al. European surveillance of antimicrobial consumption (ESAC): quality appraisal of antibiotic use in Europe. J Antimicrob Chemother 2011;66 Suppl 6:vi71–7.
21. WHO. Who model Lists of essential medicines, 2017. Available:
https://www. who. int/ medicines/ publications/ essentialmedicines/ en/
22. National Health Insurance Fund Administration (NHIFA). A háziorvosi szolgálatok indikátor alapú teljesítményértékelése.
(indicator-based performance evaluation of primary care practices), 2014. Available: http:// neak. gov. hu/ data/ cms1002602/
HAZIORVOSOK_ INDIKATOR_ ALAPU_ TELJESITMENY_ 201404. pdf [Accessed 08 Jan 2018].
23. Matuz M, Benko R, Doro P, et al. Non-prescription antibiotic use in Hungary. Pharm World Sci 2007;29:695–8.
24. National Health Insurance Fund Administration (NHIFA). County level monthly statistics of pharmaceutical purchases, 2018. Available:
http://www. neak. gov. hu/ felso_ menu/ szakmai_ oldalak/ publikus_
forgalmi_ adatok/ gyogyszer_ forgalmi_ adatok [Accessed 18 Jan 2018].
25. Wooldridge JM. Econometric analysis of cross section and panel data. MIT Press, 2010.
26. Colin Cameron A, Miller DL. A practitioner’s guide to cluster-robust inference. J Hum Resour 2015;50:317–72. and.
27. Cameron AC, Trivedi PK. Microeconometrics with STATA. College Station, TX: StataCorp LP, 2009.
28. Schaffer ME, Stillman S. Xtoverid: Stata module to calculate tests of overidentifying restrictions after xtreg, xtivreg, xtivreg2 and xthtaylor, 2010. Available: http:// ideas. repec. org/ c/ boc/ bocode/
s456779. html
29. StataCorp. Stata: release 15. Statistical software. College Station, TX:
StataCorp LLC, 2017.
30. Haynes RM, Bentham CG. The effects of accessibility on general practitioner consultations, out-patient attendances and in-patient admissions in Norfolk, England. Soc Sci Med 1982;16:561–9.
31. Hyndman JC, Holman CD, Dawes VP. Effect of distance and social disadvantage on the response to invitations to attend mammography screening. J Med Screen 2000;7:141–5.
32. Elek P, Váradi B, Varga M. Effects of geographical accessibility on the use of outpatient care services: quasi-experimental evidence from panel count data. Health Econ 2015;24:1131–46.
33. Ellegård LM, Dietrichson J, Anell A. Can pay-for-performance to primary care providers stimulate appropriate use of antibiotics?
Health Econ 2018;27:e39–54.
34. Balinskaite V, Johnson AP, Holmes A, et al. The impact of a national antimicrobial stewardship program on antibiotic prescribing in primary care: an interrupted time series analysis. Clin Infect Dis 2019;69:227–32.
on September 15, 2019 by guest. Protected by copyright.http://bmjopen.bmj.com/


![wasrecentlydocumentedfortheEUtoreducegreenhouseemissionsbyatleastby55% goalwastointegratepoliticalandeconomiccooperationfully[ ].Energysecurityisaglobalconcernnowadays.Allnationsaroundtheworldhaveframedenergypoliciesincontrastwithsustainablegrowth.Almosta](data:image/gif;base64,R0lGODlhAQABAIAAAP///wAAACH5BAEAAAAALAAAAAABAAEAAAICRAEAOw==)