sustainability
Article
Trendline Assessment of Solar Energy Potential in Hungary and Current Scenario of Renewable Energy in the Visegrád
Countries for Future Sustainability
Baibhaw Kumar1,* , Gábor Szepesi1 , Zsolt ˇConka2,* , Michal Kolcun2, Zsolt Péter3, LászlóBerényi4 and Zoltán Szamosi1
Citation: Kumar, B.; Szepesi, G.;
Conka, Z.; Kolcun, M.; Péter, Z.;ˇ Berényi, L.; Szamosi, Z. Trendline Assessment of Solar Energy Potential in Hungary and Current Scenario of Renewable Energy in the Visegrád Countries for Future Sustainability.
Sustainability2021,13, 5462.
https://doi.org/10.3390/su13105462
Academic Editors: Marc A. Rosen, Inga Zicmane, Gatis Junghans, Svetlana Beryozkina and Sergey Kovalenko
Received: 18 March 2021 Accepted: 11 May 2021 Published: 13 May 2021
Publisher’s Note:MDPI stays neutral with regard to jurisdictional claims in published maps and institutional affil- iations.
Copyright: © 2021 by the authors.
Licensee MDPI, Basel, Switzerland.
This article is an open access article distributed under the terms and conditions of the Creative Commons Attribution (CC BY) license (https://
creativecommons.org/licenses/by/
4.0/).
1 Institute of Energy Engineering and Chemical Machinery, University of Miskolc, 3500 Miskolc, Hungary;
szepesi@uni-miskolc.hu (G.S.); szamosi@uni-miskolc.hu (Z.S.)
2 Department of Electric Power Engineering, Technical University of Košice, 040 01 Košice, Slovakia;
michal.kolcun@tuke.sk
3 Institute of World and Regional Economics, University of Miskolc, 3500 Miskolc, Hungary;
regpzs@uni-miskolc.hu
4 Institute of Management Science, University of Miskolc, 3500 Miskolc, Hungary;
berenyi.laszlo@uni-miskolc.hu
* Correspondence: vegybk@uni-miskolc.hu (B.K.); zsolt.conka@tuke.sk (Z. ˇC.)
Abstract: This article aims to present some opportunities for improved solar energy utilization by raising the share of renewables in energy generation in the Visegrád Countries (Poland, Czech Republic, Slovakia, and Hungary). The analysis is based on the status of the renewable energy targets in the member countries and their future possibilities. This paper derives input through a thorough investigation of independent data, government policies, European Commission reports, and other data available online with free access. The analysis is processed by focusing on Hungary, as a country with various possible facets of solar energy demand and supply in the region. The assessment methodology is in the context of a geographical map, technical regression analysis, temperature distribution profiles, and the relative trends of solar potential in Hungary. The country currently has ten solar power plants with more than 10 MWp, and five remarkable plants under 10 MWp capacity spread over Hungary. The analysis on geographical aspects clubbed with technical and solar affecting parameters was carried out to harvest the sustainable potential of solar energy in the region. This study attempts to establish a relationship between the current and future prospects of solar energy in Hungary as a nation, and as part of the Visegrád countries, based on assessment for a sustainable future.
Keywords:renewable energy; Visegrád countries; solar potential; Hungary
1. Introduction
The political instability in the Central European region gave birth to the Visegrád countries in 1991. Later, in the year 1993, the dissolution of Czechoslovakia led to the formation of a quadrangle group of countries, which later came to be known also as the
“Visegrád Group”, or the “V4 countries”. In the beginning, this informal association’s main goal was to integrate political and economic cooperation fully [1]. Energy security is a global concern nowadays. All nations around the world have framed energy policies in contrast with sustainable growth. Almost all regions and continents have adopted their own national policies as well. Similarly, the European Union (EU) framed H2020 targets to reduce greenhouse gas emissions in 2007 [2]. The 2030 climate and energy framework was recently documented for the EU to reduce greenhouse emissions by at least by 55%
compared to 1990 [3]. Reducing carbon emissions and dependence on conventional energy sources is a major challenge for all European nations, especially V4 countries. Settled in the middle of the EU, the V4 countries can significantly contribute to curbing energy security
Sustainability2021,13, 5462. https://doi.org/10.3390/su13105462 https://www.mdpi.com/journal/sustainability
Sustainability2021,13, 5462 2 of 16
problems through cooperation. The V4 countries still have a long path to cover to reduce their dependence on fossil fuels, and renewable energy could be a possible solution. The joint policy paper on energy security recommended creating better regional infrastructure for the regional energy market [4].
Today, the energy security concern is a global issue and seeks global cooperation to tackle emerging energy scarcity. The concerns regarding energy production are not only limited to developing countries. However, there are challenges to meet CO2 emissions, and a sustainable environment cannot be left behind. In such a case, renewable energy sources emerged as a promising solution at the beginning of the 21st century. The emergence of various non-conventional energy sources opened the doors of cooperation among nations as well. The Visegrád Countries in the Central European region are an example of countries with mutual interests that should look beyond boundaries to develop emerging energy sectors. The renewable sources are not yet as user-friendly or economically viable as the conventional fossil fuel-based energy market. The mutual agreements could accelerate the innovations related to various renewable sources among nations. The European Commis- sion’s National energy and climate plans (NECP) reports highlight the effectiveness of V4 nations with some recommendations, which are highlighted in this study. In this study, each country, namely Poland, the Czech Republic, Slovakia, and Hungary, is discussed regarding their current energy status in renewable sources [5,6].
The EU aims to increase the share of renewable energy consumption; the target value is 32% [7]. The national energy and climate plans (NECP) reflect the renewable energy percentage share for V4 countries as Poland (23%), Hungary (21%), Czech Republic (22%), and Slovakia (19.2%) by 2030. Thus, according to the current scenario, V4 nations should look for new potentials and analyze their renewable energy production strategy. Figure1 shows a comprehensive recent status picture of the share of renewable sources in energy consumption of the V4 Countries [8].
Sustainability 2021, 13, x FOR PEER REVIEW 2 of 18
compared to 1990 [3]. Reducing carbon emissions and dependence on conventional en‐
ergy sources is a major challenge for all European nations, especially V4 countries. Settled in the middle of the EU, the V4 countries can significantly contribute to curbing energy security problems through cooperation. The V4 countries still have a long path to cover to reduce their dependence on fossil fuels, and renewable energy could be a possible solu‐
tion. The joint policy paper on energy security recommended creating better regional in‐
frastructure for the regional energy market [4].
Today, the energy security concern is a global issue and seeks global cooperation to tackle emerging energy scarcity. The concerns regarding energy production are not only limited to developing countries. However, there are challenges to meet CO2 emissions, and a sustainable environment cannot be left behind. In such a case, renewable energy sources emerged as a promising solution at the beginning of the 21st century. The emer‐
gence of various non‐conventional energy sources opened the doors of cooperation among nations as well. The Visegrád Countries in the Central European region are an example of countries with mutual interests that should look beyond boundaries to de‐
velop emerging energy sectors. The renewable sources are not yet as user‐friendly or eco‐
nomically viable as the conventional fossil fuel‐based energy market. The mutual agree‐
ments could accelerate the innovations related to various renewable sources among na‐
tions. The European Commission’s National energy and climate plans (NECP) reports highlight the effectiveness of V4 nations with some recommendations, which are high‐
lighted in this study. In this study, each country, namely Poland, the Czech Republic, Slo‐
vakia, and Hungary, is discussed regarding their current energy status in renewable sources [5,6].
The EU aims to increase the share of renewable energy consumption; the target value is 32% [7]. The national energy and climate plans (NECP) reflect the renewable energy percentage share for V4 countries as Poland (23%), Hungary (21%), Czech Republic (22%), and Slovakia (19.2%) by 2030. Thus, according to the current scenario, V4 nations should look for new potentials and analyze their renewable energy production strategy. Figure 1 shows a comprehensive recent status picture of the share of renewable sources in energy consumption of the V4 Countries [8].
Figure 1. Share of energy from renewable sources in final gross consumption of energy in V4 Countries NECP and future expectations by 2030 [9].
Thus, the requirement of investigations on the possible supply of power through re‐
newable energy sources (RES) becomes inevitable. The study could be briefly framed in the context of the following research assessments:
2020 2030 0
5 10 15 20 25
Hungary Poland Czech
Republic
Slovakia
%share
2020 2030
Figure 1. Share of energy from renewable sources in final gross consumption of energy in V4 Countries NECP and future expectations by 2030 [9].
Thus, the requirement of investigations on the possible supply of power through renewable energy sources (RES) becomes inevitable. The study could be briefly framed in the context of the following research assessments:
• The status of renewable energy consumption share trends in V4 Countries, focusing on Hungary as a case study for solar energy harnessing.
• Comparative study for the V4 countries on irradiation observation parameters through regional maps and graph trend analysis.
• Recent observation of the performance of grid-connected PV systems for a fixed angle.
Profiling of various cities was conducted to observe their potential for the potential study of Hungary.
Sustainability2021,13, 5462 3 of 16
The rise of renewable energy shares by percentage in the Visegrád Countries and the specific country shares can be observed in Figure2. Short-term dynamic studies reveal unidirectional casualties in the regional group in contrast with energy consumption, carbon emissions, and economic growth [10]. The decomposition analysis also suggests energy intensity, and carbon emissions were the driving force for gross development product (GDP) per capita in the Visegrád Countries [11]. There could be possible heterogeneity in the approaches of the V4 Countries [12]. Thus, further country-based distinguished status is discussed in the next chapter.
Sustainability 2021, 13, x FOR PEER REVIEW 3 of 18
The status of renewable energy consumption share trends in V4 Countries, focusing on Hungary as a case study for solar energy harnessing.
Comparative study for the V4 countries on irradiation observation parameters through regional maps and graph trend analysis.
Recent observation of the performance of grid‐connected PV systems for a fixed an‐
gle. Profiling of various cities was conducted to observe their potential for the poten‐
tial study of Hungary.
The rise of renewable energy shares by percentage in the Visegrád Countries and the specific country shares can be observed in Figure 2. Short‐term dynamic studies reveal unidirectional casualties in the regional group in contrast with energy consumption, car‐
bon emissions, and economic growth [10]. The decomposition analysis also suggests en‐
ergy intensity, and carbon emissions were the driving force for gross development prod‐
uct (GDP) per capita in the Visegrád Countries [11]. There could be possible heterogeneity in the approaches of the V4 Countries [12]. Thus, further country‐based distinguished sta‐
tus is discussed in the next chapter.
Figure 2. Renewable energy share growth by percentage in V4 Countries [9].
2. Overview of the Member State Positions 2.1. Poland
Nowadays, solar photovoltaic (PV) technologies are at an all‐time high in high lati‐
tude countries, including Poland [13]. Poland’s energy consumption has increased signif‐
icantly in the last decade, with 175 TWh recorded in 2019. Though the share of renewable energy in power production reached a breakthrough with 25 TWh in 2019, the significant share of around 73% is still being produced in coal and lignite plants. The country also struggles with reducing CO2 emissions, as emissions have been stagnant since 2018 with‐
out further reduction. According to the European Union NECP, these numbers predict a possible outgrowing potential for the renewable sources industry to foster in the region.
As per the “INSTITUTE FOR RENEWABLE ENERGY” reports, Poland ranks fifth among EU countries for growing solar photovoltaics technology capacity for the year 2020. With the highest increase in micro installations, the total installed power capacity reached 1950 MW by May 2020. The prime reason behind this is the development of solar parks in re‐
newable energy auctions with less than one MW capacity. Due to the pandemic, many installations are halted, and thus 2021–2022 could be considered a boom in Poland’s solar PV market [14]. According to the energy policy of Poland for 2040, the country estimates 21% RES in gross energy consumption by 2030 [15].
Figure 2.Renewable energy share growth by percentage in V4 Countries [9].
2. Overview of the Member State Positions 2.1. Poland
Nowadays, solar photovoltaic (PV) technologies are at an all-time high in high latitude countries, including Poland [13]. Poland’s energy consumption has increased significantly in the last decade, with 175 TWh recorded in 2019. Though the share of renewable energy in power production reached a breakthrough with 25 TWh in 2019, the significant share of around 73% is still being produced in coal and lignite plants. The country also struggles with reducing CO2 emissions, as emissions have been stagnant since 2018 without further reduction. According to the European Union NECP, these numbers predict a possible outgrowing potential for the renewable sources industry to foster in the region. As per the
“INSTITUTE FOR RENEWABLE ENERGY” reports, Poland ranks fifth among EU countries for growing solar photovoltaics technology capacity for the year 2020. With the highest increase in micro installations, the total installed power capacity reached 1950 MW by May 2020. The prime reason behind this is the development of solar parks in renewable energy auctions with less than one MW capacity. Due to the pandemic, many installations are halted, and thus 2021–2022 could be considered a boom in Poland’s solar PV market [14].
According to the energy policy of Poland for 2040, the country estimates 21% RES in gross energy consumption by 2030 [15].
2.2. The Czech Republic
The Czech goal to reach 22% electricity production by 2030 could be a tough call because it demands an investment of EUR 12.6 billion in the market sector. If only focused on solar energy, the PV plants need to expand from the current capacity of 2.25 GW to 3.8 GW, including closing older solar photovoltaic power plants [16]. An exciting observation revealed that mayors of different regions could play a significant role in bridging the gap between renewable energy projects in the Czech areas [17]. According to NECP, Czech Republic has set a lower target for itself with an RES proportion of 22% by 2030. This not only restricts the self-energy producers, but the entrepreneurs and innovators who could play a significant role in this transition. Too much focus and dependence on biomass-based energy sources are not recommended for long-term sustainability as
Sustainability2021,13, 5462 4 of 16
recommended by NECP. Thus, Czechia can uphold its commitment to producing more RES based on solar photovoltaics by following the recommendations of the NECP.
2.3. Slovakia
Slovakia has the target of a 19.2% share in renewable energy source consumption by 2030. This percentage of allocation is relatively less than other Visegrád Countries. The greater tilt towards nuclear energy facilities and gasification plants reduces the possibility to achieve the given targets by NECP. Slovakia can raise 1–5 MW capacity solar plants and self-sustainable models in photovoltaics utilization facilities. The Slovak Association for the photovoltaic and renewable energy industry recommends enhancing the renewable energy share by approximately 31%, which could be very helpful. The Slovak region also needs to look beyond biomass facilities and tap the available solar potential with better policies [18].
Spatial distribution of irradiance and the dynamics of the topography could help project better topographical regions for solar power plants. In Slovakia, the annual sum of clear sky solar irradiance on a horizontal plane is about 900–1800 kWh/m2/year. The optimization of solar tilt angles could increase energy output by 30% during winter months, e.g., in December compared to June [19]. One study shows that “Komarno” and “Nove Zamky” have the highest potential to harness solar energy on the district level. In contrast, the other districts which have good potential seem to be economically backward. Thus, fur- ther investigation is also needed on potential economic reforms and support by concerned state authorities [19].
2.4. Hungary
The primary energy consumption through RES in Hungary is 21% by the year 2030.
The existing policies forecast that the electricity-producing capacity in Hungary will be more than 4000 MW in the coming decade. The production capacity is estimated to be exceeding 6500 GWh, more than 70% of which will be harnessed through photovoltaics [20].
A recent study in Poland (which receives solar radiation of 1000 kWh/m2/year) was conducted to understand potential solar energy technology (SET) utilization, as per EU directives. Results suggested some new innovative SET applications with rotating solar towers and artificial photosynthesis [21]. RES and the cohesiveness of its production mainly revolves around supply security, energy saving, and environmental protection with sustainability. These three parameters are essential for the long-term energy independence goals of Hungary [22].
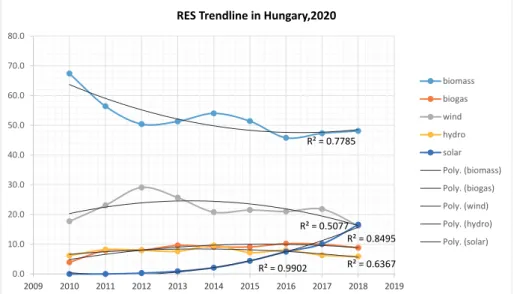
The percentage share was selected as a growth parameter to observe the recent growth in various RES production trends. The last decade’s share in percentage is depicted in Table1and Figure3. Based on the available data, analysis was performed to generate the regressive trendlines. The other significant sources, apart from solar, in Hungary are biomass, biogas, wind, and hydro. Among these sources, biomass has been a major RES in energy production over the last decade. The results show that the percentage share of biomass has reduced drastically from 67.4% to 48.1%.
Table 1.The percentage share of various RES in Hungary (2010–2018, denomination in %) (based on the data of the Hungarian Central Statistical Office).
2010 2011 2012 2013 2014 2015 2016 2017 2018
Biomass 67.4 56.4 50.4 51.3 54.0 51.4 45.8 47.3 48.1
Biogas 3.9 7.9 8.0 9.6 9.1 9.1 10.2 10.0 8.8
Wind 17.7 23.1 29.1 25.7 20.8 21.5 21.0 21.8 16.2
Hydro 6.2 8.2 8.0 7.6 9.6 7.2 8.0 6.3 5.9
Solar 0.0 0.0 0.3 0.9 2.1 4.4 7.5 10.1 16.6
Sustainability2021,13, 5462 5 of 16
Sustainability 2021, 13, x FOR PEER REVIEW 5 of 18
Table 1. The percentage share of various RES in Hungary (2010–2018, denomination in %) (based on the data of the Hungarian Central Statistical Office).
2010 2011 2012 2013 2014 2015 2016 2017 2018 Biomass 67.4 56.4 50.4 51.3 54.0 51.4 45.8 47.3 48.1
Biogas 3.9 7.9 8.0 9.6 9.1 9.1 10.2 10.0 8.8
Wind 17.7 23.1 29.1 25.7 20.8 21.5 21.0 21.8 16.2
Hydro 6.2 8.2 8.0 7.6 9.6 7.2 8.0 6.3 5.9
Solar 0.0 0.0 0.3 0.9 2.1 4.4 7.5 10.1 16.6
Figure 3. Growth trendline of solar energy share in Hungary (2010–2018) (based on the data of the Hungarian Central Statistical Office).
On the other hand, the other bio‐based source increased slightly from 3.9 to 8.8%.
Wind and hydro maintained their share. In contrast, solar energy emerged with the big‐
gest growth, from an almost negligible share to a relevant share of 16.6%. Solar share in the last decade grew from almost 0 to 16%. If the same trends are observed, it could reach more than 30% if the given conditions remain the same. Also, new technological advance‐
ments could affect long‐term goals.
2.5. Hungary as a Case Study for Solar Energy Potential
There are certain parameters which affect the solar PV potential analysis of any coun‐
try or region. Among these several factors, the solar irradiance, temperature profiles, and weather conditions play a significant role [23]. To understand the regional potential of PV‐based energy generation, geographical maps and thermal profiling could be an im‐
portant tool in making accurate predictions for the region’s energy capability [24]. Site specific irradiance forecast supported with temperature profiling helps in understanding the forecast for PV regional potential. The sum of the energy falling on a surface on earth for a given time period is called irradiation. The power or instantaneous energy rate re‐
ceived by a surface area on earth is known as irradiance, and is generally calculated on an hourly basis. The irradiance is correlated with cloud cover predictions. Thus, correct anal‐
ysis of irradiance can be considered in compliance with the sky cover [25]. For under‐
standing the irradiance distribution of the Visegrád Countries, the PV–GIS interactive tool was used to observe the distribution in the four countries [26]. The capital cities, namely Warsaw, Bratislava, Prague, and Budapest, were considered as the irradiance in the re‐
spective countries. Figure 4 gives a brief estimation of horizontal and direct irradiance values in the four countries over the period of 2005–2016. The monthly solar radiation 0
20 40 60 80
2010 2011 2012 2013 2014 2015 2016 2017 2018
% share
Year
biomass biogas
wind hydro
solar 2 per. Mov. Avg. (solar)
Figure 3.Growth trendline of solar energy share in Hungary (2010–2018) (based on the data of the Hungarian Central Statistical Office).
On the other hand, the other bio-based source increased slightly from 3.9 to 8.8%.
Wind and hydro maintained their share. In contrast, solar energy emerged with the biggest growth, from an almost negligible share to a relevant share of 16.6%. Solar share in the last decade grew from almost 0 to 16%. If the same trends are observed, it could reach more than 30% if the given conditions remain the same. Also, new technological advancements could affect long-term goals.
2.5. Hungary as a Case Study for Solar Energy Potential
There are certain parameters which affect the solar PV potential analysis of any country or region. Among these several factors, the solar irradiance, temperature profiles, and weather conditions play a significant role [23]. To understand the regional potential of PV-based energy generation, geographical maps and thermal profiling could be an important tool in making accurate predictions for the region’s energy capability [24]. Site specific irradiance forecast supported with temperature profiling helps in understanding the forecast for PV regional potential. The sum of the energy falling on a surface on earth for a given time period is called irradiation. The power or instantaneous energy rate received by a surface area on earth is known as irradiance, and is generally calculated on an hourly basis. The irradiance is correlated with cloud cover predictions. Thus, correct analysis of irradiance can be considered in compliance with the sky cover [25]. For understanding the irradiance distribution of the Visegrád Countries, the PV–GIS interactive tool was used to observe the distribution in the four countries [26]. The capital cities, namely Warsaw, Bratislava, Prague, and Budapest, were considered as the irradiance in the respective countries. Figure4gives a brief estimation of horizontal and direct irradiance values in the four countries over the period of 2005–2016. The monthly solar radiation data analysis reveals that the irradiance of Warsaw, Bratislava, and Prague lies below the range of 200 Kwh/m2, even during the peak value months. In contrast, for Budapest, Hungary, it could be observed that, during the peak irradiance months, the values cross the range of 200 Kwh/m2. The evident higher values reveal a higher solar potential of the Hungarian region.
Along with irradiation data, the performance of grid-connected PV systems also plays an important role in analyzing solar potential. The European Commission PV–GIS tool gives a monthly energy output for a fixed angle PV system. Figure5gives an estimate of energy output throughout the year in KWh. We analyzed the four nations based on their respective capital cities. It can be seen that Bratislava (Slovakia) and Budapest (Hungary) give an output of more than 125 KWh during the peak summer. Meanwhile, Warsaw
Sustainability2021,13, 5462 6 of 16
(Poland) and Prague (Czech Republic) managed to reach an output of 125 KWh during summer. The analysis is based on a database of PVGIS–SARAH with a slope angle of 35 degrees.
Sustainability 2021, 13, x FOR PEER REVIEW 6 of 18
data analysis reveals that the irradiance of Warsaw, Bratislava, and Prague lies below the range of 200 Kwh/m2, even during the peak value months. In contrast, for Budapest, Hun‐
gary, it could be observed that, during the peak irradiance months, the values cross the range of 200 Kwh/m2. The evident higher values reveal a higher solar potential of the Hungarian region.
Figure 4. Solar irradiation trendline of monthly values for optimal inclination angle in capital cities of Visegrád Countries (2005–2016) [26].
Along with irradiation data, the performance of grid‐connected PV systems also plays an important role in analyzing solar potential. The European Commission PV–GIS tool gives a monthly energy output for a fixed angle PV system. Figure 5 gives an estimate of energy output throughout the year in KWh. We analyzed the four nations based on their respective capital cities. It can be seen that Bratislava (Slovakia) and Budapest (Hun‐
gary) give an output of more than 125 KWh during the peak summer. Meanwhile, War‐
saw (Poland) and Prague (Czech Republic) managed to reach an output of 125 KWh dur‐
ing summer. The analysis is based on a database of PVGIS–SARAH with a slope angle of 35 degrees.
Figure 4.Solar irradiation trendline of monthly values for optimal inclination angle in capital cities of Visegrád Countries (2005–2016) [26].
Sustainability 2021, 13, x FOR PEER REVIEW 7 of 18
Figure 5. Performance of grid‐connected PV with energy output from a fixed angle PV system in the capital cities of Visegrad Countries (based on European Commission PV GIS analysis tool updated in 2019) [26].
3. Materials and Methods 3.1. Indicators of the Analysis
Solar energy, and especially solar power, has emerged as a major contributor in the context of renewable energy solutions. The contributions of renewable energy in the con‐
text of the sustainable growth plan of any country is significant. The role of government administration is crucial in the implementation of such policies, which favor sustainabil‐
ity. In the future, the concern is also on the creation of better bridges in the demand and supply chain of renewable energy sources. The last decade has seen a notable increase in RES, and solar energy research has been a prime investigation subject. The harnessing of solar energy potential has been discussed widely. Photovoltaics (PV) and photovoltaic‐
thermal (PV/T) modules are under investigation throughout the world. A study suggests PV/T collectors have marked better efficiency in overall efficiency considerations. This is because PV/T not only rises the temperature difference, but the water temperature en‐
hances overall efficiency. This is also a reason for higher demand of combined PV–heat pump hybrid systems [27].
Solar energy, though being one of the most sought out renewable technologies, faces many challenges. Apart from the technical and economic analysis of solar sources, a sig‐
nificant consideration is their availability. The solar radiation available on the ground, which could be utilized for electricity generation or thermal applications, is the key factor [28]. The regional potential thus becomes important in harnessing solar RES for a long‐
term plan. The two important solar setup parameters are irradiance, which is defined as the amount of solar energy falling on a given unit area per unit time (W/m2), and irradia‐
tion, which is described as the area of solar energy falling in a given period (W/m2) [29].
The estimation of these two parameters thus becomes essential in creating solar operating plants for power generation. Implementing solar energy technology in a socioeconomic context is crucial in recent times. In the future, the depletion of fossil fuels is evident. In Figure 5. Performance of grid-connected PV with energy output from a fixed angle PV system in the capital cities of Visegrad Countries (based on European Commission PV GIS analysis tool updated in 2019) [26].
Sustainability2021,13, 5462 7 of 16
3. Materials and Methods 3.1. Indicators of the Analysis
Solar energy, and especially solar power, has emerged as a major contributor in the context of renewable energy solutions. The contributions of renewable energy in the context of the sustainable growth plan of any country is significant. The role of government administration is crucial in the implementation of such policies, which favor sustainability.
In the future, the concern is also on the creation of better bridges in the demand and supply chain of renewable energy sources. The last decade has seen a notable increase in RES, and solar energy research has been a prime investigation subject. The harnessing of solar energy potential has been discussed widely. Photovoltaics (PV) and photovoltaic-thermal (PV/T) modules are under investigation throughout the world. A study suggests PV/T collectors have marked better efficiency in overall efficiency considerations. This is because PV/T not only rises the temperature difference, but the water temperature enhances overall efficiency. This is also a reason for higher demand of combined PV–heat pump hybrid systems [27].
Solar energy, though being one of the most sought out renewable technologies, faces many challenges. Apart from the technical and economic analysis of solar sources, a signif- icant consideration is their availability. The solar radiation available on the ground, which could be utilized for electricity generation or thermal applications, is the key factor [28].
The regional potential thus becomes important in harnessing solar RES for a long-term plan.
The two important solar setup parameters are irradiance, which is defined as the amount of solar energy falling on a given unit area per unit time (W/m2), and irradiation, which is described as the area of solar energy falling in a given period (W/m2) [29]. The estimation of these two parameters thus becomes essential in creating solar operating plants for power generation. Implementing solar energy technology in a socioeconomic context is crucial in recent times. In the future, the depletion of fossil fuels is evident. In such times, national energy independence is a priority for policymakers. SET as a solution supports energy security and creates a nexus of the energy market in the economy of the nation [30].
Monthly clearness indices and annual average sunshine hours can be used as pa- rameters in potential site analysis. A study of potential sites in Iran was done to develop geographic information system (GIS) maps based on horizontal radiation [31]. The compi- lation of radiation data and geospatial restrictions can help in optimal site selections for solar power plants and other solar utilities.
According to Eurostat data, energy sharing from renewable sources in the European Union rose from 10.23% in 2005 to 19.27% in 2019. For Hungary, the percentage share of renewable sources made progress from 6.93% to 12.61% in 2019 [32]. Thus, in comparison to the EU, Hungary’s needs lag behind the RES share in energy sources. SET can play a vital role in the national energy independence of the country. There are several factors which influence the SET implementation possibility, namely geographical, technical, and economic factors. In this paper, the aim is to review the recent developments in Hungary for solar power production and SET implementation prospects. The investigations involved trend assessment using the available literature and data. There are around 20 cities in Hungary, which have a populous density as consumers of power.
3.2. Data and Analysis
Curve fitting and regression analysis have long been used for data analysis. T-curve fitting works on the basic methodology of converting the available data in the form of the equation y = f(x), where x is the independent variable, y is the dependent variable, and f is the function. To understand the curve fitting’s accuracy, R2values were generated by the tools available in Excel [33].
In the last decade, numerous solar parks with small- and high-power capacity were installed throughout the country. According to the Hungarian Solar Association, the growth parameters have doubled in the last few years. The potential to unfold the capacity is much higher in comparison with its neighboring countries. Germany today has the
Sustainability2021,13, 5462 8 of 16
highest number of solar panels in the region, though Hungary’s solar radiation is 50%
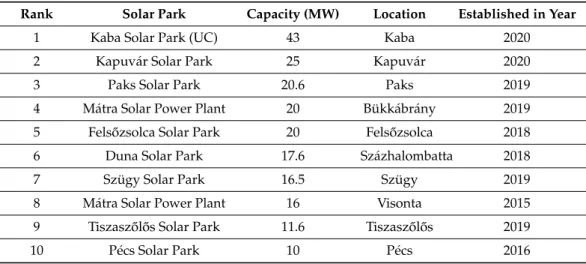
higher than that of Germany through the year [34]. Table2and Figure4represent the present list of operating solar parks with more than 10 MWp capacity. Table3and Figure5 show the list of parks with less than 10 MWp capacity. MWp or Megawatt-peak is used to measure the rated power output of a solar plant. The plant’s MW value could be lesser than the MWp value due to DC (direct current) load ratio. In general, for solar plants, the MWp values are also used to analyze the plant’s cost upfront [35]. Apart from the previously mentioned categories, several more plants are under construction. Various solar-producing groups propose solar parks in Füzesgyarmat, Tiszaújvaros, Bátonyterenye, etc.
Table 2.List of Solar parks with capacity >10 MWp in various parts of Hungary.
Rank Solar Park Capacity (MW) Location Established in Year
1 Kaba Solar Park (UC) 43 Kaba 2020
2 Kapuvár Solar Park 25 Kapuvár 2020
3 Paks Solar Park 20.6 Paks 2019
4 Mátra Solar Power Plant 20 Bükkábrány 2019
5 Fels˝ozsolca Solar Park 20 Fels˝ozsolca 2018
6 Duna Solar Park 17.6 Százhalombatta 2018
7 Szügy Solar Park 16.5 Szügy 2019
8 Mátra Solar Power Plant 16 Visonta 2015
9 Tiszasz˝ol˝os Solar Park 11.6 Tiszasz˝ol˝os 2019
10 Pécs Solar Park 10 Pécs 2016
Table 3.List of Solar parks with capacity <10 MWp in various parts of Hungary.
Rank Location Capacity M.W. Established in Year
1 Csepreg 5.5 2018
2 Vep 4.5 2018
3 Monor 4 2018
4 Sajóbábony 0.5 2016
5 Szombathely 0.385 2015
6 Bojt 0.49 2014
Tables2and3are the visualizations of ranking and share, based on capacity, in various parts of Hungary. The compilation of all this recent information on solar park developments could be used in further studies and research. The potential regional analysis could help with data visualization if such graphs and data on recent developments are available.
The opening of more solar parks brings with them a lot of potential in economic growth.
The rise of parks is coupled with competitiveness in the energy market. In addition, this newly formed market is likely to look for data analysis and relative forecast depending on the weather.
4. Results and Discussions 4.1. Regression Analysis
Observations based on growth data through regression analysis on Excel are depicted in Tables2and3. The two lines of different colors project the growth of solar parks with more than 10 MWp and less than 10 MWp capacities. This observation validates the growth potential status of solar parks in the Hungarian region.
Observations in solar power production growth with the newly developed solar parks around Hungary are discussed in the study. From 2008 to 2020, regression analysis of the data is depicted in Figure6. The values of the coefficient of determination predict
Sustainability2021,13, 5462 9 of 16
the growth potential of plants as linear. These values confirm the substantial increase of solar parks in Hungary during the specified time frame with lower boundary values. For further investigation, the power plants’ clusters were segregated into two clubs with less than 10 MWp capacity and more than 10 MWp capacity. Figure7depicts the regression analysis of two clusters separately. The study confirms the growth of larger solar parks with 10 MWp capacity if solar park development is maintained through the years to come.
The analysis provides a brief idea of the status of development in the region’s solar sector.
The data analysis could not be the only parameter for a holistic viewpoint on the country’s total solar energy development. Hence, geographical gaps in the situation were analyzed based on the regional development of parks in various areas of the nation.
Sustainability 2021, 13, x FOR PEER REVIEW 10 of 18
Figure 6. Critical regression line analysis of various RES trends in Hungary (2010–2018).
Figure 7. Critical regression line analysis of solar park future growth trends in Hungary (2010–2020).
4.2. Regional Map Analysis
Regional map analysis helps with the visualization of the current scenario of irradi‐
ance falling on the region. Global irradiance data can be a powerful tool in the accurate prediction of the solar potential of a region [36]. The global horizontal irradiation data can give a brief idea of the yearly irradiation observed in the region. Meanwhile, the optimally inclined irradiation data is based on the tilt angle for maximum output from the PV. The tilt angle is generally the latitude of the region of focus. However, though the irradiance data can help in predictions, it is also recommended to perform onsite calculations [37].
The regional maps were generated to understand the solar irradiance falling in the region R² = 0.7785
R² = 0.8495 R² = 0.5077
R² = 0.6367 R² = 0.9902
0.0 10.0 20.0 30.0 40.0 50.0 60.0 70.0 80.0
2009 2010 2011 2012 2013 2014 2015 2016 2017 2018 2019
RES Trendline in Hungary,2020
biomass biogas wind hydro solar Poly. (biomass) Poly. (biogas) Poly. (wind) Poly. (hydro) Poly. (solar)
y = 2.4366ln(x) + 2011.2 R² = 0.3594
y = 1.2814ln(x) + 2016 R² = 0.8643
2014 2015 2016 2017 2018 2019
2014 2015 2016 2017 2018 2019 2020
0 10 20 30 40 50
Time in (Years)
Time in (Years)
Size
> 10 MW
< 10 MW
Figure 6.Critical regression line analysis of various RES trends in Hungary (2010–2018).
Sustainability 2021, 13, x FOR PEER REVIEW 10 of 18
Figure 6. Critical regression line analysis of various RES trends in Hungary (2010–2018).
Figure 7. Critical regression line analysis of solar park future growth trends in Hungary (2010–2020).
4.2. Regional Map Analysis
Regional map analysis helps with the visualization of the current scenario of irradi‐
ance falling on the region. Global irradiance data can be a powerful tool in the accurate prediction of the solar potential of a region [36]. The global horizontal irradiation data can give a brief idea of the yearly irradiation observed in the region. Meanwhile, the optimally inclined irradiation data is based on the tilt angle for maximum output from the PV. The tilt angle is generally the latitude of the region of focus. However, though the irradiance data can help in predictions, it is also recommended to perform onsite calculations [37].
The regional maps were generated to understand the solar irradiance falling in the region R² = 0.7785
R² = 0.8495 R² = 0.5077
R² = 0.6367 R² = 0.9902
0.0 10.0 20.0 30.0 40.0 50.0 60.0 70.0 80.0
2009 2010 2011 2012 2013 2014 2015 2016 2017 2018 2019
RES Trendline in Hungary,2020
biomass biogas wind hydro solar Poly. (biomass) Poly. (biogas) Poly. (wind) Poly. (hydro) Poly. (solar)
y = 2.4366ln(x) + 2011.2 R² = 0.3594
y = 1.2814ln(x) + 2016 R² = 0.8643
2014 2015 2016 2017 2018 2019
2014 2015 2016 2017 2018 2019 2020
0 10 20 30 40 50
Time in (Years)
Time in (Years)
Size
> 10 MW
< 10 MW
Figure 7.Critical regression line analysis of solar park future growth trends in Hungary (2010–2020).
4.2. Regional Map Analysis
Regional map analysis helps with the visualization of the current scenario of irradi- ance falling on the region. Global irradiance data can be a powerful tool in the accurate prediction of the solar potential of a region [36]. The global horizontal irradiation data can give a brief idea of the yearly irradiation observed in the region. Meanwhile, the optimally inclined irradiation data is based on the tilt angle for maximum output from the PV. The tilt angle is generally the latitude of the region of focus. However, though the irradiance data can help in predictions, it is also recommended to perform onsite calculations [37]. The
Sustainability2021,13, 5462 10 of 16
regional maps were generated to understand the solar irradiance falling in the region of Visegrád Countries. Figure8represents the global irradiation and solar electricity potential for horizontally mounted PV modules. It was observed that Hungary receives a yearly sum of irradiation in the range of 1200–1400 KWh/m2, which is the highest range in the region. The yearly sum of electricity generation potential was also the highest, with the range of 900–1050 KWh/m2. Similarly, Figure9depicts the global irradiation for optimally inclined PV modules, with the highest observations from Hungary. Moreover, the yearly sum of irradiation was recorded as in the range of 1300–1600 KWh/m2, and the yearly sum of electricity generation potential was 975–1200 KWh/m2[38].
Sustainability 2021, 13, x FOR PEER REVIEW 11 of 18
of Visegrád Countries. Figure 8 represents the global irradiation and solar electricity po‐
tential for horizontally mounted PV modules. It was observed that Hungary receives a yearly sum of irradiation in the range of 1200–1400 KWh/m2, which is the highest range in the region. The yearly sum of electricity generation potential was also the highest, with the range of 900–1050 KWh/m2. Similarly, Figure 9 depicts the global irradiation for opti‐
mally inclined PV modules, with the highest observations from Hungary. Moreover, the yearly sum of irradiation was recorded as in the range of 1300–1600 KWh/m2, and the yearly sum of electricity generation potential was 975–1200 KWh/m2 [38].
Figure 8. Horizontally mounted PV potential in the Visegrád Countries based on global irradiation and electricity gener‐
ation data [38].
Figure 8.Horizontally mounted PV potential in the Visegrád Countries based on global irradiation and electricity generation
data [38].Sustainability 2021, 13, x FOR PEER REVIEW 12 of 18
Figure 9. Optimally inclined PV Potential in the Visegrád Countries based on global irradiation and electricity generation data [38].
To better understand the PV potential, another map analysis was performed to un‐
derstand the PV output using SOLARGIS maps available online. Figure 10 represents a long time PV potential of the regions during the period of 1994–2018. The southern regions of Slovakia represent higher values, with the overall country yearly values of 876–1241 KWh/KWp. Hungary, on the other hand, had the highest values 1095–1314 KWh/KWp. Poland and Czech Republic had a similar range of 949–1168 KWh/KWp, which is compar‐
atively lower than Slovakia or Hungary.
Figure 9.Optimally inclined PV Potential in the Visegrád Countries based on global irradiation and electricity generation data [38].
Sustainability2021,13, 5462 11 of 16
To better understand the PV potential, another map analysis was performed to under- stand the PV output using SOLARGIS maps available online. Figure10represents a long time PV potential of the regions during the period of 1994–2018. The southern regions of Slo- vakia represent higher values, with the overall country yearly values of 876–1241 KWh/KWp. Hungary, on the other hand, had the highest values 1095–1314 KWh/KWp. Poland and Czech Republic had a similar range of 949–1168 KWh/KWp, which is comparatively lower than Slovakia or Hungary.
Sustainability 2021, 13, x FOR PEER REVIEW 13 of 18
Figure 10. PV potential in the Visegrád Countries [39].
From the above analyses of regional maps, it could be understood that Hungary has the highest irradiation falling on the region. The PV output potential of the last two dec‐
ades also confirms the highest yield for Hungary. The interesting observation from Figures 8, 9, and 10 is that the southern region of Hungary has highest potential of the combined Visegrád region. The area marked in the dotted lines in all figures could be easily seen as having the highest values based on color combinations. To further investi‐
gate the current scenario, the regional map analysis of present solar parks was carried out to observe solar park clusters in various Hungarian regions. As shown in Figure 6, the presence of a solar power plant was distinguished with a blue or red color on the map, based on the power capacity. The image reveals the highest presence of parks were ob‐
served in the northern and eastern parts of Hungary. The northeast region dominates the more extensive capacity solar parks with more than 10 MWp capacity. The southern re‐
gions with counties, namely Baranya, Bács‐Kiskun, Bekes, Szeged, and Tolna, have a rel‐
atively nominal presence of solar parks for power generation. To further analyze the po‐
tential regions for better solar harnessing facilities, a temperature graph analysis study was performed with the recently available weather forecasts of the year 2020. Figure 11 shows solar park presence in various regions of Hungary based on power capacity. In that picture is also highlighted area with higher potential and with lesser solar parks.
Figure 10.PV potential in the Visegrád Countries [39].
From the above analyses of regional maps, it could be understood that Hungary has the highest irradiation falling on the region. The PV output potential of the last two decades also confirms the highest yield for Hungary. The interesting observation from Figures8–10is that the southern region of Hungary has highest potential of the combined Visegrád region. The area marked in the dotted lines in all figures could be easily seen as having the highest values based on color combinations. To further investigate the current scenario, the regional map analysis of present solar parks was carried out to observe solar park clusters in various Hungarian regions. As shown in Figure6, the presence of a solar power plant was distinguished with a blue or red color on the map, based on the power capacity. The image reveals the highest presence of parks were observed in the northern and eastern parts of Hungary. The northeast region dominates the more extensive capacity solar parks with more than 10 MWp capacity. The southern regions with counties, namely Baranya, Bács-Kiskun, Bekes, Szeged, and Tolna, have a relatively nominal presence of solar parks for power generation. To further analyze the potential regions for better solar harnessing facilities, a temperature graph analysis study was performed with the recently available weather forecasts of the year 2020. Figure11shows solar park presence in various regions of Hungary based on power capacity. In that picture is also highlighted area with higher potential and with lesser solar parks.
Sustainability2021,13, 5462 Sustainability 2021, 13, x FOR PEER REVIEW 14 of 18 12 of 16
Figure 11. Solar park presence in various regions of Hungary based on power capacity.
4.3. Performance Assessment of a Grid‐Connected PV System
The climatic conditions, other than irradiation, can sometimes be of inference in un‐
derstanding a region’s solar potential. The overall climatic changes can have severe effects on the regional potential [40]. Similar to the country‐based assessment of grid‐connected PV systems output, the regional cities of Hungary were analyzed. The graphs of monthly energy output in KWh are shown in Figures 12 and 13. Figure 12 shows the graphs for cities in the western region, and Figure 13 shows cities in the eastern region of Hungary.
The analysis is performed for a crystalline silicon‐based PV system. The slope angle con‐
sidered is 35 degrees and the azimuth angle is 0 degrees. The cities investigated for the PV output are mentioned below:
Budapest;
Debrecen;
Gyor;
Kecskemét;
Nyíregyháza;
Pecs;
Siófok;
Kekesteto.
Figure 11.Solar park presence in various regions of Hungary based on power capacity.
4.3. Performance Assessment of a Grid-Connected PV System
The climatic conditions, other than irradiation, can sometimes be of inference in understanding a region’s solar potential. The overall climatic changes can have severe effects on the regional potential [40]. Similar to the country-based assessment of grid- connected PV systems output, the regional cities of Hungary were analyzed. The graphs of monthly energy output in KWh are shown in Figures12and13. Figure12shows the graphs for cities in the western region, and Figure13shows cities in the eastern region of Hungary. The analysis is performed for a crystalline silicon-based PV system. The slope angle considered is 35 degrees and the azimuth angle is 0 degrees. The cities investigated for the PV output are mentioned below:
• Budapest;
• Debrecen;
• Gyor;
• Kecskemét;
• Nyíregyháza;
• Pecs;
• Siófok;
• Kekesteto.
Sustainability 2021, 13, x FOR PEER REVIEW 15 of 18
Figure 12. Performance of grid‐connected PV in the capital city and in West Hungary (based on European Commission PV GIS analysis tool updated in 2019).
Figure 13. Performance of grid‐connected PV in the capital city and in East Hungary (based on European Commission PV GIS analysis tool updated in 2019).
The results of the graph analysis predict similar results to the PV output. The yearly PV production range is between 1100 and 1250 KWh. The yearly plane radiation value is Figure 12.Performance of grid-connected PV in the capital city and in West Hungary (based on European Commission PV GIS analysis tool updated in 2019).
Sustainability2021,13, 5462 13 of 16
Sustainability 2021, 13, x FOR PEER REVIEW 15 of 18
Figure 12. Performance of grid‐connected PV in the capital city and in West Hungary (based on European Commission PV GIS analysis tool updated in 2019).
Figure 13. Performance of grid‐connected PV in the capital city and in East Hungary (based on European Commission PV GIS analysis tool updated in 2019).
The results of the graph analysis predict similar results to the PV output. The yearly PV production range is between 1100 and 1250 KWh. The yearly plane radiation value is Figure 13.Performance of grid-connected PV in the capital city and in East Hungary (based on European Commission PV GIS analysis tool updated in 2019).
The results of the graph analysis predict similar results to the PV output. The yearly PV production range is between 1100 and 1250 KWh. The yearly plane radiation value is in the range of 1400–1600 KWh/m2. The eastern city Kecskemét observes the highest yearly irradiation of 1543 KWh/m2. However, the overall variation is not very high, which supports the fact that eastern and southern portions of the Hungarian region have untapped potential for future solar plants.
5. Conclusions
Each country has its own available resources and own assessments on which the state authorities frame national policies. The European Commission’s NECP reports give a brief insight on the major plans of the V4 nations about increasing the renewable energy consumption share by 2030. The Czech Republic report projects a 68% increase in the heating and cooling sector, but only 17% for electricity generation using renewable energy. This approach could contradict the EU projection of 32% and become a barrier to energy entrepreneurs. Poland is working significantly on the prospects of decarbonization.
Wind energy could be a driving force in the growth of renewable usage in the energy sector. The fast development of photovoltaics landed the country the fifth position in the European continent. Slovakia has lower targets to achieve by 2030 compared to other counterparts of the Visegrád Group. The countrywide plan to shift towards renewables is commendable, especially on wind and solar productions. The self-consumer producers and small photovoltaic plants can breed nationwide with minor modifications and subsidies from state authorities. The geospatial study reveals potential in the southern ranges of Slovakia for solar potential power plants in the future. Among the four countries of the V4, Hungary reflects the highest potential in terms of irradiation and temperature profiling. The southern region of Hungary had specifically shown better results, so it may be considered an untapped potential site for future solar parks.
In Hungary, there has been a slight reduction in the share of renewable sources from the year 2013. A significant downfall in the percentage of biomass-based energy share has been observed and, in contrast, a soaring high in solar-based power plants. In the study, data regression analysis was performed on available statistics to verify the data’s
Sustainability2021,13, 5462 14 of 16
fitting curves. The results are promising regarding solar power production in the future. In the regional map study, exciting insights were revealed in the map analysis, which was carried out to understand the distribution of power plants set up around the nation. It could be observed that there is a cluster of solar parks with more enormous capacities in the northeastern region. Very few power plants could be seen in the lower southern parts of the country. The study recommends utilization of the untapped potential of the southern and eastern parts of the country. The yearly irradiation values reflected that eastern cities of Hungary also have similar PV outputs as western and northern cities. These profiles were produced from the PV–GIS tool of the European Commission, which was last updated in the year 2019. A similar analysis could be done for the sky clarity index for Hungary’s southern region and eastern cities. This data analysis could be helpful for government agencies and industrial observers for potential unmasking opportunities.
Author Contributions: Data curation, G.S., Z. ˇC., and L.B.; formal analysis, B.K., M.K., Z.P., and Z.S.; funding acquisition, Z. ˇC. and M.K.; investigation, B.K., L.B., and Z.S.; methodology, B.K., Z. ˇC., and Z.S.; project administration, G.S. and M.K.; resources, G.S.; validation, Z.P.; visualization, Z.P.;
writing—original draft, B.K. and Z. ˇC. All authors have read and agreed to the published version of the manuscript.
Funding:This research was funded by Slovak Research and Development Agency: APVV-19-0576 and Ministry of Education, Science, Research and Sport of the Slovak Republic and the Slovak Academy of Sciences: VEGA 1/0757/21.
Institutional Review Board Statement:Not applicable.
Informed Consent Statement:Not Applicable.
Data Availability Statement:The data of the Hungarian Central Statistical Office is downloaded from the free-access STADAT system, available at: https://www.ksh.hu/engstadat?lang=en (accessed on 1 May 2021).
Conflicts of Interest:The authors declare no conflict of interest.
Abbreviations
EU European union MWp Megawatt peak
NECP National Energy and climate plans RES Renewable Energy sources GDP Gross Development product PV Photovoltaic
TWh Terawatt-hour
MW Megawatt
GW Gigawatt
EUR Euro
RES Renewable energy sources SET Solar energy technology PV/T Photovoltaic thermal
GIS Geographic information system
References
1. Latawski, P. On Converging Paths? The Visegrad Group and the Atlantic Alliance.Paradigms1993,7, 78–93. [CrossRef]
2. Khanam, T.; Rahman, A.; Mola-Yudego, B.; Pelkonen, P.; Perez, Y.; Pykäläinen, J. Achievable or unbelievable? Expert perceptions of the European Union targets for emissions, renewables, and efficiency.Energy Res. Soc. Sci.2017,34, 144–153. [CrossRef]
3. European Commission. 2030 Climate & Energy Framework. Available online:https://ec.europa.eu/clima/policies/strategies/
2030_en(accessed on 1 May 2021).
4. Nosko, A.; Orban, A.; Paczynski, W.; Cernoch, F.; Jaros, J. Energy Security. Policy Paper, Visegrad Security Cooperation Initiative.
2010. Available online:https://www.visegradgroup.eu/download.php?docID=139html(accessed on 13 May 2021).
5. European Commission. NECP HUNGARY. 2018. Available online:https://ec.europa.eu/energy/sites/ener/files/documents/
ec_courtesy_translation_hu_necp.pdf(accessed on 2 May 2021).
![Figure 1. Share of energy from renewable sources in final gross consumption of energy in V4 Countries NECP and future expectations by 2030 [9].](https://thumb-eu.123doks.com/thumbv2/9dokorg/758337.32710/2.892.259.725.652.912/figure-share-energy-renewable-sources-consumption-countries-expectations.webp)
![Figure 2. Renewable energy share growth by percentage in V4 Countries [9].](https://thumb-eu.123doks.com/thumbv2/9dokorg/758337.32710/3.892.257.760.316.506/figure-renewable-energy-share-growth-percentage-v-countries.webp)


![Figure 4. Solar irradiation trendline of monthly values for optimal inclination angle in capital cities of Visegrád Countries (2005–2016) [26].](https://thumb-eu.123doks.com/thumbv2/9dokorg/758337.32710/6.892.94.798.214.625/figure-irradiation-trendline-monthly-optimal-inclination-visegrád-countries.webp)
![Figure 9. Optimally inclined PV Potential in the Visegrád Countries based on global irradiation and electricity generation data [38].](https://thumb-eu.123doks.com/thumbv2/9dokorg/758337.32710/10.892.129.762.730.1102/optimally-inclined-potential-visegrád-countries-irradiation-electricity-generation.webp)
![Figure 10. PV potential in the Visegrád Countries [39].](https://thumb-eu.123doks.com/thumbv2/9dokorg/758337.32710/11.892.106.791.299.707/figure-pv-potential-visegrád-countries.webp)

