Consumption of tetracyclines, sulphonamides and trimethoprim, and other antibacterials in the community, European Union/European
Economic Area, 1997–2017
Ann Versporten1*†, Robin Bruyndonckx 1,2†, Niels Adriaenssens1,3, Niel Hens2,4, Dominique L. Monnet5, Geert Molenberghs2,6, Herman Goossens1, Klaus Weist5and Samuel Coenen 1,3
on behalf of the ESAC-Net study group‡
1Laboratory of Medical Microbiology, Vaccine & Infectious Disease Institute (VAXINFECTIO), University of Antwerp, Antwerp, Belgium;
2Interuniversity Institute for Biostatistics and statistical Bioinformatics (I-BIOSTAT), Data Science Institute, Hasselt University, Hasselt, Belgium;3Centre for General Practice, Department of Family Medicine & Population Health (FAMPOP), University of Antwerp, Antwerp,
Belgium;4Centre for Health Economic Research and Modelling Infectious Diseases, Vaccine & Infectious Disease Institute (VAXINFECTIO), University of Antwerp, Antwerp, Belgium;5Disease Programmes Unit, European Centre for Disease Prevention and Control, Stockholm, Sweden;6Interuniversity Institute for Biostatistics and Statistical Bioinformatics (I-BIOSTAT), Catholic University of
Leuven, Leuven, Belgium
*Corresponding author. E-mail: ann.versporten@uantwerpen.be
†These authors contributed equally to this work.
‡Members are listed in the Acknowledgements section.
Objectives: Data on consumption of tetracyclines, sulphonamides and trimethoprim, and other antibacterials were collected from 30 EU/European Economic Area (EEA) countries over two decades. This article reviews tem- poral trends, seasonal variation, presence of change-points and changes in the composition of main subgroups of tetracyclines, sulphonamides and trimethoprim and other antibacterials.
Methods: For the period 1997–2017, data on consumption of tetracyclines (ATC group J01A), sulphonamides and trimethoprim (ATC group J01E), and other antibacterials (ATC group J01X) in the community and aggregated at the level of the active substance, were collected using the WHO ATC/DDD methodology (ATC/DDD index 2019). Consumption was expressed in DDD per 1000 inhabitants per day and in packages per 1000 inhabitants per day. Consumption of tetracyclines, sulphonamides and trimethoprim, and other antibacterials was analysed based on ATC-4 subgroups and presented as trends, seasonal variation, presence of change-points and compos- itional changes.
Results: In 2017, consumption of tetracyclines, sulphonamides and trimethoprim, and other antibacterials in the community expressed in DDD per 1000 inhabitants per day varied considerably between countries. Between 1997 and 2017, consumption of tetracyclines did not change significantly, while its seasonal variation signifi- cantly decreased over time. Consumption of sulphonamides and trimethoprim significantly decreased until 2006, and its seasonal variation significantly decreased over time. The consumption of other antibacterials showed no significant change over time or in seasonal variation.
Conclusions:Consumption and composition of tetracyclines, sulphonamides and trimethoprim, and other anti- bacterials showed wide variations between EU/EEA countries and over time. This represents an opportunity to further reduce consumption of these groups in some countries and improve the quality of their prescription.
Introduction
This article presents data from the European Surveillance of Antimicrobial Consumption Network (ESAC-Net,1formerly ESAC) on consumption of tetracyclines, sulphonamides and trimetho- prim, and other antibacterials in the community (i.e. primary care
sector) for 30 EU/European Economic Area (EEA) countries in 2017 (Table1). It updates a previous ESAC study published in 2011, and in doing so it provides updated comparable and reliable information on antibiotic consumption that can aid in fighting the global problem of antimicrobial resistance.2In 2017, tetracyclines, sulphonamides
VC The Author(s) 2021. Published by Oxford University Press on behalf of the British Society for Antimicrobial Chemotherapy.
This is an Open Access article distributed under the terms of the Creative Commons Attribution License (http://creativecommons.org/licenses/
by/4.0/), which permits unrestricted reuse, distribution, and reproduction in any medium, provided the original work is properly cited.
J Antimicrob Chemother
2021;
76Suppl 2: ii45–ii59 doi:10.1093/jac/dkab177
Downloaded from https://academic.oup.com/jac/article/76/Supplement_2/ii45/6328685 by 81728827 user on 20 October 2021
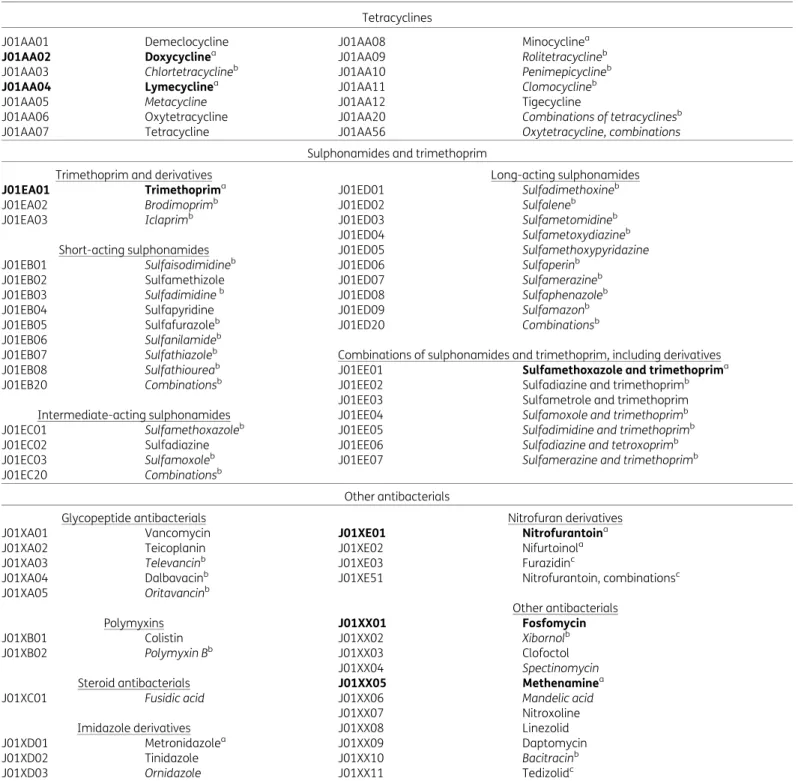
Table 1. Classification of tetracyclines (J01A), sulphonamides and trimethoprim (J01E), and other antibacterials (J01X; ATC/DDD index 2019) Tetracyclines
J01AA01 Demeclocycline J01AA08 Minocyclinea
J01AA02 Doxycyclinea J01AA09 Rolitetracyclineb
J01AA03 Chlortetracyclineb J01AA10 Penimepicyclineb
J01AA04 Lymecyclinea J01AA11 Clomocyclineb
J01AA05 Metacycline J01AA12 Tigecycline
J01AA06 Oxytetracycline J01AA20 Combinations of tetracyclinesb
J01AA07 Tetracycline J01AA56 Oxytetracycline, combinations
Sulphonamides and trimethoprim
Trimethoprim and derivatives Long-acting sulphonamides
J01EA01 Trimethoprima J01ED01 Sulfadimethoxineb
J01EA02 Brodimoprimb J01ED02 Sulfaleneb
J01EA03 Iclaprimb J01ED03 Sulfametomidineb
J01ED04 Sulfametoxydiazineb
Short-acting sulphonamides J01ED05 Sulfamethoxypyridazine
J01EB01 Sulfaisodimidineb J01ED06 Sulfaperinb
J01EB02 Sulfamethizole J01ED07 Sulfamerazineb
J01EB03 Sulfadimidineb J01ED08 Sulfaphenazoleb
J01EB04 Sulfapyridine J01ED09 Sulfamazonb
J01EB05 Sulfafurazoleb J01ED20 Combinationsb
J01EB06 Sulfanilamideb
J01EB07 Sulfathiazoleb Combinations of sulphonamides and trimethoprim, including derivatives
J01EB08 Sulfathioureab J01EE01 Sulfamethoxazole and trimethoprima
J01EB20 Combinationsb J01EE02 Sulfadiazine and trimethoprimb
J01EE03 Sulfametrole and trimethoprim
Intermediate-acting sulphonamides J01EE04 Sulfamoxole and trimethoprimb
J01EC01 Sulfamethoxazoleb J01EE05 Sulfadimidine and trimethoprimb
J01EC02 Sulfadiazine J01EE06 Sulfadiazine and tetroxoprimb
J01EC03 Sulfamoxoleb J01EE07 Sulfamerazine and trimethoprimb
J01EC20 Combinationsb
Other antibacterials
Glycopeptide antibacterials Nitrofuran derivatives
J01XA01 Vancomycin J01XE01 Nitrofurantoina
J01XA02 Teicoplanin J01XE02 Nifurtoinola
J01XA03 Televancinb J01XE03 Furazidinc
J01XA04 Dalbavacinb J01XE51 Nitrofurantoin, combinationsc
J01XA05 Oritavancinb
Other antibacterials
Polymyxins J01XX01 Fosfomycin
J01XB01 Colistin J01XX02 Xibornolb
J01XB02 Polymyxin Bb J01XX03 Clofoctol
J01XX04 Spectinomycin
Steroid antibacterials J01XX05 Methenaminea
J01XC01 Fusidic acid J01XX06 Mandelic acid
J01XX07 Nitroxoline
Imidazole derivatives J01XX08 Linezolid
J01XD01 Metronidazolea J01XX09 Daptomycin
J01XD02 Tinidazole J01XX10 Bacitracinb
J01XD03 Ornidazole J01XX11 Tedizolidc
Bold typeindicates that consumption was part of the top 90% of the community consumption of tetracyclines (J01A), sulphonamides and trimetho- prim (J01E), or other antibacterials (J01X) in 28 EU/EEA countries in 2017;Italic typeindicated that no consumption of this antibiotic was reported in 28 EU/EEA countries in 2017.
aConsumption was part of the top 90% of the community consumption of tetracyclines (J01A), sulphonamides and trimethoprim (J01E), or other antibacterials (J01X) in 30 EU/EEA countries in 2009.
bNo consumption of this antibiotic was reported in 30 EU/EEA countries in 2009.
cThis antibiotic was not included in the ATC/DDD index in 2009 and was therefore not reported in 2009.
Downloaded from https://academic.oup.com/jac/article/76/Supplement_2/ii45/6328685 by 81728827 user on 20 October 2021
and trimethoprim, and other antibacterials represented 11.3%, 2.9% and 6.1% of total antibiotic consumption in the community, respectively.3The objective of this study was to analyse temporal trends, seasonal variation and the presence of change-points in consumption of tetracyclines, sulphonamides and trimethoprim, and other antibacterials for the period 1997–2017 in the commu- nity as well as to analyse their composition over time.
Methods
The methods for collecting and analysing the data are described in the introductory article of this series.4In summary, data on consumption of tet- racyclines, i.e. Anatomical Therapeutic Chemical (ATC) group J01A, sulpho- namides and trimethoprim (ATC group J01E), and other antibacterials (ATC group J01X) in the community and aggregated at the level of the active substance, were collected using the WHO ATC/DDD methodology (ATC/DDD index 20195) and expressed in DDD per 1000 inhabitants per day. In add- ition, where data were available, consumption was also expressed in packages per 1000 inhabitants per day. There are 14, 33 and 26 unique ATC codes for tetracyclines, sulphonamides and trimethoprim, and other antibacterials, respectively, in the ATC/DDD index 2019. Compared with previous descriptions of the consumption of other antibacterials in the community, two additional nitrofuran derivatives, i.e. furazidin (J01XE03) and nitrofurantoin, combinations (J01XE51), and one additional other antibacterial substance, i.e. tedizolid (J01XX11), have been assigned an ATC code by the WHO (Table1).2
The evolution of the number of DDD per package over time was assessed using a linear mixed model. The temporal trend, seasonal vari- ation and presence of change-points for tetracyclines, sulphonamides and trimethoprim and other antibacterials were assessed using a non-linear change-point mixed model fitted to quarterly data expressed in DDD per 1000 inhabitants per day from 1997 to 2017.6The relative proportions of
the main subgroups for sulphonamides and trimethoprim, and other anti- bacterials were assessed through a compositional data analysis modelling yearly data expressed in DDD per 1000 inhabitants per day from 1997 to 2017.7
Results
TetracyclinesAn overview of consumption of tetracyclines (ATC J01A) in the community, expressed in DDD and packages per 1000 inhabitants per day for all participating countries between 1997 and 2017 is available asSupplementary dataatJACOnline (TablesS1 and S2, respectively).
Consumption of tetracyclines in the community in 2017 In 2017, two substances accounted for 90% of consumption of tetracyclines in the community expressed in DDD per 1000 inhabi- tants per day: doxycycline (75.8% in 2017 compared with 74.9% in 2009) and lymecycline (14.8% in 2017 compared with 10.2% in 2009) (Table1).
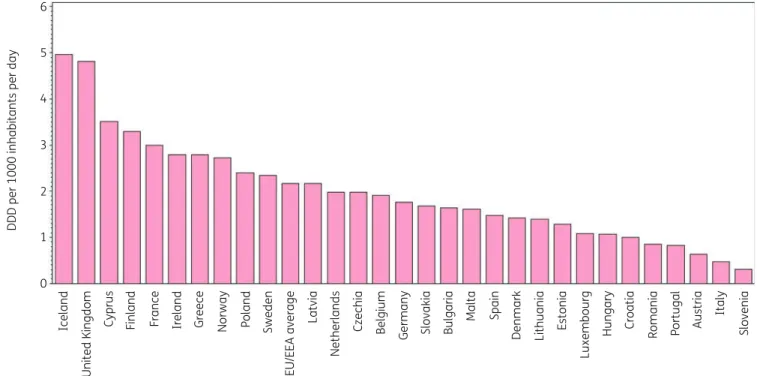
Figure1shows the consumption of tetracyclines in the commu- nity expressed in DDD per 1000 inhabitants per day in 2017, which varied by factor 16 between countries with the highest (5.0 DDD per 1000 inhabitants per day in Iceland) and the lowest (0.3 DDD per 1000 inhabitants per day in Slovenia) consumption. This was higher than in 2009 (factor of 10, from 5.1 DDD per 1000 inhabitants per day in Iceland to 0.5 DDD per 1000 inhabitants per day in Italy).
Doxycycline was the only tetracycline prescribed in Croatia, Lithuania and Slovenia and it represented >50% of consumption
6
5
4
3
DDD per 1000 inhabitants per day
2
1
0
Iceland United Kingdom Cyprus Finland France Ireland Greece Norway Poland Sweden EU/EEA average Latvia Netherlands Czechia Belgium Germany Slovakia Malta Spain Denmark Lithuania Estonia Luxembourg Hungary Croatia Romania Portugal Italy SloveniaAustriaBulgaria
Figure 1. Consumption of tetracyclines (ATC J01A) in the community, expressed in DDD (ATC/DDD index 2019) per 1000 inhabitants per day, 30 EU/
EEA countries, 2017. For Czechia, 2015 data are used. For Slovakia, 2016 data are used. For Cyprus and Romania, total care data, i.e. community and hospital sector combined, are used.
Tetracyclines, sulphonamides, trimethoprim and other community consumption, 1997–2017 JAC
Downloaded from https://academic.oup.com/jac/article/76/Supplement_2/ii45/6328685 by 81728827 user on 20 October 2021
of tetracyclines in the community in all but four countries (Belgium, Denmark, Sweden and the United Kingdom, where its consumption represented >30%). Lymecycline was the most consumed in Sweden (51.5% of consumption of tetracyclines in the community), and represented >30% in Belgium, Norway and the United Kingdom, and >20% in Austria, Denmark, Ireland and Finland. Minocycline represented >20% of consumption of tet- racyclines in the community in Belgium, Luxembourg and Malta.
The substance tetracycline (J01AA07) was the most consumed in Denmark (34.6%) and represented >10% in Finland, Norway and Romania (total care data, i.e. community and hospital sector com- bined). Tigecycline for parenteral use was consumed in the community in six countries ranging from 0.006 DDD per 1000 inhabitants per day in Greece to 0.001 DDD per 1000 inhabitants per day in Malta.
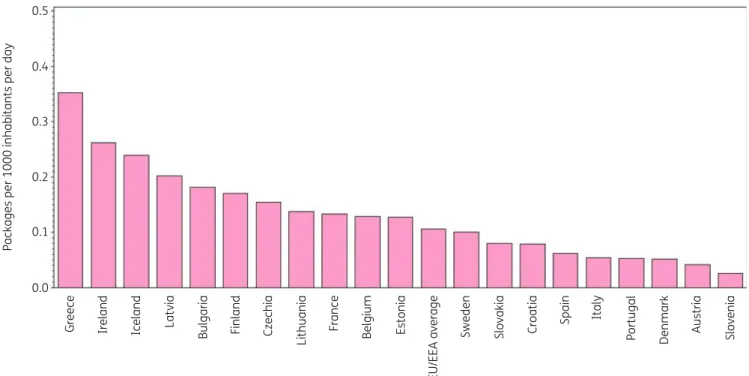
Figure2shows consumption of tetracyclines in the community expressed in packages per 1000 inhabitants per day for 20 EU/EEA countries in 2017. Bulgaria ranked 11th for its consump- tion of tetracyclines in DDD per 1000 inhabitants per day and 5th in packages per 1000 inhabitants per day, Lithuania 14th and 8th, France 3rd and 9th, Sweden 6th and 12th, and Denmark 13th and 18th, respectively (Table2). Consequently, the lowest mean number of DDD per package was found in Bulgaria (9 DDD per package) and Lithuania (10.2 DDD per pack- age), the highest in France (22.6 DDD per package), Sweden (23.5 DDD per package) and Denmark (27.5 DDD per package).
The number of DDD per package ranged from 7.9 in Greece to 27.5 in Denmark and was higher than in 2009 (from 6.3 in Bulgaria to 22.8 in Denmark). In the EU/EEA countries, the num- ber of DDD per package did not change significantly over time during 1997–2017.
Longitudinal data analysis, 1997–2017
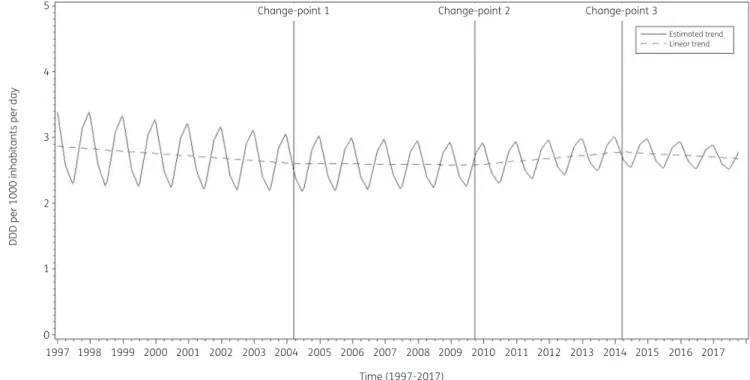
The best fit was obtained for a model including three change- points: one in the first quarter of 2004, another in the third quarter of 2009 and a third one in the first quarter of 2014. The final model fits the observed data well (Figure S1). The longitudinal data analysis estimated an average consumption of tetracyclines of 2.875 (SE 0.356) DDD per 1000 inhabitants per day in the first quar- ter of 1997, which did not change significantly over time:#0.009 (SE 0.008) DDD per 1000 inhabitants per day per quarter until the first quarter of 2004, then#0.001 (SE 0.011) DDD per 1000 inhabi- tants per day per quarter until the third quarter of 2009, then
!0.011 (SE 0.016) DDD per 1000 inhabitants per day per quarter until the first quarter or 2014, and finally#0.007 (SE 0.020) DDD per 1000 inhabitants per day per quarter. A statistically significant seasonal variation was observed with an amplitude of 0.598 (SE 0.056) DDD per 1000 inhabitants per day, which decreased sig- nificantly over time by 0.005 (SE 0.001) DDD per 1000 inhabitants per day per quarter (Figure3).
Based on the fitted model, consumption of tetracyclines in the community in 1997 was significantly higher than average in Belgium, Finland, Iceland, Latvia and Poland, and significantly lower than average in Austria, Croatia, Denmark, Italy, Portugal, Slovakia, Slovenia and Spain (observed profiles shown in FigureS2 andS3). The seasonal variation was significantly larger than aver- age in Belgium, Finland, Iceland, the Netherlands, Poland and Sweden, and significantly smaller than average in Denmark, Greece, Ireland, Italy, Portugal, Slovenia, Spain and the United Kingdom. The decrease in consumption of tetracyclines in the community between 1997 and the first quarter of 2004 was sig- nificantly higher than average in Belgium, Finland, Hungary and Portugal. The decrease in consumption of tetracyclines between 0.5
0.4
0.3
Packages per 1000 inhabitants per day
0.2
0.1
0.0
Greece Ireland Iceland Latvia Bulgaria Finland Czechia Lithuania France Belgium Estonia EU/EEA average Sweden Slovakia Croatia Spain Italy Portugal Denmark Austria Slovenia
Figure 2. Consumption of tetracyclines (ATC J01A) in the community, expressed in packages per 1000 inhabitants per day, 20 EU/EEA countries in 2017. For Czechia, 2015 data are used. For Slovakia, 2016 data are used. For Cyprus and Romania, total care data, i.e. community and hospital sector combined, are used.
Downloaded from https://academic.oup.com/jac/article/76/Supplement_2/ii45/6328685 by 81728827 user on 20 October 2021
the second quarter of 2004 and the third quarter of 2009 was significantly larger than average in Czechia, Ireland, Latvia and Slovakia. The increase in consumption of tetracyclines between the fourth quarter of 2009 and the first quarter of 2014 was signifi- cantly larger than average in the United Kingdom. The decrease in consumption of tetracyclines between the second quarter of 2014 and 2017 was significantly higher than average in Finland.
Between 2009 and 2017, consumption of tetracyclines increased in 12 countries (TableS1). The largest increases were observed for Greece, Spain (including private prescriptions from 2016 onwards) and the United Kingdom, while the largest decreases were observed for Estonia, Germany and Luxembourg.
The increase in consumption of tetracyclines was mainly the result of the increase in doxycycline consumption. For Malta, a substan- tial increase in lymecycline consumption was also observed. As in 2009, Italy had the lowest consumption of tetracyclines in 2017.
Compositional data analysis (1997–2017)
For the tetracyclines, grouping into subgroups is not available from the ATC classification5and variation in the consumption among the different tetracycline substances was not assessed.
Sulphonamides and trimethoprim
An overview of consumption of sulphonamides and trimethoprim (ATC J01E) in the community, expressed in DDD and packages per 1000 inhabitants per day for all participating countries between 1997 and 2017 is available asSupplementary data(TablesS3 and S4, respectively).
Consumption of sulphonamides and trimethoprim in 2017 In 2017, the two most used substances accounted for 90% of the consumption of sulphonamides and trimethoprim in the community expressed in DDD per 1000 inhabitants per day: sulfa- methoxazole and trimethoprim (65.8% in 2017 compared with 67.7% in 2009) and trimethoprim (29.4% in 2017 compared with 29.8% in 2009) (Table1).
Figure 4 shows the consumption of sulphonamides and trimethoprim in the community expressed in DDD per 1000 inhabi- tants per day in 2017. Consumption of sulphonamides and trimethoprim varied by a factor of 105 between countries with the highest (1.04 DDD per 1000 inhabitants per day in the United Kingdom) and the lowest (0.01 DDD per 1000 inhabitants per day in Lithuania) consumption (TableS3), which was lower than in 2009 (factor of 203, from 1.18 DDD per 1000 inhabitants per day in the United Kingdom to 0.006 DDD per 1000 inhabitants per day in Lithuania).
For six countries (Belgium, Bulgaria, Croatia, Hungary, Italy and Luxembourg), consumption of sulphonamides and trimethoprim in the community was represented by a single substance, namely sulfamethoxazole plus trimethoprim (J01EE01). In another eight countries, combinations of sulphonamides and trimethoprim, including derivatives (J01EE) represented >90% of the consump- tion of sulphonamides and trimethoprim in the community, and it represented >80% of this consumption in Germany and Poland.
In Ireland and Lithuania, consumption of sulphonamides and trimethoprim in the community was only represented by trime- thoprim (J01EA01). Trimethoprim also represented >90% of Table2.Rankingofconsumptionoftetracyclines(ATCJ01A)inthecommunity,expressedinDDDsorpackagesper1000inhabitantsperday,20EU/EEAcountriesin2017 CountryGreeceIrelandIcelandLatviaBulgariaFinlandCzechiaLithuaniaFranceBelgiumEstoniaSwedenSlovakiaCroatiaSpainItalyPortugalDenmarkAustriaSlovenia Rankingfor packagesper 1000inhabitants perday
1234567891011121314151617181920 Rankingfor DDDper 1000inhabitants perday 5417112814391561016121917131820 Numberof DDDper package
7.910.720.710.79.019.312.810.222.614.910.123.520.812.623.68.815.627.515.311.8 ForCzechia,2015dataareused.ForSlovakia,2016dataareused.ForCyprusandRomania,totalcaredata,i.e.communityandhospitalsectorcombined,areused.
Tetracyclines, sulphonamides, trimethoprim and other community consumption, 1997–2017 JAC
Downloaded from https://academic.oup.com/jac/article/76/Supplement_2/ii45/6328685 by 81728827 user on 20 October 2021
consumption of sulphonamides and trimethoprim in the commu- nity in Iceland, >80% in the United Kingdom, >70% in Denmark and Finland and >50% in Austria. Denmark was the only country consuming a substantial proportion of short-acting sulphona- mides (>20%, sulfamethizole). The highest consumption of inter- mediate-acting sulphonamides (sulfadiazine) was found in Malta (>30%), followed by Iceland and France (>5%), and Cyprus (total care data) and Germany (>1%). Consumption of sulfadiazine was
<1% in six countries and no consumption of this substance was reported for 14 countries. In 2017, no country consumed long-act- ing sulphonamides in the community.
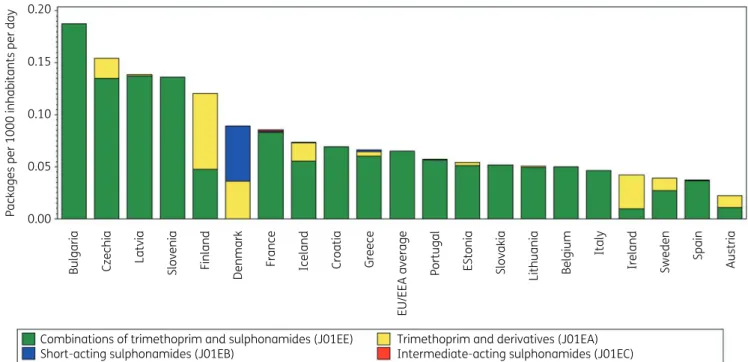
Figure 5 shows the consumption of sulphonamides and tri- methoprim in the community expressed in packages per 1000 inhabitants per day for 20 EU/EEA countries in 2017. In addition, country ranking is depicted according to both DDD and packages per 1000 inhabitants per day in 2017 (Table3). The number of DDD per package ranged from 0.2 in Lithuania to 22.9 in Slovakia (2016 data). A high number of DDD per package was associated with a
higher ranking of consumption expressed in DDD per 1000 inhabi- tants per day than in packages per 1000 inhabitants per day.
Slovakia (2016 data) and Ireland, for example, had a higher rank- ing in DDD than in packages per 1000 inhabitants per day because of the high number of DDD per package. Conversely, Iceland and Lithuania, for example, had a lower ranking in DDD than in pack- ages per 1000 inhabitants per day because of low number of DDD per package. In the EU/EEA countries, the number of DDD per pack- age did not change significantly over time during 1997–2017.
Longitudinal data analysis, 1997–2017
The best fit was obtained for a model including two change-points:
one in the third quarter of 2006 and another in the second quarter of 2009. The final model fits the observed data well (FigureS4).
The longitudinal data analysis estimated an average consumption of sulphonamides and trimethoprim in the EU/EEA of 1.767 (SE 0.283) DDD per 1000 inhabitants per day in the first quarter of
5 Change-point 1 Change-point 2 Change-point 3
Estimated trend Linear trend
4
DDD per 1000 inhabitants per day
3
2
1
0
1997 1998 1999 2000 2001 2002 2003 2004 2005 2006 2007 2008 Time (1997-2017)
2009 2010 2011 2012 2013 2014 2015 2016 2017
Parameter
Estimate (std. error)
2.875 (0.356)*
–0.009 (0.008)
0.008 (0.010)
0.012 (0.012)
–0.018 (0.013)
0.598 (0.056)*
–0.005 (0.001)*
0.514 (0.021)*
b0 b1 b2 b3 b4 bS0 bS1 d
Figure 3. Estimated trend (solid line) and linear trend (dashed line) of consumption of tetracyclines (ATC J01A) in the community based on quarterly data, 25 EU/EEA countries, 1997–2017.b0, predicted consumption in the first quarter of 1997;b1, predicted increase (if positive)/decrease (if negative) in consumption per quarter;b2, predicted difference in slope after versus before the first change-point;b3, predicted difference in slope after versus before the second change-point;b4, predicted difference in slope after versus before the third change-point;b0S, predicted amplitude of the upward winter and downward summer peak in consumption;b1S, predicted increase (if positive)/decrease (if negative) of the amplitude of the upward winter and downward summer peak in consumption per quarter;d, shift in timing of the upward winter and downward summer peak from one year to an- other. An asterisk indicates the result was statistically significant at significance level 0.05.
Downloaded from https://academic.oup.com/jac/article/76/Supplement_2/ii45/6328685 by 81728827 user on 20 October 2021
1.2 1.0 0.8 0.6
DDD per 1000 inhabitants per day
0.4 0.2 0.0
Combinations of trimethoprim and sulphonamides (J01EE) Short-acting sulphonamides (J01EB)
Trimethoprim and derivatives (J01EA) Intermediate-acting sulphonamides (J01EC)
Slovakia Finland CzechiaIreland Romania Bulgaria Latvia Italy Norway Luxembourg Croatia Poland Germany Hungary Spain Netherlands Estonia France Portugal Malta Greece Cyprus Sweden Austria Iceland Belgium Lithuania
EU/EEA average
Denmark
United Kingdom
Figure 4. Consumption of sulphonamides and trimethoprim (ATC J01E) in the community, expressed in DDD (ATC/DDD index 2019) per 1000 inhabi- tants per day, 30 EU/EEA countries, 2017. For Czechia, 2015 data are used. For Slovakia, 2016 data are used. For Cyprus and Romania, total care data, i.e. community and hospital sector combined, are used.
0.20
0.15
0.10
Packages per 1000 inhabitants per day
0.05
0.00
Combinations of trimethoprim and sulphonamides (J01EE) Short-acting sulphonamides (J01EB)
Trimethoprim and derivatives (J01EA) Intermediate-acting sulphonamides (J01EC)
Bulgaria Latvia
Czechia Slovenia Finland Denmark France Iceland Croatia Greece EU/EEA average Portugal EStonia Slovakia Lithuania Belgium Italy Ireland Sweden Spain Austria
Figure 5. Consumption of sulphonamides and trimethoprim (ATC J01E) in the community, expressed in packages per 1000 inhabitants per day, 20 EU/EEA countries, 2017. For Czechia, 2015 data are used. For Slovakia, 2016 data are used. For Cyprus and Romania, total care data, i.e. community and hospital sector combined, are used.
Tetracyclines, sulphonamides, trimethoprim and other community consumption, 1997–2017 JAC
Downloaded from https://academic.oup.com/jac/article/76/Supplement_2/ii45/6328685 by 81728827 user on 20 October 2021
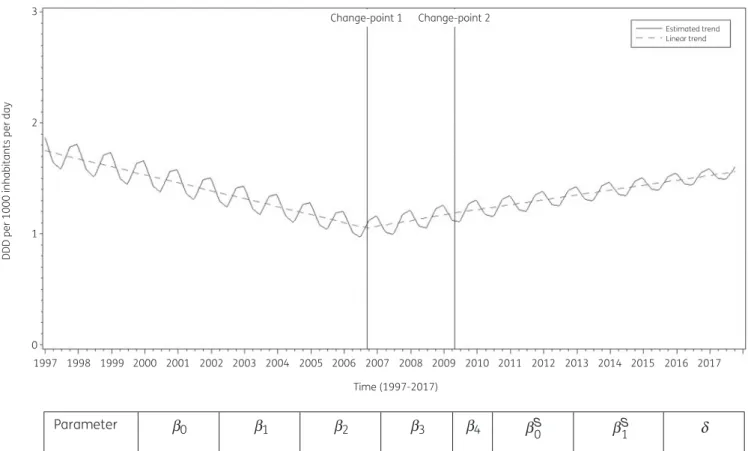
1997, which significantly decreased by#0.018 (SE 0.009) DDD per 1000 inhabitant per day per quarter until the third quarter of 2006.
After the first change-point, consumption of sulphonamides and trimethoprim did not change significantly;!0.013 (SE 0.015) DDD per 1000 inhabitants per day per quarter up to the second quarter of 2009, then!0.010 (SE 0.016) DDD per 1000 inhabitants per day per quarter. A statistically significant seasonal variation was observed with an amplitude of 0.147 (SE 0.028) DDD per 1000 inhabitants per day, which decreased significantly over time by 0.001 (SE 0.0002) DDD per 1000 inhabitants per day per quarter (Figure6).
Based on the fitted model, consumption of sulphonamides and trimethoprim in the community in 1997 was significantly larger than average in Iceland, Latvia and Poland, and significantly smaller than average in Austria, Belgium, Denmark, Germany, Ireland, Italy, Luxembourg, the Netherlands, Portugal, Slovenia, Spain, Sweden and the United Kingdom (observed profiles shown in Figures S5and S6). The seasonal variation was significantly larger than average in Czechia, Hungary, Latvia and Poland, and significantly smaller than average in Austria, Denmark, the Netherlands, Portugal, Spain, Sweden and the United Kingdom.
The decrease in consumption of sulphonamides and trimethoprim in the community between 1997 and the third quarter of 2006 was significantly larger than average in Latvia and Poland. The in- crease in consumption of sulphonamides and trimethoprim be- tween the last quarter of 2006 and the second quarter of 2009 was significantly larger than average in Latvia.
Compositional data analysis, 1997–2017
Although consumption of sulphonamides and trimethoprim in the community significantly decreased over time until 2006 and later remained stable, the proportional consumption of trimethoprim and derivatives (J01EA) significantly increased relative to that of all other subgroups of sulphonamides and trimethoprim. The propor- tional consumption of long-acting sulphonamides (J01ED) signifi- cantly decreased relative to that of all other subgroups of sulphonamides and trimethoprim. In addition, the proportional consumption of short-acting sulphonamides (J01EB) significantly decreased relative to that of intermediate-acting sulphonamides (J01EC) and of sulphonamides and trimethoprim, including deriva- tives (J01EE) (Table4).
Trends of proportional consumption in individual countries are shown in FigureS7. When comparing the composition of the con- sumption of sulphonamides and trimethoprim in 2017 with that in 2009, we focused on countries reporting consumption in both years (i.e. all countries except Belgium and Slovenia). For the pro- portion of trimethoprim and derivatives (J01EA), both increases and decreases were observed. The largest increases were observed for Iceland (!40.32%), Ireland (!26.40%) and Poland (!15.82%), while the largest decreases were observed for Finland (#28.57%), Norway (#20.52%) and Sweden (#15.39%). These changes were counteracted by decreases (or increases, respective- ly) in the proportion of combinations of sulphonamides and tri- methoprim (J01EE). The proportion of short-acting sulphonamides only changed only for Denmark (#14.50%). The proportion of intermediate-acting sulphonamides remained stable for most countries, but changes >5% were observed for Malta (!28.01%) and Iceland (!6.69%). Long-acting sulphonamides were not Table3.Rankingofconsumptionofsulphonamidesandtrimethoprim(ATCJ01E)inthecommunity,expressedinDDDsorpackagesper1000inhabitantsperday,20EU/EEAcountries,2017 CountryBulgariaCzechiaLatviaSloveniaFinlandDenmarkFranceIcelandCroatiaGreecePortugalEstoniaSlovakiaLithuaniaBelgiumItalyIrelandSwedenSpainAustria Rankingfor packagesper 1000inhabitants perday
123–45678910111213141516171819 Rankingfor DDDper 1000inhabitants perday
546–27121791413111191883151016 NumberofDDD perpackage4.55.75.9–8.58.04.93.08.04.97.27.722.90.23.714.320.97.011.39.7 ForCzechia,2015dataareused.ForSlovakia,2016dataareused.ForCyprusandRomania,totalcaredata,i.e.communityandhospitalsectorcombined,areused.ForSlovenia,sul- phonamideandtrimethoprim(J01E)consumptionwasnotreportedin2017. Downloaded from https://academic.oup.com/jac/article/76/Supplement_2/ii45/6328685 by 81728827 user on 20 October 2021
consumed in the community in any of the countries in 2017, while in 2009 they were still consumed in the United Kingdom (0.04%).
Other antibacterials
An overview of consumption of other antibacterials (ATC J01X) in the community, expressed in DDD and packages per 1000 inhabi- tants per day for all participating countries between 1997 and 2017 is available asSupplementary data(TablesS5 and S6, respectively).
Consumption of other antibacterials in the community in 2017
In 2017, the three most used substances accounted for 90% of the consumption of other antibacterials in the community expressed in DDD per 1000 inhabitants per day: nitrofurantoin (58.5% in 2017
compared with 55.3% in 2009), methenamine hippurate/mande- late (22.6% in 2017 compared with 23.3% in 2009) and fosfomycin (10.6% in 2017 compared with 4.7% in 2009) (Table1).
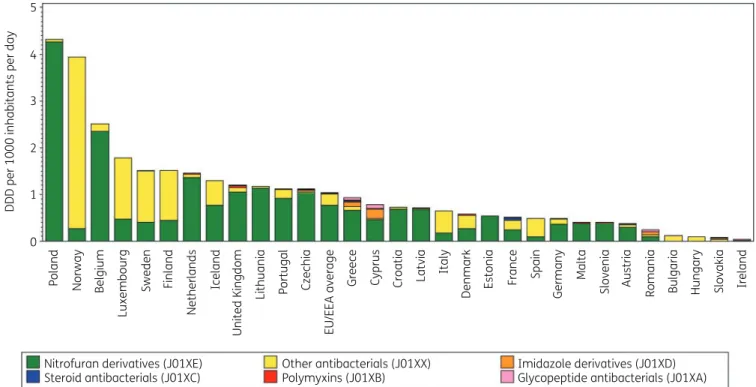
Figure7shows the consumption of other antibacterials (J01X) in the community expressed in DDD per 1000 inhabitants per day in 2017. Consumption of other antibacterials varied by a factor of 130 between countries with the highest (4.32 DDD per 1000 inhab- itants per day in Poland) and the lowest [0.03 DDD per 1000 inhabi- tants per day in Ireland; consumption of nitrofurantoin (J01XE01) not included] consumption (TableS5). This was much lower than in 2009 (factor of 892, from 2.85 DDD per 1000 inhabitants per day in Norway to 0.003 DDD per 1000 inhabitants per day in Bulgaria).
Nitrofuran derivatives (J01XE) represented >50% of the con- sumption of other antibacterials in the community in 17 countries:
>90% in Belgium, Croatia, Czechia (2015 data), Estonia, Latvia,
3 Change-point 1 Change-point 2
Estimated trend Linear trend
2
DDD per 1000 inhabitants per day
1
0
1997 1998 1999 2000 2001 2002 2003 2004 2005 2006 2007 2008 Time (1997-2017)
2009 2010 2011 2012 2013 2014 2015 2016 2017
Parameter
Estimate (std.
error)
1.767 (0.283)*
–0.018 (0.009)*
0.031 (0.015)*
–0.002 (0.009)
-
0.147 (0.028)*
–0.001 (0.0002)*
0.677 (0.037)*
b0 b1 b2 b3 b4 bS0 bS1 d
Figure 6.Estimated trend (solid line) and linear trend (dashed line) of consumption of sulphonamides and trimethoprim (ATC J01E) in the commu- nity expressed based on quarterly data, 25 EU/EEA countries, 1997–2017.b0, predicted consumption in the first quarter of 1997;b1, predicted increase (if positive)/decrease (if negative) in consumption per quarter;b2, predicted difference in slope after versus before the first change-point;b3, predicted difference in slope after versus before the second change-point;b4, predicted difference in slope after versus before the third change-point;
b0S, predicted amplitude of the upward winter and downward summer peak in consumption;b1S, predicted increase (if positive)/decrease (if negative) of the amplitude of the upward winter and downward summer peak in consumption per quarter;d, shift in timing of the upward winter and down- ward summer peak from one year to another. An asterisk indicates that the result was statistically significant at significance level 0.05.
Tetracyclines, sulphonamides, trimethoprim and other community consumption, 1997–2017 JAC
Downloaded from https://academic.oup.com/jac/article/76/Supplement_2/ii45/6328685 by 81728827 user on 20 October 2021
Lithuania, Malta, the Netherlands, Poland and Slovenia; >80% in Portugal and the United Kingdom; >70% in Austria, Germany and Greece and >50% in Cyprus (total care data, community and hospital sector combined) and Iceland. In Spain and Norway, nitro- furan derivatives represented <20% of the consumption of other antibacterials. No consumption of this subgroup was reported for Bulgaria, Hungary and Slovakia (2016 data). In all but two
countries, nitrofurantoin was the only nitrofuran derivative con- sumed [nifurtoinol in Belgium (24.4%) and Luxembourg (6.0%)].
The subgroup ‘other antibacterials’ (J01XX) represented >70%
of the other antibacterials (J01X) in eight countries (Bulgaria, Finland, Hungary, Italy, Luxembourg, Norway, Spain and Sweden), and it represented >20% in Denmark, France, Germany, Iceland, Ireland [consumption of nitrofurantoin (J01XE01) not included]
and Slovakia (2016 data). Methenamine hippurate/mandelate and fosfomycin, and to a lesser extent nitroxoline and linezolid, were also consumed, each country using a substantial proportion of only one of these substances. The highest consumption of gly- copeptide antibacterials (J01XA, i.e. parenteral vancomycin and teicoplanin) was reported for Cyprus (total care data, i.e. commu- nity and hospital sector combined) followed by Greece, Romania (total care data), Czechia (2015 data) and the United Kingdom.
For six countries, no consumption of glycopeptide antibacterials was reported in the community. The highest consumption of polymyxins (J01XB; only represented by parenteral colistin) in the community was observed for the United Kingdom, followed by the Netherlands, Greece and Denmark. Steroid antibacterials (J01XC;
represented by fusidic acid) were consumed by 14 countries and represented 10.5% of the consumption of other antibacterials (J01X) in Ireland [consumption of nitrofurantoin (J01XE01) not included] and France. Imidazole derivatives [J01XD, represented mainly by parenteral metronidazole; and not including oral metro- nidazole (P01AB01)] were consumed in the community in 22 coun- tries with the highest consumption reported in Cyprus (total care data, i.e. community and hospital sector combined), followed by Greece, Romania (total care data) and Czechia (2015 data).
Table 4. Change in the composition of the consumption of sulphona- mides and trimethoprim (ATC J01E) in the community, expressed in DDD (ATC/DDD index 2019) per 1000 inhabitants per day, 30 EU/EEA countries, as a function of time during 1997–2017
J01EA J01EB J01EC J01ED J01EE
J01EA 0.1194 0.0212 0.4550 0.0203
J01EB #0.1194 #0.0983 0.3355 #0.0992
J01EC #0.0212 0.0983 0.4338 #0.0009
J01ED #0.4550 #0.3355 #0.4338 #0.4347
J01EE #0.0203 0.0992 0.0009 0.4347
Values are estimated changes in the log ratio of the row versus column subgroup of antibiotics with increasing time. Bold type indicates a statistically significant effect; positive values represent an increase and negative values represent a decrease.
J01EA, trimethoprim and derivatives; J01EB, short-acting sulphona- mides; J01EC, intermediate-acting sulphonamides; J01ED, long-acting sulphonamides; J01EE, sulphonamides and trimethoprim, including derivatives.
5
4
3
DDD per 1000 inhabitants per day
2
1
0
Nitrofuran derivatives (J01XE) Steroid antibacterials (J01XC)
Other antibacterials (J01XX) Polymyxins (J01XB)
Imidazole derivatives (J01XD) Glycopeptide antibacterials (J01XA)
Poland Norway Belgium Sweden Finland Netherlands Iceland Czechia Greece Cyprus Latvia Italy Denmark Estonia France Spain Malta Slovenia Austria Romania Bulgaria Hungary Slovakia Ireland
Germany
Croatia
EU/EEA average
Portugal
Lithuania
United Kingdom
Luxembourg
Figure 7. Consumption of other antibacterials (ATC J01X) in the community, expressed in DDD (ATC/DDD index 2019) per 1000 inhabitants per day, 30 EU/EEA countries in 2017. For Czechia, 2015 data are used. For Slovakia, 2016 data are used. For Cyprus and Romania, total care data, i.e. commu- nity and hospital sector combined, are used. For Ireland, nitrofurantoin (J01XE01) consumption is not included.
Downloaded from https://academic.oup.com/jac/article/76/Supplement_2/ii45/6328685 by 81728827 user on 20 October 2021
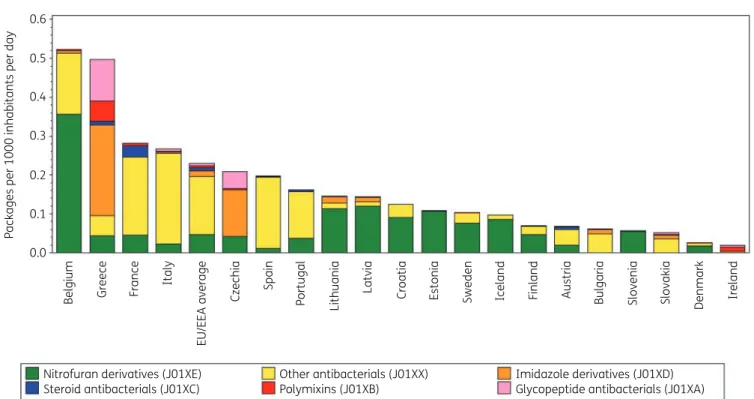
Figure8shows consumption of other antibacterials in the com- munity expressed in packages per 1000 inhabitants per day for 20 EU/EEA countries in 2017. The number of DDD per package ranged from 1.6 in Slovakia (2016 data) to 22.5 in Denmark. A high number of DDD per package was generally associated with a higher ranking in DDD per 1000 inhabitants per day than in packages per 1000 inhabitants per day (Table5). Denmark and Finland had a higher ranking in DDD than in packages per 1000 inhabitants per day be- cause of the high number of DDD per package. Inversely, Greece, France and Italy, for example, had a lower ranking in DDD than in packages per 1000 inhabitants per day because of the low number of DDD per package. In the EU/EEA countries, the number of DDD per package significantly increased over time during 1997–2017, with the steepness of this increase significantly reducing over the years.
Longitudinal data analysis, 1997–2017
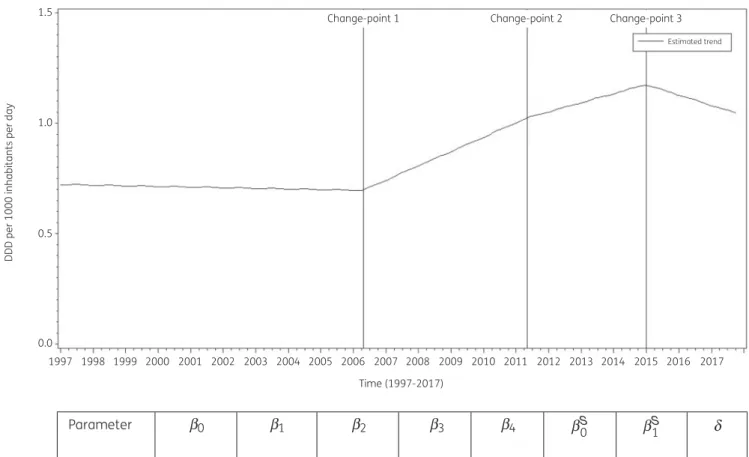
The best fit was obtained for a model including three change- points: one in the second quarter of 2006, another in the second quarter of 2011 and a third one in the first quarter of 2015. The final model fits the observed data well (FigureS8). The longitudinal data analysis estimated an average consumption of other antibac- terials in the EU/EEA of 0.723 (SE 0.207) DDD per 1000 inhabitants per day in the first quarter of 1997 which did not change signifi- cantly over time:#0.001 (SE 0.005) DDD per 1000 inhabitants per day per quarter up to the second quarter of 2006, then!0.016 (SE 0.010) DDD per 1000 inhabitants per day per quarter up to the se- cond quarter of 2011, then!0.010 (SE 0.013) DDD per 1000 inhab- itants per day per quarter up to the first quarter of 2015, and finally
#0.011 (SE 0.007) DDD per 1000 inhabitants per day per quarter.
Furthermore, the longitudinal data analysis showed no significant seasonal variation for the consumption of other antibacterials (Figure9).
Based on the fitted model, consumption of other antibacterials in the community in 1997 was significantly higher than average in Belgium, Estonia, Finland, Latvia, Luxembourg and Sweden, and lower than average in Austria, Croatia, Germany, Hungary, Poland, Slovakia, Slovenia, Spain and the United Kingdom (observed pro- files shown in FiguresS9andS10). The seasonal variation was sig- nificantly larger than average in Czechia. The decrease in consumption of other antibacterials in the community between 1997 and the second quarter of 2006 was significantly larger than average in Czechia, Estonia, Iceland, Latvia and Luxembourg. The increase between the third quarter of 2006 and the second quarter of 2011 was significantly larger than average in Iceland, Lithuania and Portugal. The increase between the third quarter of 2011 and the first quarter of 2015 was significantly larger than average in Lithuania. The decrease between the second quarter of 2015 and the last quarter of 2017 was significantly larger than average in Czechia.
Compositional data analysis, 1997–2009
The proportional consumption of polymyxins (J01XB) significantly increased over time relative to that of the other subgroups (Table 3). The proportional consumption of steroid antibacterials (J01XC) significantly decreased relative to that of the other subgroups ex- cept imidazole derivatives (J01XD; no significant change). The rela- tive consumption of glycopeptide antibacterials (J01XA) significantly decreased relative to that of other antibacterials (J01XX) and the proportional consumption of imidazole derivatives 0.6
0.5 0.4 0.3
Packages per 1000 inhabitants per day
0.2 0.1 0.0
Nitrofuran derivatives (J01XE) Steroid antibacterials (J01XC)
Other antibacterials (J01XX) Polymixins (J01XB)
Imidazole derivatives (J01XD) Glycopeptide antibacterials (J01XA)
Belgium Greece France Italy Czechia Spain Portugal Lithuania Latvia Croatia Estonia Sweden Iceland Finland Austria Bulgaria Slovenia Slovakia Denmark Ireland
EU/EEA average
Figure 8. Consumption of other antibacterials (ATC J01X) in the community, expressed in packages per 1000 inhabitants per day 20 EU/EEA coun- tries, 2017. For Czechia, 2015 data are used. For Slovakia, 2016 data are used. For Cyprus and Romania, total care data, i.e. community and hospital sector combined, are used. For Ireland, nitrofurantoin (J01XE01) consumption is not included.
Tetracyclines, sulphonamides, trimethoprim and other community consumption, 1997–2017 JAC
Downloaded from https://academic.oup.com/jac/article/76/Supplement_2/ii45/6328685 by 81728827 user on 20 October 2021
(J01XD) significantly decreased relative to that of nitrofuran deriv- atives (J01XE) (Table6).
Trends of proportional consumption for individual countries are shown in FigureS11. When comparing the composition of the con- sumption of other antibacterials in 2017 with that in 2009, the pro- portion of polymyxins increased for most of the participating countries. Increases >5% were reported for Ireland [!14.44%;
consumption of nitrofurantoin (J01XE01) not included], Slovakia (!11.61%; 2016 data) and Bulgaria (!5.54%). The proportional consumption of steroid antibacterials decreased for most of the countries, with decreases >5% reported for Iceland (#40.96%), Ireland [#20.20%; consumption of nitrofurantoin (J01XE01) not included], Austria (#10.13%), Greece (#7.83%), and France (#7.73%). The proportional consumption of nitrofuran derivatives decreased for most countries, with the largest decreases reported for Hungary (#71.06%), Luxembourg (#68.03%) and Denmark (#46.71%). The proportional consumption of the ‘other antibacte- rials’ subgroup (J01XX) increased in most countries, with the larg- est increases reported for Bulgaria (!77.74%), Luxembourg (!68.27%), Hungary (!66.93%) and Denmark (!49.12%). Overall, the increase was mainly attributable to an increased consumption of fosfomycin (J01XX01). The proportions of glycopeptide antibac- terials and imidazole derivatives showed both increases and decreases. The largest increases in the consumption of glycopep- tide antibacterials in the community were observed for Romania (!14.70%; total care data, i.e. community and hospital sector combined; coverage in 2009 limited to 30%–40%), Ireland [!6.28%; consumption of nitrofurantoin (J01XE01) not included]
and Cyprus (!1.90%; total care data), and the largest decreases for Bulgaria (#5.72%), Slovakia (#0.87%; 2016 data) and Greece (#0.67%). The largest increases in the consumption of imidazole derivatives in the community were observed for Slovakia (!22.46%), Cyprus (!6.53%; total care data) and Greece (!2.60%), and the largest decreases for Bulgaria (#77.56%), Romania (#73.75%; total care data; coverage in 2009 limited to 30%–40%) and Lithuania (#52.34%).
Discussion
This study updates a previous description of the consumption of tetracyclines, sulphonamides and trimethoprim, and other anti- bacterials in the community in EU/EEA countries.2Most substances reported in this article are prescribed to treat a wide range of infec- tions and acne as well as infections with atypical pathogens such as Chlamydophila pneumoniae, Mycoplasma pneumoniae or Legionella pneumophila.8While tetracycline consumption did not change significantly over time, its seasonal variation significantly decreased. Four substances represented 99% of consumption of tetracyclines in the community.
In 2017, the proportional consumption of tetracyclines out of all antibacterials for systemic use ranged from 2.51% in Italy to 28.22% in the United Kingdom.3In European countries that are not part of the ESAC-Net but covered by the WHO Europe Antimicrobial Medicines Consumption (AMC) Network, there was also considerable variation, i.e. from <0.1% in North Macedonia to 15.3% in Azerbaijan.9
While the consumption of doxycycline (usually prescribed for respiratory infections), minocycline and tetracycline (usually pre- scribed for long-term treatment of acne) decreased since 2009, Table5.Rankingofconsumptionofotherantibacterials(ATCJ01X)inthecommunity,expressedinDDDsorpackagesper1000inhabitantsperday20EU/EEAcountries,2017 CountryBelgiumGreeceFranceItalyCzechiaSpainPortugalLithuaniaLatviaCroatiaEstoniaSwedenIcelandFinlandAustriaBulgariaSloveniaSlovakiaDenmarkIreland Rankingfor packagesper 1000inhabitants perday
1234567891011121314151617181920 Rankingfor DDDper 1000inhabitants perday 1814117156510913243171816191220 Numberof DDDper package
4.81.91.82.45.32.56.98.04.95.95.014.613.321.75.71.87.01.622.51.7 ForCzechia,2015dataareused.ForSlovakia,2016dataareused.ForCyprusandRomania,totalcaredata,i.e.communityandhospitalsectorcombined,areused.ForIreland,nitro- furantoin(J01XE01)consumptionisnotincluded. Downloaded from https://academic.oup.com/jac/article/76/Supplement_2/ii45/6328685 by 81728827 user on 20 October 2021
the consumption of lymecycline (usually prescribed to treat acne and respiratory infections) increased since 2009, mainly in some northern EU/EEA countries such as Finland, Norway, Sweden and the United Kingdom.
Consumption of sulphonamides and trimethoprim [usually pre- scribed to treat urinary tract infections (UTIs)] and the composition of this consumption varied considerably between countries. On average, within the EU/EAA, consumption of sulphonamides and trimethoprim significantly decreased over time until 2006 and remained stable thereafter, but seasonal variation continued to significantly decrease over time. Interestingly, considering the change in the composition of consumption of sulphonamides and trimethoprim, the proportion of trimethoprim and derivatives (J01EA) significantly increased over time compared with that of the most commonly prescribed subgroup combinations of sul- phonamides and trimethoprim, including derivatives (J01EE), as well as other less-consumed sulphonamide subgroups.
Given that total consumption of sulphonamides and trime- thoprim did not change significantly after 2006, this implies that consumption of one subgroup was merely replaced by con- sumption of another subgroup, rather than consumption being reduced overall.
In the EU/EEA, the average consumption as well as the season- al variation of the consumption of other antibacterials (J01X) did not change significantly over time. Nevertheless, there were large variations between countries with other antibacterials represent- ing from 0.17% in Ireland to 27.46% in Norway of the consumption of antibacterials for systemic use in the community in 2017.3This might be explained by a preference for treating some UTIs with methenamine, which does not drive antimicrobial resistance.10In European countries that are not part of the ESAC-Net but covered by the WHO Europe Antimicrobial Medicines Consumption (AMC) Network considerable variation was also observed, from 1.4% in Albania to 10.8% in Georgia.9
1.5 Change-point 1 Change-point 2 Change-point 3
Estimated trend
1.0
DDD per 1000 inhabitants per day
0.5
0.0
1997 1998 1999 2000 2001 2002 2003 2004 2005 2006 2007 2008 Time (1997-2017)
2009 2010 2011 2012 2013 2014 2015 2016 2017
Parameter
Estimate (std. error)
0.723 (0.207)*
–0.0007 (0.005)
0.017 (0.009)*
–0.006 (0.007)
–0.022 (0.020)
–0.002 (0.007)
- -
b0 b1 b2 b3 b4 bS0 bS1 d
Figure 9. Estimated trend (solid line) of consumption of other antibacterials (ATC J01X) in the community based on quarterly data from 25 EU/EEA countries, 1997–2017.b0, predicted consumption in the first quarter of 1997;b1, predicted increase (if positive)/decrease (if negative) in consumption per quarter;b2, predicted difference in slope after versus before the first change-point;b3, predicted difference in slope after versus before the second change-point;b4, predicted difference in slope after versus before the third change-point;b0S, predicted amplitude of the upward winter and down- ward summer peak in consumption;b1S, predicted increase (if positive)/decrease (if negative) of the amplitude of the upward winter and downward summer peak in consumption per quarter;d, shift in timing of the upward winter and downward summer peak from one year to another. An asterisk indicates that the result was statistically significant at significance level 0.05.
Tetracyclines, sulphonamides, trimethoprim and other community consumption, 1997–2017 JAC
Downloaded from https://academic.oup.com/jac/article/76/Supplement_2/ii45/6328685 by 81728827 user on 20 October 2021