Change-points in antibiotic consumption in the community, European Union/European Economic Area, 1997–2017
Robin Bruyndonckx
1,2*, Ana Hoxha
3, Chantal Quinten
4, Girma Minalu Ayele
5, Samuel Coenen
1,6, Ann Versporten
1, Niels Adriaenssens
1,6, Arno Muller
4, Ole Heuer
4, Dominique L. Monnet
4, Herman Goossens
1,
Geert Molenberghs
2,7, Klaus Weist
4and Niel Hens
2,8on behalf of the ESAC-Net study group†
1
Laboratory of Medical Microbiology, Vaccine & Infectious Disease Institute (VAXINFECTIO), University of Antwerp, Antwerp, Belgium;
2
Interuniversity Institute for Biostatistics and statistical Bioinformatics (I-BIOSTAT), Data Science Institute, Hasselt University, Hasselt, Belgium;
3Sciensano, Brussels, Belgium;
4Disease Programmes Unit, European Centre for Disease Prevention and Control, Stockholm,
Sweden;
5Allergan Plc, 5 Giralda Farms, Madison NJ, USA;
6Centre for General Practice, Department of Family Medicine & Population Health (FAMPOP), University of Antwerp, Antwerp, Belgium;
7Interuniversity Institute for Biostatistics and statistical Bioinformatics (I-
BIOSTAT), Catholic University of Leuven, Leuven, Belgium;
8Centre for Health Economic Research and Modelling Infectious Diseases (CHERMID), Vaccine & Infectious Disease Institute, University of Antwerp, Antwerp, Belgium
*Corresponding author. E-mail: robin.bruyndonckx@uhasselt.be
†Members are listed in the Acknowledgements.
Objectives:
Surveillance of antibiotic consumption in the community is of utmost importance to inform and evaluate control strategies. Data on two decades of antibiotic consumption in the community were collected from 30 EU/European Economic Area (EEA) countries. This article reviews temporal trends and the presence of abrupt changes in subgroups of relevance in antimicrobial stewardship.
Methods:
For the period 1997–2017, data on yearly antibiotic consumption in the community, aggregated at the level of the active substance, were collected using the WHO ATC classification and expressed in DDD (ATC/
DDD index 2019) per 1000 inhabitants per day. We applied a range of non-linear mixed models to assess the presence of changes in the consumption of antibacterials for systemic use (ATC group J01) and eight antibiotic subgroups.
Results:
For the majority of the studied groups, a country-specific change-point model provided the best fit.
Depending on the antibiotic group/subgroup and on the country, change-points were spread out between 2000 and 2013.
Conclusions:
Due to the heterogeneity in antibiotic consumption in the community across EU/EEA countries, a country-specific change-point model provided the better fit. Given the limitations of this model, our recommen- dation for the included countries is to carefully interpret the country-specific results presented in this article and to use the tutorial included in this series to conduct their own change-point analysis when evaluating the impact of changes in regulations, public awareness campaigns, and other national interventions to improve antibiotic consumption in the community.
Introduction
Since their discovery, antibiotics have played an important role in the treatment of bacterial infections. Access to effective antibiotics remains of utmost importance in modern healthcare.
1However, overuse and misuse of antibiotics have been identified as important factors leading to the increase of bacterial resistance.
2–5Because the therapeutic options for treatment of multidrug-resistant bacterial infections are limited, they represent a major public
health threat with prolonged hospital stays, increased health care costs and increased mortality.
6–8Therefore, surveillance of antibiotic consumption in both the community (i.e. primary care sector) and hospital setting is crucial in order to inform and evaluate strategies for prevention and control of antibiotic resistance.
In 2001, the European Commission funded the European Surveillance of Antimicrobial Consumption (ESAC) project with the aim of collecting comparable and reliable data on antibiotic
VC The Author(s) 2021. Published by Oxford University Press on behalf of the British Society for Antimicrobial Chemotherapy.
This is an Open Access article distributed under the terms of the Creative Commons Attribution License (http://creativecommons.org/licenses/
Downloaded from https://academic.oup.com/jac/article/76/Supplement_2/ii68/6328682 by 81728827 user on 20 October 2021
consumption in Europe. In 2011, this surveillance activity contin- ued as the European Surveillance of Antimicrobial Consumption Network (ESAC-Net),
9managed and hosted by ECDC. Using data collected through these surveillance networks, trends of antibiotic consumption in the community (1997–2009) have been studied for the different antibiotic subgroups.
10–14In 2013, Minalu et al.
15proposed a change-point model using a Bayesian framework to improve model fit by allowing for abrupt changes in tetracycline consumption. The approach suggested by Minalu et al.
15has previously been used to update two series of articles on antibiotic consumption in the community: 1997–2009
16–21and 1997–
2003.
10–14,22–27In that update, statistical modelling focused on assessing the occurrence of change-points from the EU/European Economic Area (EEA) perspective, which is reflected by the use of common change-point(s) for the participating countries. However, when focusing on explaining as much of the observed variability as possible, regardless of the perspective, other models, e.g. models including country-specific change-points, might provide a better fit to the data.
In this article, we apply a range of models to data collected through ESAC and ESAC-Net on the consumption of antibacterials for systemic use (ATC J01) and of eight subgroups in the commu- nity during 1997–2017.
Methods Data
The methods for collecting and analysing data on antibiotic consumption in the community are described in the introductory article of this series.28 In summary, data on antibiotic consumption, aggregated at the level of the active substance, were collected in accordance with the ATC classifica- tion defined by the WHO Collaborating Centre for Drug Statistics Methodology.29Data on consumption expressed in DDD (ATC/DDD index 2019)29per 1000 inhabitants per day were available for 30 EU/EEA coun- tries for the period 1997–2017. To limit difficulties in model convergence, countries that reported consumption data for <60% of the total number of years included in the study (i.e. <13 years) were excluded from the change-point analysis.
In this article, we focused on antibacterials for systemic use (ATC J01) and eight specific subgroups: tetracyclines (J01A),b-lactamase-sensitive penicillins (J01CE; narrow-spectrum penicillins) andb-lactamase-resistant penicillins (J01CF; penicillinase-resistant penicillins), cephalosporins (J01DB, J01DC, J01DD and J01DE), combinations of sulphonamides and trimethoprim (J01EE), macrolides (J01FA), fluoroquinolones (J01MA), penicillins with extended spectrum (J01CA; extended-spectrum penicil- lins) and combinations of penicillins, includingb-lactamase inhibitors (J01CR; combinations of penicillins), and nitrofuran derivatives (J01XE).
These subgroups were selected because they represent first-line anti- biotic treatments or are recommended for use in severe and multidrug- resistant bacterial infections.30
Statistical analysis
In this manuscript, we focused on detecting changes in antibiotic consumption by country, rather than on detecting common changes for the EU/EEA as a whole. Therefore, the statistical analysis deviates slight- ly from the approach followed in the other articles of this series.22,31 Rather than using quarterly data on antibiotic consumption, we used the more complete yearly data for this manuscript. We considered the following models that are discussed in detail in the tutorial of this series:31
Model 1: Mixed model without change-points;
Model 2: Mixed model with one common change- point (C1);
Model 3: Mixed model with two common change-points (C1and C2with C1<C2);
Model 4: Mixed model with three common change- points (C1, C2and C3with C1<C2<C3).
In addition, we considered the following model:
Model 5:Mixed model with one country-specific change- point (ci),
where the common change-point (C1) from Model 2 was replaced by a change-point for which the location is country-specific and data-driven (ci). To reflect our lack of prior knowledge on the location of this country- specific change-point, we used a uniform distribution over the whole time range.15
Model selection was based on the Deviance Information Criterion (DIC),32with trace plots used to verify convergence of the fitted models.
Significance was based on 95% Bayesian credible intervals which are inter- vals from the posterior distribution within which the unobserved parame- ters fall with 95% probability.33We assumed that the less complete series were for countries that had not joined the network from its start, missed intermittent data calls, or had not yet submitted their data for the more recent years.
Results
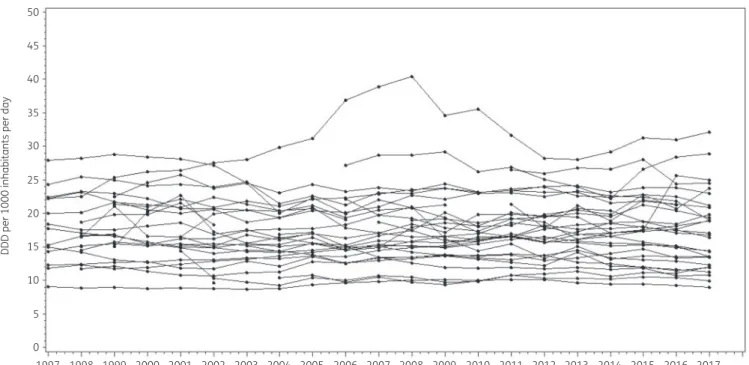
The longitudinal profiles for the 30 EU/EEA countries demonstrated that there was heterogeneity both between and within countries (Figure
1). The lowest consumption of antibacterials for systemicuse (ATC J01) was recorded in the Netherlands in 2003 (8.72 DDD per 1000 inhabitants per day) while the highest consumption was recorded in Greece in 2008 (40.39 DDD per 1000 inhabitants per day).
Countries reporting antibiotic consumption for <60% of the included years (<13 years), i.e. Romania (8 years reported; commu- nity and hospital sector combined), Cyprus (12 years reported;
community and hospital sector combined), Malta (11 years reported) and Lithuania (12 years reported), were excluded from further analysis in order to minimize convergence issues.
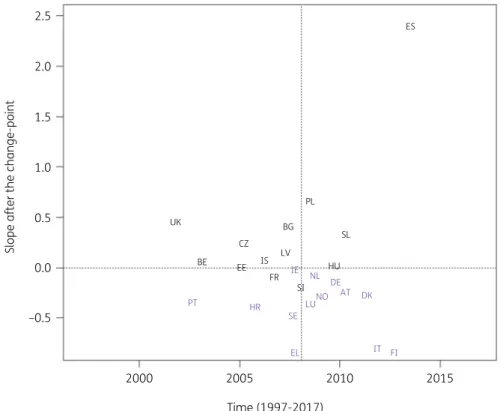
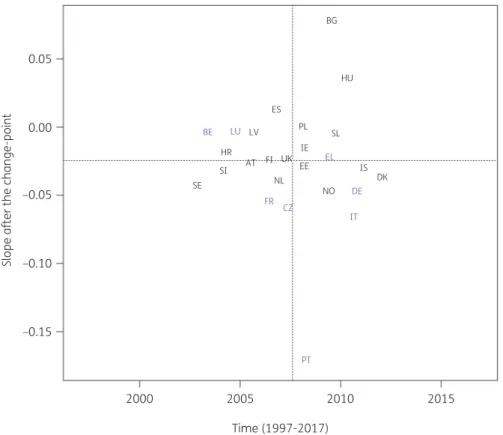
When modelling consumption data for antibacterials for systemic use (ATC J01), the best model fit was obtained for a model including country-specific change-points (Model 5; Table
1).Consumption of antibacterials for systemic use significantly increased, between 1997 and the country-specific change-point for Denmark, Greece and Italy while it significantly decreased for Bulgaria, France, Hungary and Iceland. After the change-point, a significant increase was observed for Bulgaria, Poland, Spain (pri- vate prescriptions included from 2016 onwards) and the United Kingdom while a significant decrease was observed for Croatia, Finland, Greece, Italy and Portugal. Change-points were located between 2002 and 2013, with the majority of the countries’
change-points located around 2008 (Figure
2).For tetracyclines (J01A), the best model fit was obtained for the model containing two common change-points: one in 2004 and one in 2011 (Model 3; Table
1). In 1997, tetracycline consumptionwas estimated at 2.861 (SE 0.265) DDD per 1000 inhabitants per day. In general, tetracycline consumption decreased over time
Change-points in European antibiotic consumption JAC
Downloaded from https://academic.oup.com/jac/article/76/Supplement_2/ii68/6328682 by 81728827 user on 20 October 2021
(
#0.054, SE 0.019, DDD per 1000 inhabitants per day per year) up to 2004, after which it did not change significantly [
!0.030, SE 0.030, DDD per 1000 inhabitants per day per year up to 2011, then
#
0.013 (SE 0.029) DDD per 1000 inhabitants per day per year afterwards]. Significant increases were observed between 1997 and 2004 for France, Germany and Ireland while significant decreases were observed for Belgium, Bulgaria, Estonia, Finland, Hungary, Luxembourg, Norway, Poland, Portugal and Slovenia.
Between 2005 and 2011, significant increases were observed for Denmark, Finland, the Netherlands, Norway and the United
Kingdom while significant decreases were observed for Bulgaria, Croatia, Czechia, Estonia, Germany, Greece, Hungary, Ireland, Poland, Slovakia and Slovenia. After 2011, significant increases were observed for Greece, Slovakia, Spain (private prescriptions included from 2016 onwards) and the United Kingdom while sig- nificant decreases were observed for Austria, Croatia, Denmark, Estonia, Finland, Germany, Luxembourg, the Netherlands and Sweden.
For narrow-spectrum and penicillinase-resistant penicillins (J01CE and J01CF), the best model fit was obtained for the model
50
45
40
35
30
DDD per 1000 inhabitants per day
25
20
15
10
5
0
1997 1998 1999 2000 2001 2002 2003 2004 2005 2006 2007 2008 Time (1997-2017)
2009 2010 2011 2012 2013 2014 2015 2016 2017
Figure 1. Evolution of consumption of antibacterials for systemic use (ATC J01) in the community, expressed in DDD (ATC/DDD index 2019) per 1000 inhabitants per day for 30 EU/EEA countries, 1997–2017 (unlabelled lines).
Table 1. Deviance Information Criterion for the five models fitted to data on antibiotic consumption of antibacterials for systemic use (ATC J01) and eight selected subgroups of antibiotics
ATC CODE
Model 1 (no CP)
Model 2 (1 CP)
Model 3 (2 CPs)
Model 4 (3 CPs)
Model 5 (country-specific CP)
Location of CPs for the best model
J01 1892.15 1635.64 1519.93 NC 1518.59 2002–2013
J01A 145.93 #109.96 #313.71 NC #307.14 2004 and 2011
J01CE & J01CF 324.33 177.77 7.28 NC 115.45 2001 and 2006
J01DB to J01DE 257.59 42.79 #41.08 NC #97.67 2001–2013
J01EE #296.4 #526.29 NC NC #801.08 2001–2013
J01FA 888.84 236.97 167.86 NC #44.6 2000–2012
J01MA #102.15 #301.67 #345.56 NC #440.87 2001–2010
J01CA & J01CR 963.83 738.45 650.88 579.56 425.99 2005–2013
J01XE #172.27 #215.33 NC NC #310.22 2003–2012
Bold font indicates the best fitting model.
CP, change-point; NC, no convergence was obtained; J01, antibacterials for systemic use; J01A, tetracyclines; J01CE, narrow-spectrum penicillins;
J01CF, penicillinase-resistant penicillins; J01DB to J01DE, cephalosporins; J01EE, combinations of sulphonamides and trimethoprim; J01FA, macro- lides; J01MA, fluoroquinolones; J01CA, extended-spectrum penicillins; J01CR, combinations of penicillins; J01XE, nitrofuran derivatives.
Downloaded from https://academic.oup.com/jac/article/76/Supplement_2/ii68/6328682 by 81728827 user on 20 October 2021
containing two common change-points: one in 2001 and one in 2006 (Model 3; Table
1). In 1997, consumption of narrow-spec-trum and penicillinase-resistant penicillins was estimated at 1.980 (SE 0.347) DDD per 1000 inhabitants per day. In general, consump- tion did not change significantly over time [
#0.018, SE 0.040, DDD per 1000 inhabitants per day per year up to 2001, then
#0.077 (SE 0.071) DDD per 1000 inhabitants per day per year up to 2006, and
#
0.045 (SE 0.084) DDD per 1000 inhabitants per day per year afterwards]. Significant increases were observed between 1997 and 2001 for Denmark and Slovakia while significant decreases were observed for Finland, Iceland and Poland. Between 2002 and 2006, significant increases were observed for Denmark and Greece while significant decreases were observed for Bulgaria, Finland, Germany, Iceland, Poland, Slovakia and Slovenia. After 2006, sig- nificant increases were observed for Ireland and the United Kingdom while significant decreases were observed for Croatia, Denmark, Greece, Hungary, Iceland, Norway, Slovakia, Slovenia and Sweden.
For the other subgroups, the best model fit was obtained for a country-specific change-point model (Model 5, Table
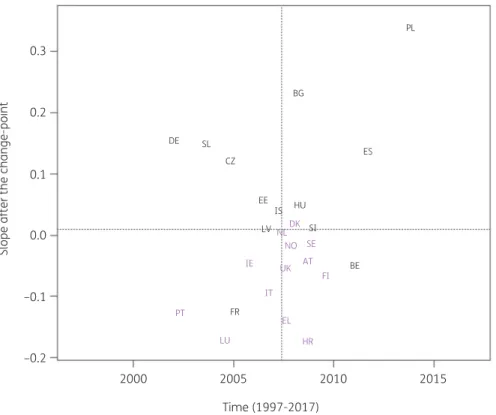
1).Consumption of cephalosporins (J01DB, J01DC, J01DD and J01DE) significantly increased between 1997 and the country-specific change-point for Greece and Poland while it significantly decreased for Belgium, France, Hungary and Spain (private pre- scriptions included from 2016 onwards). After the change-point, a
significant increase was observed for Bulgaria, Czechia, Germany, Poland, Slovakia and Spain (private prescriptions included from 2016 onwards) while a significant decrease was observed for Croatia, France, Greece and Luxembourg. Change-points were located between 2001 and 2013, with the majority of the coun- tries’ change-points located around 2008 (Figure
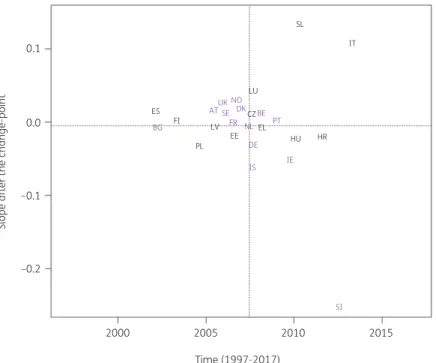
3).Consumption of combinations of sulphonamides and trimetho- prim (J01EE) significantly increased between 1997 and the coun- try-specific change-point for Bulgaria while it significantly decreased for Austria, Belgium, Czechia, Estonia, Finland, Greece, Hungary, Iceland, Italy, Luxembourg, Poland, Portugal, Slovakia, Slovenia and Spain (private prescriptions included from 2016 on- wards). After the change-point, a significant increase was observed for Slovakia while a significant decrease was observed for Bulgaria, Poland and Slovenia. Change-points were located be- tween 2001 and 2013, with the majority of the countries’ change- points located around 2007 (Figure
4).Consumption of macrolides (J01FA) significantly increased be- tween 1997 and the country-specific change-point for Bulgaria, Croatia, Estonia, Greece, Ireland, Poland, Portugal and Slovakia while it significantly decreased for Belgium, Luxembourg and Spain (private prescriptions included from 2016 onwards). After the change-point, a significant increase was observed for Belgium, Luxembourg, Spain (private prescriptions included from 2016 on- wards) and the United Kingdom while a significant decrease was
2.52.0
1.5
1.0
Slope after the change-point
0.5
0.0
–0.5
2000 2005
Time (1997-2017)
2010 2015
ES
PL
SL
HU UK BG
BE
PT HR
SE
EL IT
AT DK DE LUNO IE NL
FI CZ
IS FR
SI EE
LV
Figure 2.Estimated country-specific trend after the change-point versus location of the country-specific change-point for the consumption of anti- bacterials for systemic use (ATC J01) in the community obtained from fitting Model 5 on yearly data from 26 EU/EEA countries, 1997–2017. Dotted lines indicate averages. Country labels in black indicate an increase in the trend after versus before the change-point. Country labels in purple indicate a decrease in the trend after versus before the change-point. For Spain, private prescription data are included from 2016 onwards. Abbreviations: AT, Austria; BE, Belgium; BG, Bulgaria; HR, Croatia; CZ, Czechia; DK, Denmark; EE, Estonia; FI, Finland; FR, France; DE, Germany; EL, Greece; HU, Hungary; IS, Iceland; IE, Ireland; IT, Italy; LV, Latvia; LU, Luxembourg; NL, the Netherlands; NO, Norway; PL, Poland; PT, Portugal; SK, Slovakia; SI, Slovenia; ES, Spain; SE, Sweden; UK, United Kingdom.
Change-points in European antibiotic consumption JAC
Downloaded from https://academic.oup.com/jac/article/76/Supplement_2/ii68/6328682 by 81728827 user on 20 October 2021
observed for Austria, Croatia, Denmark, Finland, Greece, Italy, Norway and Portugal. Change-points were located between 2000 and 2012, with the majority of the countries’ change-points located around 2008 (Figure
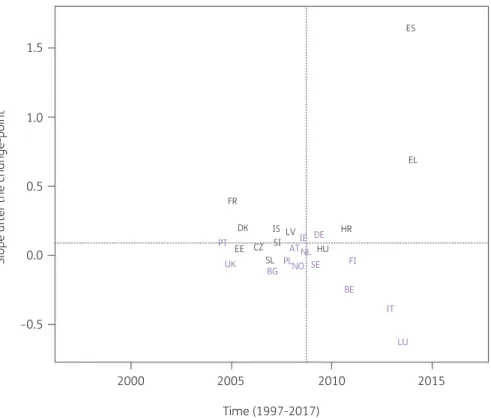
5).Consumption of fluoroquinolones (J01MA) significantly increased between 1997 and the country-specific change-point for all participating countries except Croatia, Latvia, the Netherlands, Portugal, Slovenia, Sweden and the United Kingdom. After the change-point, a significant decrease was observed for Czechia, France, Germany, Italy, Portugal and Sweden. Change-points were located between 2001 and 2010, with the majority of the countries’ change-points located around 2006 (Figure
6).Consumption of extended-spectrum penicillins and combina- tions of penicillins (J01CA and J01CR) significantly increased be- tween 1997 and the country-specific change-point for Belgium, Greece, Italy, Luxembourg, Portugal and Spain (private prescrip- tions included from 2016 onwards) while it significantly decreased for Estonia, France, Hungary, Iceland and Slovakia. After the change-point, a significant increase was observed for Croatia, France, Greece, Iceland and Spain (private prescriptions included from 2016 onwards) while a significant decrease was observed for Belgium, Italy and Luxembourg. Change-points were located between 2005 and 2013, with the majority of the countries’
change-points located around 2008 (Figure
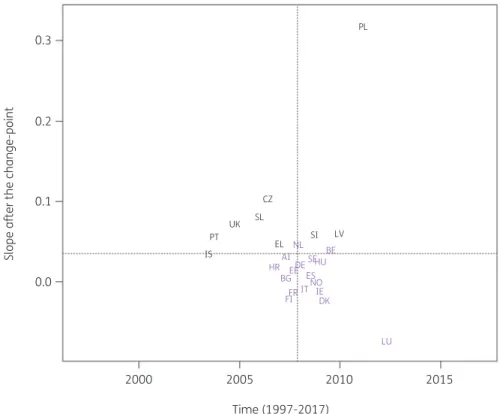
7).Consumption of nitrofuran derivatives (J01XE) significantly increased between 1997 and the country-specific change-point for Luxembourg and Poland while it significantly decreased for Iceland. After the change-point, a significant increase was observed for Czechia, Iceland, Poland and Slovenia. Change-points were located between 2003 and 2012, with the majority of the countries’ change-points located around 2008 (Figure
8).Including a third change-point (Model 4) resulted in non- convergence for all subgroups under study, indicating that the maximum number of common change-points was two.
15Discussion
For the majority of the subgroups under study, the country-specific change-point model (Model 5) provided the best fit. This is not surprising given the heterogeneity in antibiotic consumption in the community between EU/EEA countries. Previous studies on antibiotic consumption in Europe have pointed out this hetero- geneity between EU/EEA countries with marked North-to-South and West-to-East gradients for both antibiotic consumption and resistance.
34Data on tetracycline consumption in the community show that there are two common change-points: one in 2004 and one in 2011. However, the evolution of tetracycline consumption over time is country-specific with some countries showing increasing,
0.30.2
0.1
Slope after the change-point
0.0
–0.1
–0.2
2000 2005
Time (1997-2017)
2010 2015
PL
BG
ES
EE IS HU
DK NL
NO SE AT UK FI IE
IT PT
LU
EL HR
LV SI
BE
FR CZ DE SL
Figure 3. Estimated country-specific trend after the change-point versus location of the country-specific change-point for the consumption of cepha- losporins (ATC J01DB, J01DC, J01DD and J01DE) in the community obtained from fitting Model 5 on yearly data from 26 EU/EEA countries, 1997–
2017. Dotted lines indicate averages. Country labels in black indicate an increase in the trend after versus before the change-point. Country labels in purple indicate a decrease in the trend after versus before the change-point. For Spain, private prescription data are included from 2016 onwards. AT, Austria; BE, Belgium; BG, Bulgaria; HR, Croatia; CZ, Czechia; DK, Denmark; EE, Estonia; FI, Finland; FR, France; DE, Germany; EL, Greece; HU, Hungary; IS, Iceland; IE, Ireland; IT, Italy; LV, Latvia; LU, Luxembourg; NL, the Netherlands; NO, Norway; PL, Poland; PT, Portugal; SK, Slovakia; SI, Slovenia; ES, Spain; SE, Sweden; UK, United Kingdom.
Downloaded from https://academic.oup.com/jac/article/76/Supplement_2/ii68/6328682 by 81728827 user on 20 October 2021
0.1
0.0
Slope after the change-point
–0.1
–0.2
2000 2005
Time (1997-2017)
2010 2015
SL
IT
LU NO
DK BE FR NL PT
DE
IS IE
SI UK
AT BG
ES SE
FI LV
EE PL
CZ EL
HU HR
Figure 4. Estimated country-specific trend after the change-point versus location of the country-specific change-point for the consumption of combi- nations of sulphonamides and trimethoprim (ATC J01EE) in the community obtained from fitting Model 5 on yearly data from 26 EU/EEA countries, 1997–2017. Dotted lines indicate averages. Country labels in black indicate an increase in the trend after versus before the change-point. Country labels in purple indicate a decrease in the trend after versus before the change-point. For Spain, private prescription data are included from 2016 on- wards. AT, Austria; BE, Belgium; BG, Bulgaria; HR, Croatia; CZ, Czechia; DK, Denmark; EE, Estonia; FI, Finland; FR, France; DE, Germany; EL, Greece; HU, Hungary; IS, Iceland; IE, Ireland; IT, Italy; LV, Latvia; LU, Luxembourg; NL, the Netherlands; NO, Norway; PL, Poland; PT, Portugal; SK, Slovakia; SI, Slovenia; ES, Spain; SE, Sweden; UK, United Kingdom.
0.2
ES
BE LV LU
IS SE
IE CZ SL PL
FI PT SI FR
EE
AT
IT
EL HR
NO DK BG
NL DE HU
UK
0.0
–0.2
Slope after the change-point
–0.4
–0.6
2000 2005
Time (1997-2017)
2010 2015
Figure 5. Estimated country-specific trend after the change-point versus location of the country-specific change-point for the consumption of macrolides (ATC J01FA) in the community obtained from fitting Model 5 on yearly data from 26 EU/EEA countries, 1997–2017. Dotted lines indicate averages. Country labels in black indicate an increase in the trend after versus before the change-point. Country labels in purple indicate a decrease in the trend after versus before the change-point. For Spain, private prescription data are included from 2016 onwards. AT, Austria; BE, Belgium; BG, Bulgaria; HR, Croatia; CZ, Czechia;
DK, Denmark; EE, Estonia; FI, Finland; FR, France; DE, Germany; EL, Greece; HU, Hungary; IS, Iceland; IE, Ireland; IT, Italy; LV, Latvia; LU, Luxembourg; NL, the Netherlands; NO, Norway; PL, Poland; PT, Portugal; SK, Slovakia; SI, Slovenia; ES, Spain; SE, Sweden; UK, United Kingdom.
Change-points in European antibiotic consumption JAC
Downloaded from https://academic.oup.com/jac/article/76/Supplement_2/ii68/6328682 by 81728827 user on 20 October 2021
and other decreasing, tetracycline consumption in the periods 1997–2004, 2005–2011 and 2012–2017. Similarly for narrow- spectrum and penicillinase-resistant penicillins, two common change-points were observed: one in 2001 and one in 2006.
However, in addition for this subgroup, the evolution over time was country-specific.
For antibacterials for systemic use and for the remaining sub- groups, models with one country-specific change-point provided a better fit. These country-specific change-points were spread out between 2001 and 2013. For most countries, the trend in antibiotic consumption after the change-point remained quite close to the general trend. However, exceptions were the steep decrease in macrolide consumption in Greece after 2007 (Figure
5) and thesteep increase in consumption of extended-spectrum penicillins and combinations of penicillins in Spain (private prescriptions included from 2016 onwards) after 2013 (Figure
7). For macrolideconsumption, both increases and decreases in consumption were observed with the largest increase reported for Spain (private pre- scriptions included from 2016 onwards). Similarly for extended- spectrum penicillins and combinations of penicillins, both increases and decreases in consumption were observed with the largest de- crease reported for Luxembourg.
Consumption of antibacterials for systemic use increased in some countries, while it decreased in other countries, with the
largest increase reported for Spain (private prescriptions included from 2016 onwards) and the largest decrease reported for Finland (Figure
2). For cephalosporins, consumption increased for somecountries, while it decreased for other countries. The largest in- crease was reported for Poland and the largest decrease for Luxembourg (Figure
3). A limiting factor of the analysis of this sub-group is that cephalosporin consumption data were pooled but consumption of the different generations of cephalosporins may have varied over time.
24,35For combinations of sulphonamides and trimethoprim (Figure
4) and fluoroquinolones (Figure6), both increases and decreaseswere observed for individual countries. The largest increases were reported for Slovakia and Bulgaria, respectively, while the largest decreases were reported for Slovenia and Portugal, respectively.
Fluoroquinolones are commonly used antibiotics, which are often prescribed for non-approved conditions or inappropriately pre- scribed for viral infections.
26Additionally, their use should be restricted due to potential severe side-effects.
36The increasing trend of fluoroquinolone consumption, particularly in Bulgaria and Hungary suggests increasing inappropriate use of this important group of antibiotics and is worrisome.
34,37For the nitrofuran derivatives (Figure
8), no significant changewas observed for most countries while a significant increase was reported for Czechia, Iceland, Poland and Slovenia. This could be
0.050.00
–0.05
Slope after the change-point –0.10
–0.15
2000 2005
Time (1997-2017) 2010
BG
HU
PL SL
EE IS FI UK AT HR SI SE NL
NO
DK ES
IE LU LV
EL
DE IT
PT FR CZ BE
2015
Figure 6. Estimated country-specific trend after the change-point versus location of the country-specific change-point for the consumption of fluoro- quinolones (ATC J01MA) in the community obtained from fitting Model 5 on yearly data from 26 EU/EEA countries, 1997–2017. Dotted lines indicate averages. Country labels in black indicate an increase in the trend after versus before the change-point. Country labels in purple indicate a decrease in the trend after versus before the change-point. For Spain, private prescription data are included from 2016 onwards. AT, Austria; BE, Belgium; BG, Bulgaria; HR, Croatia; CZ, Czechia; DK, Denmark; EE, Estonia; FI, Finland; FR, France; DE, Germany; EL, Greece; HU, Hungary; IS, Iceland; IE, Ireland; IT, Italy; LV, Latvia; LU, Luxembourg; NL, the Netherlands; NO, Norway; PL, Poland; PT, Portugal; SK, Slovakia; SI, Slovenia; ES, Spain; SE, Sweden; UK, United Kingdom.
Downloaded from https://academic.oup.com/jac/article/76/Supplement_2/ii68/6328682 by 81728827 user on 20 October 2021
related to more appropriate prescribing for urinary tract infections as recommended by many guidelines or an increased interest in nitrofuran derivatives to compensate for antibiotic resistance to other commonly prescribed antibiotics such as fluoroquinolones and combinations of sulphonamides and trimethoprim.
38,39However, the increase in consumption of nitrofuran derivatives was only accompanied by a significant decrease in combinations of sulphonamides and trimethoprim in Poland and Slovenia, but not in Czechia or Iceland, and by a significant decrease in con- sumption of fluoroquinolones for Czechia, but not for Slovenia, Poland or Iceland. Another possible explanation for the increase in nitrofuran derivatives could be over-the-counter availability of nitrofurantoin in several countries.
40In order to explain why change-points occurred at specific points in time, three elements should be considered. The first element is the infection rate in consecutive years, with a low (or high) infection rate resulting in low (or high) antibiotic consump- tion. For example, when analysing yearly consumption data, one calendar year may include zero, one or two seasonal influenza epi- demics, which would affect antibiotic consumption. This could be avoided by using quarterly data. Within the infection rate, we need to consider both the bacterial and the viral infection rate as antibi- otics are often inappropriately prescribed for viral infections, main- ly respiratory tract infections during the winter months. This element could be of particular interest to explain some of the
change-points observed for antibiotics that are often overused during, for example, seasonal influenza epidemics.
A second element to be considered when explaining the loca- tion of the change-points are actions such as public awareness campaigns on prudent antibiotic use and antibiotic resistance, shortages and imposed restrictions. These could occur at different points in time for individual EU/EEA countries with the aim to re- duce unnecessary antibiotic use and therewith the occurrence of resistance.
41National evaluations of such campaigns have been reported for Belgium and France.
42–45However, we recommend that each country conducts an extensive review on its public awareness campaigns to better understand the reported country- specific change-points.
A third element to take into consideration when interpreting the results of the change-point analysis is the change of package size driven by companies’ packaging practices. In general, over the years, pharmaceutical companies have increased the number of doses per package, which, for some countries, may have had an ef- fect on consumption rates when expressed in DDD per 1000 inhab- itants per day.
46–48Because the change-point analysis detects the most significant change in trend, care should be taken in comparing detected change-points with previous research. Changing the number of included countries could have an effect on the location of common change-points, and changing the time-frame could have an effect
1.51.0
0.5
Slope after the change-point 0.0
–0.5
2000 2005
Time (1997-2017)
2010 2015
ES
EL
FR DK PT EE
UK BG NO SE
ATNL IE DE
FI
BE IT
LU PL
CZ SL
SI
IS LV HR
HU
Figure 7. Estimated country-specific trend after the change-point versus location of the country-specific change-point for the consumption of extended-spectrum penicillins and of combinations of penicillins combined (ATC J01CA and J01CR) in the community obtained from fitting Model 5 on yearly data from 26 EU/EEA countries, 1997–2017. Dotted lines indicate averages. Country labels in black indicate an increase in the trend after versus before the change-point. Country labels in purple indicate a decrease in the trend after versus before the change-point. For Spain, private pre- scription data are included from 2016 onwards. AT, Austria; BE, Belgium; BG, Bulgaria; HR, Croatia; CZ, Czechia; DK, Denmark; EE, Estonia; FI, Finland;
FR, France; DE, Germany; EL, Greece; HU, Hungary; IS, Iceland; IE, Ireland; IT, Italy; LV, Latvia; LU, Luxembourg; NL, the Netherlands; NO, Norway; PL, Poland; PT, Portugal; SK, Slovakia; SI, Slovenia; ES, Spain; SE, Sweden; UK, United Kingdom.
Change-points in European antibiotic consumption JAC
Downloaded from https://academic.oup.com/jac/article/76/Supplement_2/ii68/6328682 by 81728827 user on 20 October 2021
on the locations of both country-specific and common change- points. Our recommendation for the included countries is to inter- pret their results as presented in this article with caution and use the tutorial included in this series to conduct a change-point ana- lysis when evaluating changes in guidelines or regulations, public awareness campaigns, or other national interventions.
31In conclusion, the heterogeneity of antibiotic consumption across EU/EEA countries required country-specific change-points to assess changes in consumption over the period 1997–2017.
However, given the above-mentioned limitations of a model con- taining country-specific change-points, our recommendation is that each individual country conducts its own analysis, based on the tutorial in this series, with its own data and additional context- ual information, e.g. influenza epidemics, awareness campaigns and change in package size, when evaluating national inter- ventions to improve antibiotic consumption in the community.
Acknowledgements
We are grateful to the National Focal Points for Antimicrobial Consumption, Operational Contact Points for Epidemiology — Antimicrobial Consumption and Operational Contact Points for TESSy/IT data manager — Antimicrobial Consumption, that constitute the European Surveillance of Antimicrobial Consumption Network (ESAC- Net), for their engagement in collecting, validating and reporting anti- microbial consumption data to ECDC. In addition, we would like to thank
Vera Vlahovic-Palcevski (consultant for ECDC) for her critical reading of the manuscript.
Members of the ESAC-Net study group
Reinhild Strauss (Austria), Eline Vandael (Belgium), Stefana Sabtcheva (Bulgaria), Marina Payerl-Pal (Croatia), Isavella Kyriakidou (Cyprus), Jirı´
Vlcek (Czechia), Ute Wolff So¨nksen (Denmark), Elviira Linask (Estonia), Emmi Sarvikivi (Finland), Philippe Cavalie´ (France), Karin Gro¨schner (Germany), Flora Kontopidou (Greece), Ma´ria Matuz (Hungary), Gudrun Aspelund (Iceland), Ajay Oza (Ireland), Filomena Fortinguerra (Italy), Andis Seilis (Latvia), Jolanta Kuklyte (Lithuania), Marcel Bruch_ (Luxembourg), Peter Zarb (Malta), Stephanie Natsch (the Netherlands), Hege Salvesen Blix (Norway), Anna Olczak-Pienkowska (Poland), Ana Silva (Portugal), Ionel Iosif (Romania), Toma´s Tesar (Slovakia), Milan Cizman (Slovenia), Mayte Alonso Herreras (Spain), Vendela Bergfeldt (Sweden) and Berit Mu¨ller-Pebody (the United Kingdom).
Funding
R.B. is funded as a postdoctoral researcher by the Research Foundation—Flanders (FWO 12I6319N). N.H. acknowledges support from the University of Antwerp scientific chair in Evidence-Based Vaccinology, financed in 2009#2020 by an unrestricted grant from Pfizer and in 2016–2019 from GSK. Support from the Methusalem finance programme of the Flemish Government is gratefully acknowledged.
0.3
0.2
Slope after the change-point
0.1
0.0
2000 2005
Time (1997-2017)
2010 2015
PL
CZ UK SL PT IS
EL
LV
LU DK
IE ESNO HRAIEEDESEHU
NL BE
FRIT BG
FI SI
Figure 8. Estimated country-specific trend after the change-point versus location of the country-specific change-point for the consumption of nitro- furan derivatives (ATC J01XE) in the community obtained from fitting Model 5 on yearly data from 26 EU/EEA countries, 1997–2017. Dotted lines indi- cate averages. Country labels in black indicate an increase in the trend after versus before the change-point. Country labels in purple indicate a decrease in the trend after versus before the change-point. For Spain, private prescription data are included from 2016 onwards. For Ireland, consumption of nitrofurantoin (J01XE01) was not included. AT, Austria; BE, Belgium; BG, Bulgaria; HR, Croatia; CZ, Czechia; DK, Denmark; EE, Estonia;
FI, Finland; FR, France; DE, Germany; EL, Greece; HU, Hungary; IS, Iceland; IE, Ireland; IT, Italy; LV, Latvia; LU, Luxembourg; NL, the Netherlands;
NO, Norway; PL, Poland; PT, Portugal; SK, Slovakia; SI, Slovenia; ES, Spain; SE, Sweden; UK, United Kingdom.
Downloaded from https://academic.oup.com/jac/article/76/Supplement_2/ii68/6328682 by 81728827 user on 20 October 2021
Transparency declarations
The authors have none to declare. This article is part of a Supplement.
References
1 WHO. WHO 2019 AWaRe Classification Antibiotics release. https://www.
who.int/news/item/01-10-2019-who-releases-the-2019-aware-classifica tion-antibiotics.
2 Lipsitch M, Samore MH. Antimicrobial use and antimicrobial resistance: a population perspective.Emerg Infect Dis2002;8: 347–54.
3 Harbarth S, Samore MH. Antimicrobial resistance determinants and future control.Emerg Infect Dis2005;11: 794–801.
4 Ackerman S, Gonzales R. The context of antibiotic overuse.Ann Intern Med 2012;157: 211–2.
5 Nyquist AC, Gonzales R, Steiner JFet al.Antibiotic prescribing for children with colds, upper respiratory tract infections, and bronchitis.JAMA1998;279:
875–7.
6 Cosgrove SE. The Relationship between Antimicrobial Resistance and Patient Outcomes: mortality, Length of Hospital Stay, and Health Care Costs.
Clin Infect Dis2006;42: S82–9.
7 Falagas ME, Tansarli GS, Karageorgopoulos DEet al.Deaths attributable to carbapenem-resistant Enterobacteriaceae infections.Emerg Infect Dis2014;
20: 1170–5.
8 Hoxha A, Ka¨rki T, Giambi Cet al.Attributable mortality of carbapenem-re- sistantKlebsiella pneumoniaeinfections in a prospective matched cohort study in Italy, 2012-2013.J Hosp Infect2016;92: 61–6.
9 European Centre for Disease Prevention and Control (ECDC). European Surveillance of Antimicrobial Consumption Network (ESAC-Net). Stockholm.
2020. https://www.ecdc.europa.eu/en/about-us/partnerships-and-networks/
disease-and-laboratory-networks/esac-net.
10 Ferech M, Coenen S, Malhotra-Kumar Set al.European Surveillance of Antimicrobial Consumption (ESAC): Outpatient antibiotic use in Europe.J Antimicrob Chemother2006;58: 401–7.
11 Ferech M, Coenen S, Dvorakova K et al. European Surveillance of Antimicrobial Consumption (ESAC): outpatient penicillin use in Europe. J Antimicrob Chemother2006;58: 408–12.
12 Coenen S, Ferech M, Dvorakova K et al. European Surveillance of Antimicrobial Consumption (ESAC): outpatient cephalosporin use in Europe.J Antimicrob Chemother2006;58: 413–7.
13 Coenen S, Ferech M, Malhotra-Kumar Set al.European Surveillance of Antimicrobial Consumption (ESAC): outpatient macrolide, lincosamide and streptogramin (MLS) use in Europe. J Antimicrob Chemother 2006; 58:
418–22.
14 Ferech M, Coenen S, Malhotra-Kumar Set al.European Surveillance of Antimicrobial Consumption (ESAC): outpatient quinolone use in Europe.J Antimicrob Chemother2006;58: 423–7.
15 Minalu G, Aerts M, Coenen Set al.Adaptive change-point mixed models applied to data on outpatient tetracycline use in Europe.Stat Model2013;13:
253–74.
16 Adriaenssens N, Coenen S, Versporten Aet al.European Surveillance of Antimicrobial Consumption (ESAC): outpatient antibiotic use in Europe (1997- 2009).J Antimicrob Chemother2011;66: vi3–12.
17 Versportern A, Coenen S, Adriaenssens Net al.European Surveillance of Antimicrobial Consumption (ESAC): outpatient penicillin use in Europe (1997- 2009).J Antimicrob Chemother2011;66: vi12–24.
18 Versporten A, Coenen S, Adriaenssens Net al.European Surveillance of Antimicrobial Consumption (ESAC): outpatient cephalosporin use in Europe (1997-2009).J Antimicrob Chemother2011;66: vi25–35.
19 Adriaenssens N, Coenen S, Versporten Aet al.European Surveillance of Antimicrobial Consumption (ESAC): outpatient macrolide, lincosamide and streptogramin (MLS) use in Europe (1997-2009. ).J Antimicrob Chemother 2011;66: vi37–45.
20 Adriaenssens N, Coenen S, Versporten Aet al.European Surveillance of Antimicrobial Consumption (ESAC): outpatient quinolone use in Europe (1997–2009).J Antimicrob Chemother2011;66: vi47–56.
21 Coenen S, Adriaenssens N, Versporten Aet al.European Surveillance of Antimicrobial Consumption (ESAC): outpatient use of tetracyclines, sulphona- mides and trimethoprim, and other antibacterials in Europe (1997-2009).
J Antimicrob Chemother2011;66: vi57–70.
22 Bruyndonckx R, Adriaenssens N, Versporten Aet al.Consumption of anti- biotics in the community, European Union/European Economic Area, 1997–
2017: data collection, management and analysis.J Antimicrob Chemother 2021;76Suppl 2: ii2–ii6.
23 Bruyndonckx R, Adriaenssens N, Hens Net al.Consumption of penicillins in the community, European Union/European Economic Area, 1997–2017.
J Antimicrob Chemother2021;76Suppl 2: ii14–ii21.
24 Versporten A, Bruyndonckx R, Adriaenssens Net al.Consumption of ceph- alosporins in the community, European Union/European Economic Area, 1997–2017.J Antimicrob Chemother2021;76Suppl 2: ii22–ii29.
25 Versporten A, Bruyndonckx R, Adriaenssens Net al. Consumption of tetracyclines, sulphonamides and trimethoprim, and other antibacterials in the community, European Union/European Economic Area, 1997–2017.
J Antimicrob Chemother2021;76Suppl 2: ii45–ii59.
26 Adriaenssens N, Bruyndonckx R, Versporten Aet al.Consumption of qui- nolones in the community, European Union/European Economic Area, 1997–
2017.J Antimicrob Chemother2021;76Suppl 2: ii37–ii44.
27 Adriaenssens N, Bruyndonckx R, Versporten Aet al.Consumption of mac- rolides, lincosamides and streptogramins in the community, European Union/European Economic Area, 1997–2017.J Antimicrob Chemother2021;
76Suppl 2: ii30–ii36.
28 Bruyndonckx R, Adriaenssens N, Versporten Aet al. Consumption of antibiotics in the community, European Union/European Economic Area, 1997–2017.J Antimicrob Chemother2021;76Suppl 2: ii7–ii13.
29 WHO collaborating centre for drug statistics methodology. ATC Classification index with DDDs 2019. 2018.
30 Mu¨ller J, Voss A, Ko¨ck Ret al.Cross-border comparison of the Dutch and German guidelines on multidrug-resistant Gram-negative microorganisms.
Antimicrob Resist Infect Control2015;4: 7.
31 Bruyndonckx R, Coenen S, Adriaenssens Net al.Analysing the trend over time of antibiotic consumption in the community: a tutorial on the detection of common change-points.J Antimicrob Chemother2021;76Suppl 2: 2340.
32 Spiegelhalter DJ, Best NG, Carlin BPet al.Bayesian measures of model complexity and fit.J Royal Statistical Soc B2002;64: 583–639.
33 Gelman A, Carlin JBB, Stern HSSet al. Bayesian Data Analysis, 3rd edn.
Texts in Statistical Science. 2014.
34 European Centre for Disease Prevention and Control (ECDC). Surveillance of antimicrobial resistance. 2018. https://www.ecdc.europa.eu/sites/default/
files/documents/surveillance-antimicrobial-resistance-Europe-2018.pdf.
35 Bronzwaer SLAM, Cars O, Udo Buchholz SMet al.A European study on the relationship between antimicrobial use and antimicrobial resistance.Emerg Infect Dis2002;8: 278–82.
36 European Medicines Agency. EMA Curtails Use of Fluoroquinolone, Quinolone Antibiotics. 2018. https://www.medscape.com/viewarticle/
905023.
37 Peterson LR. Squeezing the antibiotic balloon: the impact of antimicrobial classes on emerging resistance.Clin Microbiol Infect2005;11Suppl 5: 4–16.
38 Mckinnell JA, Stollenwerk NS, Jung CWet al.Nitrofurantoin compares fa- vorably to recommended agents as empirical treatment of uncomplicated
Change-points in European antibiotic consumption JAC
Downloaded from https://academic.oup.com/jac/article/76/Supplement_2/ii68/6328682 by 81728827 user on 20 October 2021
urinary tract infections in a decision and cost analysis.Mayo Clin Proc2011;
86: 480–8.
39 Bruyndonckx R, Latour K, Atud GAet al.Time trend of prevalence and sus- ceptibility to nitrofurantoin of urinary MDREscherichia colifrom outpatients.
J Antimicrob Chemother2019;74: 3264–7.
40 Cristina G, Holm A, Bjerrum L. Dangers of over-the-counter nitrofurantoin for urinary tract infection.BMJ2015;351: h4186.
41 Huttner B, Goossens H, Verheij Tet al.Characteristics and outcomes of public campaigns aimed at improving the use of antibiotics in outpatients in high-income countries.Lancet Infect Dis2010;10: 17–31.
42 Sabuncu E, David J, Berne`de-Bauduin Cet al.Significant reduction of anti- biotic use in the community after a nationwide campaign in France, 2002–
2007.PLoS Med2009;6: e1000084.
43 Goossens H, Coenen S, Costers Met al.Achievements of the Belgian Antibiotic Policy Coordination Committee (BAPCOC).Euro Surveill2008;13:
1–4.
44 Goossens H, Guillemot D, Ferech Met al.National campaigns to improve antibiotic use.Eur J Clin Pharmacol2006;62: 373–9.
45 Bruyndonckx R, Coenen S, Hens Net al.Antibiotic use and resistance in Belgium: the impact of two decades of multi-faceted campaigning.Acta Clin Belg2021;76: 280–8.
46 Bruyndonckx R, Hens N, Aerts Met al. Measuring trends of out- patient antibiotic use in Europe: jointly modelling longitudinal data in defined daily doses and packages.J Antimicrob Chemother2014;69:
1981–6.
47 Coenen S, Gielen B, Blommaet Aet al.Appropriate international meas- ures for outpatient antibiotic prescribing and consumption: recommenda- tions from a national data comparison on different measures.J Antimicrob Chemother2014;69: 529–34.
48 Frippiat F, Vercheval C, Layios N. Decreased antibiotic consumption in the Belgian community: is it credible?Clin Infect Dis2016;62: 403–4.
Downloaded from https://academic.oup.com/jac/article/76/Supplement_2/ii68/6328682 by 81728827 user on 20 October 2021