Consumption of quinolones in the community, European Union/European Economic Area, 1997–2017
Niels Adriaenssens1,2*†, Robin Bruyndonckx 1,3†, Ann Versporten1, Niel Hens3,4, Dominique L. Monnet5, Geert Molenberghs3,6, Herman Goossens1, Klaus Weist5and Samuel Coenen 1,2on behalf of the ESAC-Net
study group‡
1Laboratory of Medical Microbiology, Vaccine & Infectious Disease Institute (VAXINFECTIO), University of Antwerp, Antwerp, Belgium;
2Centre for General Practice, Department of Family Medicine & Population Health (FAMPOP), University of Antwerp, Antwerp, Belgium;
3Interuniversity Institute for Biostatistics and statistical Bioinformatics (I-BIOSTAT), Data Science Institute, Hasselt University, Hasselt, Belgium;4Centre for Health Economic Research and Modelling Infectious Diseases, Vaccine & Infectious Disease Institute (VAXINFECTIO), University of Antwerp, Antwerp, Belgium;5Disease Programmes Unit, European Centre for Disease Prevention and Control, Stockholm, Sweden;6Interuniversity Institute for Biostatistics and statistical Bioinformatics (I-BIOSTAT), Catholic University of
Leuven, Leuven, Belgium
*Corresponding author. E-mail: niels.adriaenssens@uantwerpen.be
†These authors contributed equally to this work.
‡Members are listed in the Acknowledgements.
Objectives: Data on quinolone consumption in the community were collected from 30 EU/European Economic Area (EEA) countries over two decades. This article reviews temporal trends, seasonal variation, presence of change-points and changes in the composition of main subgroups of quinolones.
Methods: For the period 1997–2017, data on consumption of quinolones, i.e. ATC group J01M, in the community and aggregated at the level of the active substance, were collected using the WHO ATC/DDD methodology (ATC/
DDD index 2019). Consumption was expressed in DDD per 1000 inhabitants per day and in packages per 1000 inhabitants per day. Quinolone consumption was analysed by subgroups based on pharmacokinetic profile, and presented as trends, seasonal variation, presence of change-points and compositional changes.
Results: In 2017, quinolone consumption in the community expressed in DDD per 1000 inhabitants per day varied by a factor of 8.2 between countries with the highest (Bulgaria) and the lowest (Norway) consumption.
The second-generation quinolones accounted for >50% of quinolone consumption in most countries. Quinolone consumption significantly increased up to 2001, and did not change significantly afterwards. Seasonal variation increased significantly over time. Proportional consumption of third-generation quinolones significantly increased over time relative to that of second-generation quinolones, while proportional consumption of both third- and second-generation quinolones significantly increased relative to that of first-generation quinolones.
Levofloxacin and moxifloxacin represented >40% of quinolone consumption in the community in southern EU/EEA countries.
Conclusions: Quinolone consumption in the community is no longer increasing in the EU/EEA, but its seasonal variation continues to increase significantly as is the proportion of quinolones to treat respiratory infections.
Introduction
This article presents data from the European Surveillance of Antimicrobial Consumption Network (ESAC-Net,1 formerly ESAC) on consumption of quinolones in the community (i.e. pri- mary care sector) for 30 EU/European Economic Area (EEA) countries in 2017. It updates previous ESAC studies published in 2006 and 2011, and in doing so it provides updated compar- able and reliable information on antibiotic consumption
that can aid in fighting the global problem of antimicrobial re- sistance.2,3In 2017, quinolones represented 9.5% of antibiotic consumption in the community.4As in the previous series, qui- nolones were classified in three generations as introduced by Ball,5based on their chemical structure and antimicrobial activ- ity.2,3 The objective of this study was to analyse temporal trends, seasonal variation and the presence of change-points in quinolone consumption in the community for the period
VC The Author(s) 2021. Published by Oxford University Press on behalf of the British Society for Antimicrobial Chemotherapy.
This is an Open Access article distributed under the terms of the Creative Commons Attribution License (http://creativecommons.org/licenses/
Downloaded from https://academic.oup.com/jac/article/76/Supplement_2/ii37/6328675 by University of Szeged user on 20 October 2021
1997–2017, as well as to analyse the composition of quinolone consumption over time.
Methods
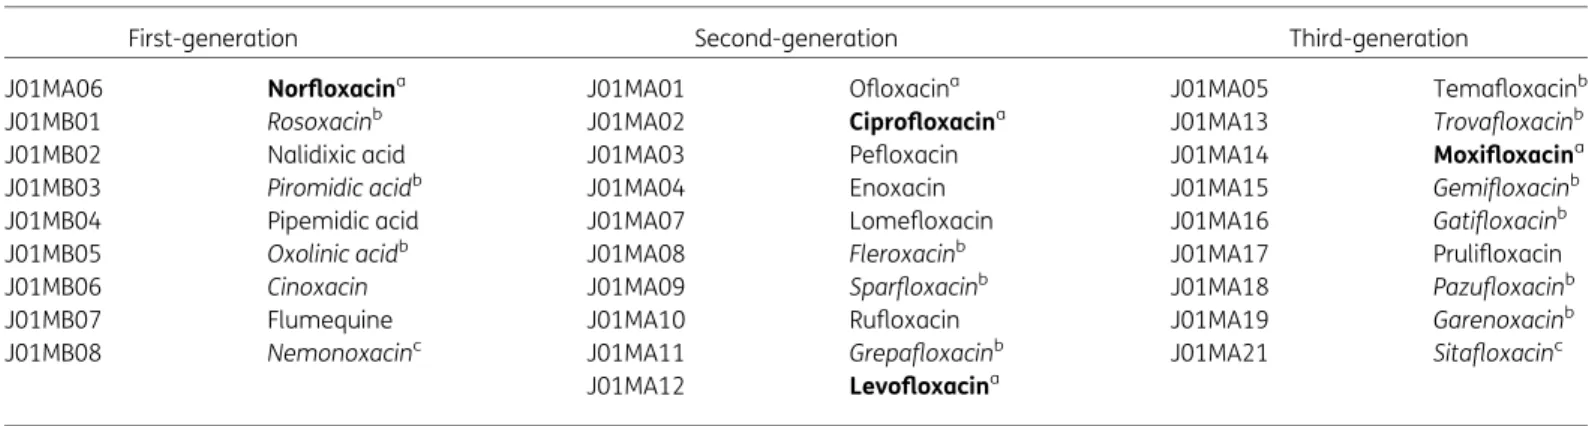
The methods for collecting and analysing the data are described in the introductory article of this series.6In summary, data on the consumption of quinolones, i.e. quinolone antibacterials (ATC group J01M), and aggregated at the level of the active substance, were collected using the WHO ATC/DDD methodology (WHO/ATC index 2019)6and expressed in DDD per 1000 inhabitants per day. In addition, where data were available, quinolone consumption was also expressed in packages per 1000 inhabitants per day. For quinolones, a classification according to chemical structure and antimicrobial activity, subdividing quinolones into three generations was used to assess quinolone consumption in the community in more detail (Table1).5
There are 28 unique ATC codes for quinolones in the ATC/DDD index 2019. Compared with previous descriptions of the consumption of qui- nolones in the community, two additional substances, i.e. sitafloxacin (J01MA21) and nemonoxacin (J01MB08) have been assigned an ATC code by the WHO (Table1).
The evolution of the number of DDD per package over time was assessed using a linear mixed model. The temporal trend, seasonal variation and presence of change-points in quinolone consumption were assessed using a non-linear change-point mixed model fitted to quarterly data expressed in DDD per 1000 inhabitants per day from 1997 to 2017.7The relative proportions of the main subgroups were assessed through a compositional data analysis modelling yearly data expressed in DDD per 1000 inhabitants per day from 1997 to 2017.8
Results
An overview of consumption of quinolones (ATC J01M) in the com- munity, expressed in DDD and packages per 1000 inhabitants per day for all participating countries between 1997 and 2017 is avail- able as Supplementary data at JAC Online (Tables S1 and S2, respectively).
Quinolone consumption in the community in 2017 In 2017, four substances accounted for 90% of quinolone con- sumption in the community expressed in DDD per 1000 inhabi- tants per day: ciprofloxacin (48.6% in 2017 compared with 50.8%
in 2009), levofloxacin (28.8% in 2017 compared with 11.8% in 2009), norfloxacin (10.4% in 2017 compared with 18.2% in 2009) and moxifloxacin (7.2% in 2017 compared with 7.4% in 2009) (Table1).
Figure 1shows quinolone consumption, as well as the con- sumption of the three generations of quinolones, in the commu- nity expressed in DDD per 1000 inhabitants per day in 2017.
Quinolone consumption in the community varied by a factor of 8.2 between countries with the highest (2.86 DDD per 1000 inhabi- tants per day in Bulgaria) and the lowest (0.35 DDD per 1000 inhabitants per day in Norway) consumption, which was higher than in 2009 (factor of 7.5, from 3.61 DDD per 1000 inhabitants per day in Italy to 0.48 DDD per 1000 inhabitants per day in the United Kingdom). We observed substantial inter-country variability in the consumption of first- and third-generation quinolones.
Consumption of second-generation quinolones showed slightly less variability between countries (TableS1).
In 2017, first-generation quinolones (mostly norfloxacin) repre- sented the most consumed quinolone subgroup only in Croatia, and represented >20% of quinolone consumption in the commu- nity in Estonia, Lithuania, Poland and Romania (total care data).
Pipemidic acid was used in five countries. Among the other first- generation quinolones, nalidixic acid was only reported in Romania (total care data) and flumequine was only used in France.
Second-generation quinolones were by far the most widely consumed quinolones in EU/EEA countries. Their consumption exceeded 50% (median 85%) of quinolone consumption in the community in all countries except Croatia. Ciprofloxacin was the most consumed second-generation quinolone in 24 countries; levofloxacin was the most consumed in Bulgaria, Cyprus (total care data), Hungary and Italy; and ofloxacin was the most consumed in France.
Table 1. Clinical classification of quinolones (J01M; ATC/DDD index 2019)
First-generation Second-generation Third-generation
J01MA06 Norfloxacina J01MA01 Ofloxacina J01MA05 Temafloxacinb
J01MB01 Rosoxacinb J01MA02 Ciprofloxacina J01MA13 Trovafloxacinb
J01MB02 Nalidixic acid J01MA03 Pefloxacin J01MA14 Moxifloxacina
J01MB03 Piromidic acidb J01MA04 Enoxacin J01MA15 Gemifloxacinb
J01MB04 Pipemidic acid J01MA07 Lomefloxacin J01MA16 Gatifloxacinb
J01MB05 Oxolinic acidb J01MA08 Fleroxacinb J01MA17 Prulifloxacin
J01MB06 Cinoxacin J01MA09 Sparfloxacinb J01MA18 Pazufloxacinb
J01MB07 Flumequine J01MA10 Rufloxacin J01MA19 Garenoxacinb
J01MB08 Nemonoxacinc J01MA11 Grepafloxacinb J01MA21 Sitafloxacinc
J01MA12 Levofloxacina
Bold typeindicates that consumption was part of the top 90% of the community consumption of quinolones (J01M) in 28 EU/EEA countries in 2017;
Italic typeindicates that no consumption of this quinolone was reported in 28 EU/EEA countries in 2017.
aConsumption was part of the top 90% of the community consumption of quinolones (J01M) in 30 EU/EEA countries in 2009.
bNo consumption of this quinolone was reported in 30 EU/EEA countries in 2009.
cThis quinolone was not included in the ATC/DDD index in 2009 and was therefore not reported in 2009.
Adriaenssenset al.
Downloaded from https://academic.oup.com/jac/article/76/Supplement_2/ii37/6328675 by University of Szeged user on 20 October 2021
Among the third-generation quinolones, only moxifloxacin and prulifloxacin were widely consumed in EU/EEA countries during 1997–2017. Moxifloxacin was the most consumed third-gener- ation quinolone in all countries except Italy where prulifloxacin was the most consumed. Sweden also reported limited consump- tion of temafloxacin.
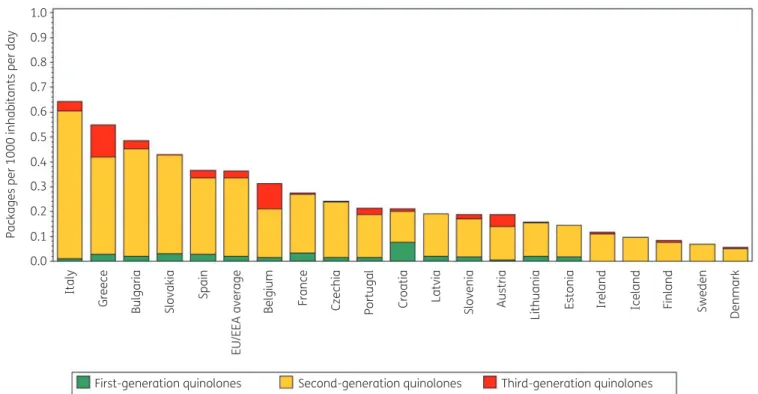
Figure 2 shows quinolone consumption in the community expressed in packages per 1000 inhabitants per day for 20 EU/EEA countries in 2017. Czechia ranked 13th for its quinolone consump- tion in DDD per 1000 inhabitants per day and 8th in packages per 1000 inhabitants per day (Table2). The number of DDD per pack- age ranged from 3.6 in Czechia to 9.1 in Sweden and was higher than in 2009 (from 2.2 in Italy to 8.5 in Sweden in 2009). In the EU/EEA countries, the number of DDD per package did not change significantly over time during 1997–2017.
Longitudinal data analysis, 1997–2017
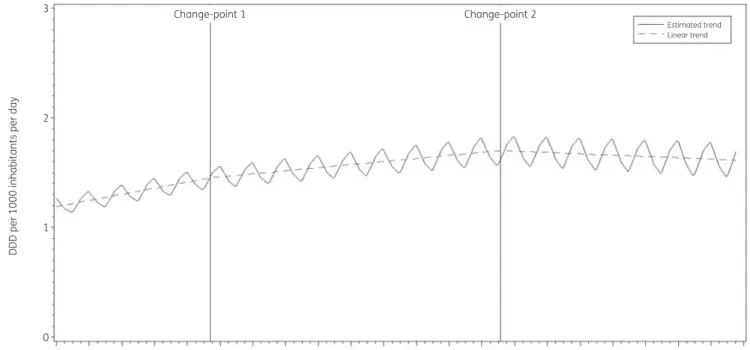
The best fit was obtained for a model including two change-points:
one in the third quarter of 2001 and another in the third quarter of 2010. The final model fits the observed data well (FigureS1). The longitudinal data analysis estimated an average quinolone con- sumption in the EU/EEA of 1.177 (SE 0.187) DDD per 1000 inhabi- tants per day in the first quarter of 1997. In addition, the analysis showed a significant seasonal variation with an amplitude of 0.079 (SE 0.032) DDD per 1000 inhabitants per day, which increased significantly over time (!0.001, SE 0.0002, DDD per 1000 inhabitants per day per quarter). Quinolone consumption sig- nificantly increased (!0.014, SE 0.005, DDD per 1000 inhabitants per day per quarter) between 1997 and the third quarter of 2001.
After this first change-point, no significant change was observed
(!0.007, SE 0.006, DDD per 1000 inhabitants per day per quarter until the third quarter of 2010, after which there was a decrease of
#0.003, SE 0.008, DDD per 1000 inhabitants per day per quarter) (Figure3).
Based on the fitted model, community quinolone consumption in 1997 was significantly higher than average in Belgium, Greece, Italy, Luxembourg, Portugal and Spain, and significantly lower than average in Denmark, Finland, Hungary, Iceland, Lithuania and the United Kingdom (observed profiles shown in Figure S2 andS3). The seasonal variation was significantly larger than aver- age in Belgium, Germany, Hungary, Italy, Luxembourg, Portugal and Spain, and significantly smaller than average in Cyprus (total care data), Denmark, Estonia, Finland, Iceland, Ireland, the Netherlands and the United Kingdom. The increase in quinolone consumption between 1997 and the third quarter of 2001 was significantly larger than average in Belgium and Hungary. The in- crease between the last quarter of 2001 and the third quarter of 2010 was significantly larger than average in Cyprus (total care data), Italy, Lithuania and Slovakia. The decrease in quinolone consumption between the last quarter of 2010 and 2017 was significantly larger than average in Italy and Portugal.
TableS1provides an overview of quinolone consumption in the community in the participating countries between 1997 and 2017.
Quinolone consumption decreased in several countries. This de- crease was the highest in Portugal, but also considerable in Italy and France. The largest increases in quinolone consumption in the community were observed for Cyprus, Romania, Bulgaria, Hungary and Malta. The seasonal variation in quinolone consumption is shown in Figures S2 and S3. In all countries except Belgium and Italy, the mean quinolone consumption in the first and fourth 8
DDD per 1000 inhabitants per day
6
4
2
0
First-generation quinolones Second-generation quinolones Third-generation quinolones
Cyprus Romania Spain Luxembourg Italy Greece Hungary Malta Belgium Croatia
EU/EEA average Poland France Portugal Austria Slovenia Germany Latvia Czechia Lithuania Iceland Ireland Estonia Netherlands Finland Norway
Denmark
Sweden United Kingdom
Slovakia
Bulgaria
Figure 1. Consumption of quinolones (ATC J01M) in the community, expressed in DDD (ATC/DDD index 2019) per 1000 inhabitants per day, 30 EU/
EEA countries, 2017. For Czechia, 2015 data are used. For Slovakia, 2016 data are used. For Cyprus and Romania, total care data, i.e. community and hospital sector combined, are used.
Downloaded from https://academic.oup.com/jac/article/76/Supplement_2/ii37/6328675 by University of Szeged user on 20 October 2021
(winter) quarters did not exceed the mean consumption in the se- cond and third (summer) quarters by >20%. The high seasonal variation in Belgium and Italy resulted from the relatively frequent consumption of third-generation quinolones in the winter quar- ters. Moxifloxacin and levofloxacin showed the highest seasonal variation. Moxifloxacin consumption was >50% higher in winter quarters compared with summer quarters in Austria, Belgium, Estonia, Italy, Latvia, Luxembourg and Portugal. Levofloxacin consumption was >50% higher in winter quarters compared with summer quarters in Austria, Belgium, Croatia, Denmark, Estonia and Finland.
Compositional data analysis, 1997–2009
The proportional consumption of third-generation quinolones sig- nificantly increased over time relative to that of second-generation quinolones, whilst the consumption of both second- and third- generation quinolones significantly increased relative to that of first-generation quinolones (Table3).
Trends of proportional consumption in individual countries are shown in FigureS4. When comparing the composition of quinolone consumption in 2017 with that in 2009, the proportion of first- generation quinolones decreased for most of the participating countries with the largest decreases observed for Czechia (#28.69%; 2015 data), Cyprus (#3.48%; total care data), the Netherlands (#21.07%), Poland (#19.45%) and France (#15.51%). These decreases can mainly be explained by decreas- ing norfloxacin consumption. For Italy and Lithuania, the decrease also resulted from decreasing consumption of pipemidic acid. In most countries, the decrease in the proportion of first-generation
quinolones was matched by a similar increase in the consumption of second-generation quinolones. The largest increases in the pro- portion of second-generation quinolones were observed for Czechia (!28.16%; 2015 data), Cyprus (!25.09%; total care data), the Netherlands (!21.80%) and France (!21.37%). The proportion of third-generation quinolones showed both increases and decreases, with the largest increases observed for Greece (!18.67%), Austria (!10.86%) and Poland (!6.42%), and the larg- est decreases for Portugal (#11.39%), Malta (#9.25%) and Italy (#8.48%).
The proportional consumption of levofloxacin and moxifloxacin combined out of quinolone consumption in the community is shown in FigureS5. In most countries, this proportion has been increasing since they were introduced. In 2017, the proportion of levofloxacin and moxifloxacin combined represented >50% of quinolone consumption in the community in Bulgaria, Cyprus (total care data), Hungary and Italy, >40% in Belgium, Malta and Spain, and >30% in Austria, Finland, Germany, Greece, Portugal and Romania (total care data).
Discussion
This study describes consumption of quinolones in the community in the EU/EEA, which has been described as one of the fastest growing antibiotic classes since the start of surveillance of anti- microbial consumption in Europe in 1997.2,3The longitudinal data analysis shows this increase has in general stopped. Yet, variation between countries has increased, with Bulgaria having the highest quinolone consumption in the community (mainly levofloxacin) in 2017 and some countries, mainly in Southern and Eastern Europe, 1.0
0.9 0.8 0.7 0.6
Packages per 1000 inhabitants per day
0.5 0.4 0.3 0.2 0.1 0.0
Italy Greece Bulgaria Slovakia
First-generation quinolones Second-generation quinolones Third-generation quinolones
Spain EU/EEA average Belgium France Czechia Portugal Croatia Latvia Slovenia Austria Lithuania Estonia Ireland Iceland Finland Sweden Denmark
Figure 2. Consumption of quinolones (ATC J01M) in the community, expressed in packages per 1000 inhabitants per day, 20 EU/EEA countries, 2017.
For Czechia, 2015 data are used. For Slovakia, 2016 data are used. For Cyprus and Romania, total care data, i.e. community and hospital sector com- bined, are used.
Adriaenssenset al.
Downloaded from https://academic.oup.com/jac/article/76/Supplement_2/ii37/6328675 by University of Szeged user on 20 October 2021
showing a substantial increase in quinolone consumption in the community compared with 2009.
In 2017, the consumption of quinolones out of all antibacte- rials for systemic use (J01) ranged from 2.46% in Norway to 21.49% in Cyprus.4 In European countries that are not part of the ESAC-Net but covered by the WHO Europe Antimicrobial Medicines Consumption (AMC) Network, a similar range was observed, i.e. from 0.5% (Kyrgyzstan) to 17.8%
(Kazakhstan) of total, i.e. community and hospital sector com- bined, consumption.9
Ciprofloxacin remained the most consumed quinolone in most countries. Yet, an emerging trend to consume more levofloxacin and moxifloxacin, mainly in countries with a high quinolone consumption, should be noted (Figure S5). Moreover, seasonal variation increased in the EU/EEA over time during 1997–2017 sug- gesting increasing inappropriate use of quinolones to treat respira- tory tract infections. Quinolones must be considered as broad- spectrum antibiotics and are not recommended as first-line antibiotics for the treatment of respiratory tract infections in the community. The potential small superiority of third-generation quinolones, as compared with penicillin and macrolides, for the treatment of respiratory tract infections should be balanced against concerns of selection pressure and cost.10 In addition, ciprofloxacin is contraindicated for the treatment of community- acquired pneumonia because it is not active againstStreptococcus pneumoniae.11Quinolone consumption in DDD per 1000 inhabi- tants as well as seasonal variation of quinolone consumption are among the final set of 12 ESAC drug-specific quality indicators for outpatient antibiotic consumption in Europe.12 The 2017 values for the drug-specific quality indicators are reported in an accompanying article.13The ESAC disease-specific quality indica- tors for outpatient antibiotic use also focus on quinolone consump- tion, with an upper limit of 5% quinolone prescriptions in patients being prescribed an antibiotic for any of the seven listed indications.14In Belgium for example, the National Institute for Health and Disability Insurance (NIHDI) restricted the prescription of quinolones to certain diagnoses (mainly urinary tract) and conditions.15,16A patient will only receive reimbursement for a quinolone prescription in case of adherence to these restrictions.
It is too soon to evaluate this policy change with the available ESAC-Net data, but preliminary results show that between 2017 and 2018 the consumption of fluoroquinolones in the community declined by 46% when based on reimbursement data but only by 25% based on sales data.17This suggests that such policy inter- ventions need careful implementation as prescribing and choice of an antibiotic according to the guidelines is an individual doctor’s decision.
Based on a recommendation from EMA and following the sus- pension of the marketing authorization of medicines containing cinoxacin, flumequine, nalidixic acid, and pipemidic acid, the European Commission decided to restrict the use of the remaining fluoroquinolones because of the risk of disabling and potentially permanent side-effects. According to the EMA’s recommendation, fluoroquinolones should not be used (a) to treat infections that might get better without treatment or infections that are not se- vere (such as throat infections); (b) to treat non-bacterial infec- tions, e.g. non-bacterial (chronic) prostatitis; (c) to prevent traveller’s diarrhoea or recurring lower urinary tract infections (urine infections that do not extend beyond the bladder); (d) to Table2.Rankingofconsumptionofquinolones(ATCJ01M)inthecommunity,expressedinDDDsorpackagesper1000inhabitantsperday,20EU/EEAcountries,2017 CountryItalyGreeceBulgariaSlovakiaSpainBelgiumFranceCzechiaPortugalCroatiaLatviaSloveniaAustriaLithuaniaEstoniaIrelandIcelandFinlandSwedenDenmark Rankingfor packagesper 1000inhabitants perday
1234567891011121314151617181920 Rankingfor DDDper 1000inhabitants perday
3415268139712111014171615181920 NumberofDDD perpackage4.24.75.95.37.77.05.03.65.97.15.45.96.65.65.47.08.48.19.17.8 ForCzechia,2015dataareused.ForSlovakia,2016dataareused.ForCyprusandRomania,totalcaredata,i.e.communityandhospitalsectorcombined,areused. Downloaded from https://academic.oup.com/jac/article/76/Supplement_2/ii37/6328675 by University of Szeged user on 20 October 2021
treat mild or moderate bacterial infections unless other antibacter- ial medicines commonly recommended for these infections can- not be used.18
As quinolone consumption should be restricted and mainly reserved for well-defined indications, the high consumption and seasonal variation of quinolones in the community observed in some countries probably indicates non-adherence to prescribing guidelines. From a public health perspective, this is an important consideration, as excessive and inappropriate use of quinolones is associated with the development of quinolone resistance, requires more resources and exposes patients to the additional risk of side effects.19,20
All quinolones (ATC J01M) are listed as Watch group antibiotics in the 2019 WHO Access, Watch or Reserve (AWaRe) classification list.21The continuous monitoring of quinolone consumption in the community can help to assess the impact of future interventions promoting better use of these antibiotics.
For a more-detailed discussion on the limitations of the col- lected data, we refer to the article on antibacterials for systemic use, included in this series.6For a discussion on the limitations of the statistical approach used in this study and potential explana- tions for the common change-points detected through these anal- yses, we refer to the tutorial included in this series.7
In conclusion, even though community quinolone consumption in the EU/EEA stopped increasing, there is still substantial seasonal variation, which suggests inappropriate prescribing of quinolones in the community in many countries. This could be a target for fu- ture awareness campaigns for more-prudent use of antibiotics.
Acknowledgements
We are grateful to the National Focal Points for Antimicrobial Consumption, Operational Contact Points for Epidemiology — Antimicrobial Consumption and Operational Contact Points for TESSy/IT
3 Change-point 1 Change-point 2
Estimated trend Linear trend
2
DDD per 1000 inhabitants per day
1
0
1997 1998 1999 2000 2001 2002 2003 2004 2005 2006 2007 2008 Time (1997-2017)
2009 2010 2011 2012 2013 2014 2015 2016 2017
Parameter
Estimate (std. error)
1.177 (0.187)*
0.014 (0.004)*
-0.007 (0.006)
-0.010 (0.006)
-
0.079 (0.032)*
0.001 (0.0002)*
0.424 (0.027)*
b0 b1 b2 b3 b4 bS0 bS1 d
Figure 3. Estimated trend (solid line) and linear trend (dashed line) of consumption of quinolones (ATC J01M) in the community based on quarterly data, 25 EU/EEA countries, 1997–2017.b0, predicted consumption in the first quarter of 1997;b1, predicted increase (if positive)/decrease (if negative) in consumption per quarter;b2, predicted difference in slope after versus before the first change-point;b3, predicted difference in slope after versus before the second change-point;b4, predicted difference in slope after versus before the third change-point;b0S, predicted amplitude of the upward winter and downward summer peak in consumption;b1S, predicted increase (if positive)/decrease (if negative) of the amplitude of the upward winter and downward summer peak in consumption per quarter;d, shift in timing of the upward winter and downward summer peak from one year to an- other. An asterisk indicates that the result was statistically significant at significance level 0.05.
Adriaenssenset al.
Downloaded from https://academic.oup.com/jac/article/76/Supplement_2/ii37/6328675 by University of Szeged user on 20 October 2021
data manager — Antimicrobial Consumption, that constitute the European Surveillance of Antimicrobial Consumption Network (ESAC- Net), for their engagement in collecting, validating and reporting anti- microbial consumption data to ECDC. In addition, we would like to thank Vera Vlahovic-Palcevski (consultant for ECDC) for her critical reading of the manuscript.
Members of the ESAC-Net study group
Reinhild Strauss (Austria), Eline Vandael (Belgium), Stefana Sabtcheva (Bulgaria), Arjana Tambic Andrasevic (Croatia), Isavella Kyriakidou (Cyprus), Jirı´ Vlcek (Czechia), Ute Wolff So¨nksen (Denmark), Elviira Linask (Estonia), Emmi Sarvikivi (Finland), Karima Hider-Mlynarz (France), Anette Zawinell (Germany), Flora Kontopidou (Greece), Ma´ria Matuz (Hungary), Gudrun Aspelund (Iceland), Karen Burns (Ireland), Filomena Fortinguerra (Italy), Elı¯na Dimin¸a (Latvia), Jolanta Kuklyte (Lithuania),_ Marcel Bruch (Luxembourg), Peter Zarb (Malta), Stephanie Natsch (the Netherlands), Hege Salvesen Blix (Norway), Anna Olczak-Pienkowska (Poland), Ana Silva (Portugal), Gabriel Adrian Popescu (Romania), Toma´s Tesar (Slovakia), MilanCizman (Slovenia), Antonio Lo´pez Navas (Spain), Vendela Bergfeldt (Sweden) and Berit Mu¨ller-Pebody (the United Kingdom).
Funding
R.B. is funded as a postdoctoral researcher by the Research Foundation—Flanders (FWO 12I6319N). N.H. acknowledges support from the University of Antwerp scientific chair in Evidence-Based Vaccinology, financed in 2009–2020 by an unrestricted grant from Pfizer and in 2016–2019 from GSK. Support from the Methusalem finance pro- gramme of the Flemish Government is gratefully acknowledged.
Transparency declarations
The authors have none to declare. This article is part of a Supplement.
Supplementary data
TablesS1andS2and FiguresS1toS5are available asSupplementary dataatJACOnline.
References
1 European Centre for Disease Prevention and Control (ECDC). European Surveillance of Antimicrobial Consumption Network (ESAC-Net). 2020.
2 Ferech M, Coenen S, Malhotra-Kumar Set al.European Surveillance of Antimicrobial Consumption (ESAC): outpatient quinolone use in Europe.J Antimicrob Chemother2006;58: 423–7.
3 Adriaenssens N, Coenen S, Versporten Aet al.European Surveillance on Antimicrobial Consumption: outpatient quinolone use in Europe (1997–
2009).J Antimicrob Chemother2011;66Suppl 6: vi47–56.
4 Bruyndonckx R, Adriaenssens N, Versporten Aet al.Consumption of antibi- otics in the community, European Union/European Economic Area, 1997–
2017.J Antimicrob Chemother2021;76Suppl 2: ii7–ii13.
5 Ball P. Quinolone generations: natural history or natural selection? J Antimicrob Chemother2000;46: 17–24.
6 Bruyndonckx R, Adriaenssens N, Versporten Aet al.Consumption of antibi- otics in the community, European Union/European Economic Area, 1997–
2017: data collection, management and analysis.J Antimicrob Chemother 2021;76Suppl 2: ii2–ii6.
7 Bruyndonckx R, Coenen S, Adriaenssens Net al.Analysing the trend over time of antibiotic consumption in the community: a tutorial on the detection of common change-points.J Antimicrob Chemother2021;76 Suppl 2: ii79–ii85.
8 Faes C, Molenberghs G, Hens Net al.Analysing the composition of out- patient antibiotic use: a tutorial on compositional data analysis.J Antimicrob Chemother2011;66Suppl 6: vi89–94.
9 WHO Regional Office for Europe Antimicrobial Medicines Consumption (AMC) Network. AMC data 2011–2017. 2020.
10 Salkind AR, Cuddy PG, Foxworth JW. Fluoroquinolone treatment of com- munity-acquired pneumonia: a meta-analysis.Ann Pharmacother2002;36:
1938–43.
11 Woodhead M, Blasi F, Ewig Set al.Guidelines for the management of adult lower respiratory tract infections—full version. Clin Microbiol Infect 2011;17: E1–59.
12 Coenen S, Ferech M, Haaijer-Ruskamp FMet al.European Surveillance of Antimicrobial Consumption (ESAC): quality indicators for outpatient antibiotic use in Europe.Qual Saf Health Care2007;16: 440–5.
13 Adriaenssens N, Bruyndonckx R, Versporten Aet al.Quality appraisal of antibiotic consumption in the community, European Union/European Economic Area, 2009 and 2017.J Antimicrob Chemother2021;76Suppl 2:
ii60–ii67.
14 Adriaenssens N, Coenen S, Tonkin-Crine Set al.European Surveillance of Antimicrobial Consumption (ESAC): disease-specific quality indicators for out- patient antibiotic prescribing.BMJ Qual Saf2011;20: 764–72.
15 Bruyndonckx R, Coenen S, Hens Net al.Antibiotic use and resistance in Belgium: the impact of two decades of multi-faceted campaigning.Acta Clin Belg2021;76: 280–8.
16 National institute for health and disability insurance (NIHDI).
Antibiotica die tot de klasse van de (fluoro)chinolonen behoren: terug- betaling vanaf 1 mei 2018 [Antibiotics belonging to the class of (fluoro)- quinolones: reimbursement starting 1 May 2018]. https://www.riziv.
fgov.be/nl/themas/kost-terugbetaling/door-ziekenfonds/geneesmiddel- gezondheidsproduct/terugbetalen/specialiteiten/wijzigingen/Paginas/anti biotica-fluoro-chinolonen.aspx.
17 ECDC Country report: Antimicrobial consumption in Belgium, 2018.
https://www.ecdc.europa.eu/en/antimicrobial-consumption/database/coun try-overview.
18 European Medicines Agency (EMA). Quinolone- and fluoroquinolone-con- taining medicinal products. Amsterdam, 2020. https://www.ema.europa.eu/
Table 3. Change in the composition of the consumption of quinolones (ATC J01M) in the community, expressed in DDD (ATC/DDD index 2019) per 1000 inhabitants per day, 30 EU/EEA countries, as a function of time during 1997–2017
1GQ 2GQ 3GQ
1GQ #0.1230 #0.1865
2GQ 0.1230 #0.0634
3GQ 0.1865 0.0634
Values are estimated changes in the log ratio of the row versus column subgroup of antibiotics with increasing time. Bold type indicates a statis- tically significant effect; positive values represent an increase and nega- tive values represent a decrease.
1GQ, first-generation quinolones; 2GQ, second-generation quinolones;
3GQ, third-generation quinolones.
Downloaded from https://academic.oup.com/jac/article/76/Supplement_2/ii37/6328675 by University of Szeged user on 20 October 2021
en/medicines/human/referrals/quinolone-fluoroquinolone-containing-me dicinal-products.
19 Stewardson AJ, Vervoort J, Adriaenssens Net al.Effect of outpatient anti- biotics for urinary tract infections on antimicrobial resistance among com- mensal Enterobacteriaceae: a multinational prospective cohort study.Clin Microbiol Infect2018;24: 972–9.
20 Megraud F, Coenen S, Versporten Aet al. Helicobacter pyloriresistance to antibiotics in Europe and its relationship to antibiotic consumption.Gut2013;
62: 34–42.
21 WHO. AWaRe Classification antibiotics. https://www.who.int/news/item/
01-10-2019-who-releases-the-2019-aware-classification-antibiotics.
Adriaenssenset al.
Downloaded from https://academic.oup.com/jac/article/76/Supplement_2/ii37/6328675 by University of Szeged user on 20 October 2021