Consumption of antibiotics in the community, European Union/European Economic Area, 1997–2017
Robin Bruyndonckx 1,2*, Niels Adriaenssens1,3, Ann Versporten1, Niel Hens2,4, Dominique L. Monnet5, Geert Molenberghs2,6, Herman Goossens1, Klaus Weist5and Samuel Coenen 1,3on behalf of the ESAC-Net
study group†
1Laboratory of Medical Microbiology, Vaccine & Infectious Disease Institute (VAXINFECTIO), University of Antwerp, Antwerp, Belgium;
2Interuniversity Institute for Biostatistics and statistical Bioinformatics (I-BIOSTAT), Data Science Institute, Hasselt University, Hasselt, Belgium;3Centre for General Practice, Department of Family Medicine & Population Health (FAMPOP), University of Antwerp, Antwerp,
Belgium;4Centre for Health Economic Research and Modelling Infectious Diseases, Vaccine & Infectious Disease Institute (VAXINFECTIO), University of Antwerp, Antwerp, Belgium;5Disease Programmes Unit, European Centre for Disease Prevention and Control, Stockholm, Sweden;6Interuniversity Institute for Biostatistics and statistical Bioinformatics (I-BIOSTAT), Catholic University of
Leuven, Leuven, Belgium
*Corresponding author. E-mail: robin.bruyndonckx@uhasselt.be
†Members are listed in the Acknowledgements section.
Objectives: Data on antibiotic consumption in the community were collected from 30 EU/EEA countries over two decades. This article reviews temporal trends, seasonal variation, presence of change-points and changes in the composition of the main antibiotic groups.
Methods: For the period 1997–2017, data on consumption of antibiotics, i.e. antibacterials for systemic use (ATC group J01), in the community, aggregated at the level of the active substance, were collected using the WHO ATC/DDD methodology (ATC/DDD index 2019). Consumption was expressed in DDD per 1000 inhabitants per day and in packages per 1000 inhabitants per day. Antibiotic consumption was analysed based on ATC-3 groups, and presented as trends, seasonal variation, presence of change-points and compositional changes.
Results: In 2017, antibiotic consumption in the community expressed in DDD per 1000 inhabitants per day var- ied by a factor 3.6 between countries with the highest (Greece) and the lowest (the Netherlands) consumption.
Antibiotic consumption in the EU/EEA did not change significantly over time. Antibiotic consumption showed a significant seasonal variation, which decreased over time. The number of DDD per package significantly increased over time. The proportional consumption of sulphonamides and trimethoprim (J01E) relative to other groups significantly decreased over time, while the proportional consumption of other antibacterials (J01X) relative to other groups significantly increased over time.
Conclusions:Overall, antibiotic consumption in the community in the EU/EEA did not change during 1997–2017, while seasonal variation consistently decreased over time. The number of DDD per package increased during 1997–2017.
Introduction
Over time, misuse of antibiotics has led to antimicrobial resistance, resulting in treatment failure, increased costs of care and elevated mortality. In order to fight this global problem, comparable and re- liable information of antibiotic consumption is essential.1This art- icle presents data from the European Surveillance of Antimicrobial Consumption Network (ESAC-Net2, formerly ESAC) on antibiotic consumption in the community (i.e. primary care sector) for 30 EU/
EEA countries in 1997–2017. It updates previous ESAC studies
published in 2006 and 2011.3,4The objective of this study was to analyse temporal trends, seasonal variation and the presence of change-points in antibiotic consumption in the community for the period 1997–2017, as well as to analyse the composition of anti- biotic consumption over time.
Methods
The methods for collecting and analysing the data are described in the introductory article of this series.5In summary, data on consumption of
VC The Author(s) 2021. Published by Oxford University Press on behalf of the British Society for Antimicrobial Chemotherapy.
This is an Open Access article distributed under the terms of the Creative Commons Attribution License (http://creativecommons.org/licenses/
by/4.0/), which permits unrestricted reuse, distribution, and reproduction in any medium, provided the original work is properly cited.
Downloaded from https://academic.oup.com/jac/article/76/Supplement_2/ii7/6328677 by 81728827 user on 20 October 2021
antibiotics, i.e. antibacterials for systemic use (ATC group J01) aggregated at the level of the active substance, were collected using the WHO ATC/DDD methodology (ATC/DDD index 20196) and expressed in DDD per 1000 inhabitants per day. In addition, where data were available, antibiotic consumption was also expressed in packages per 1000 inhabitants per day.
Antibiotics were classified in 10 ATC groups:b-lactam antibacterials, penicillins (J01C), otherb-lactam antibacterials (J01D), macrolides, lincosa- mides and streptogramins (J01F), quinolone antibacterials (J01M), tetracy- clines (J01A), sulphonamides and trimethoprim (J01E), other antibacterials (J01X), amphenicols (J01B), aminoglycoside antibacterials (J01G) and combinations of antibacterials (J01R). Due to limited consumption of the last three groups, these were combined and their consumption was pre- sented as ‘other antibiotics’.
The evolution of the number of DDD per package over time was assessed using a linear mixed model. The temporal trend, seasonal vari- ation and presence of change-points in antibiotic consumption were assessed using a non-linear change-point mixed model fitted to quarterly data expressed in DDD per 1000 inhabitants per day from 1997 to 2017.7 The relative proportions of the main groups were assessed through a com- positional data analysis modelling yearly data expressed in DDD per 1000 inhabitants per day from 1997 to 2017.8
Results
An overview of consumption of antibacterials for systemic use (ATC J01) in the community, expressed in DDD and packages per 1000 inhabitants per day for all participating countries between 1997 and 2017 is available asSupplementary dataatJACOnline (TablesS1 and S2, respectively).
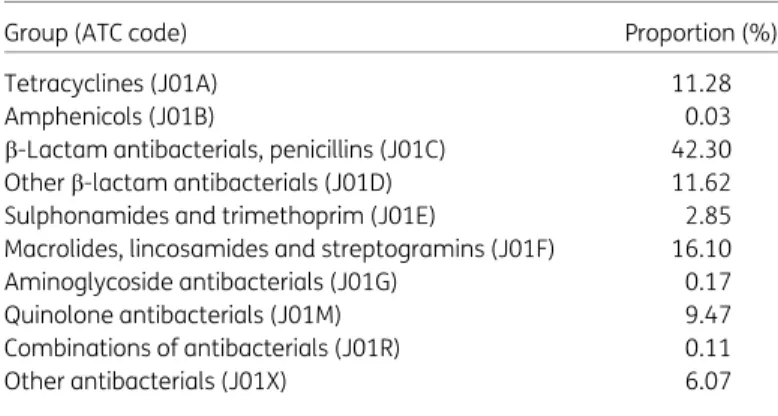
Antibiotic consumption in the community in 2017 The proportion of antibiotics (ATC J01) represented by the main ATC-3 groups is presented in Table1. Figure1shows the consump- tion of antibiotics in the community, expressed in DDD per 1000 inhabitants per day, for 30 EU/EEA countries in 2017. Antibiotic consumption varied by a factor of 3.6 between countries with the highest (32.15 DDD per 1000 inhabitants per day in Greece) and the lowest (8.94 DDD per 1000 inhabitants per day in the Netherlands) consumption in 2017.
The most frequently consumed antibiotics in the community in 2017 were the b-lactam antibacterials, penicillins (J01C), with proportional consumption (out of total consumption) ranging from 27.88% (Poland) to 66.39% (Denmark). The proportional
consumption ranged from 0.22% in Denmark to 23.96% in Greece for otherb-lactam antibacterials (J01D), from 4.77% in Sweden to 26.29% in Luxembourg for macrolides, lincosamides and streptog- ramins (J01F), from 2.46% in Norway to 21.49% in Cyprus (total care data, i.e. community and hospital sector combined) for quin- olone antibacterials (J01M), from 2.51% in Italy to 28.22% in the United Kingdom for tetracyclines (J01A), from 0.07% in Lithuania to 7.55% in Finland for sulphonamides and trimethoprim (J01E), from 0.17% in Ireland (nitrofurantoin (J01XE01) consumption not included) to 27.46% in Norway for other antibacterials (J01X), and from 0.01% in Portugal to 1.51% in Malta for other antibiotics (J01B, J01G and J01R combined).
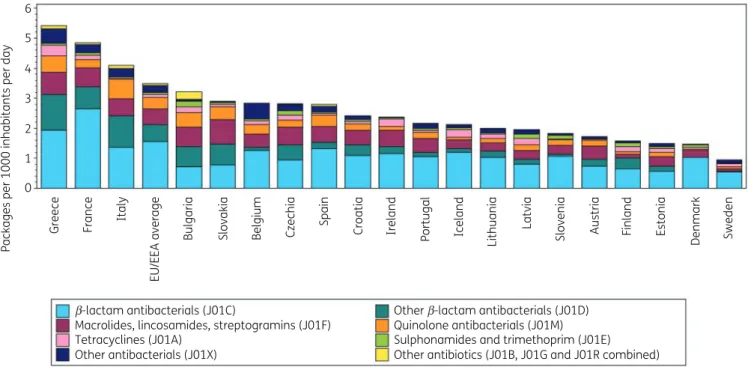
Figure2shows consumption of antibiotics (J01) in the commu- nity expressed in packages per 1000 inhabitants per day for 20 EU/
EEA countries in 2017. Based on packages rather than DDD, Greece also showed the highest consumption (5.42 packages per 1000 inhabitants per day) while Sweden showed the lowest consump- tion (0.95 packages per 1000 inhabitants per day). The ranking of countries for their consumption expressed in DDD per 1000 inhabi- tants per day or in packages per 1000 inhabitants per day was similar (Table2). The lowest mean number of DDD per package was observed for France and Italy (both 4.7 DDD per package) and the highest for Sweden (11.8 DDD per package). In the EU/EEA, the number of DDD per package significantly increased over time dur- ing 1997–2017, with the steepness of this increase significantly reducing over the time period.
Longitudinal data analysis, 1997–2017
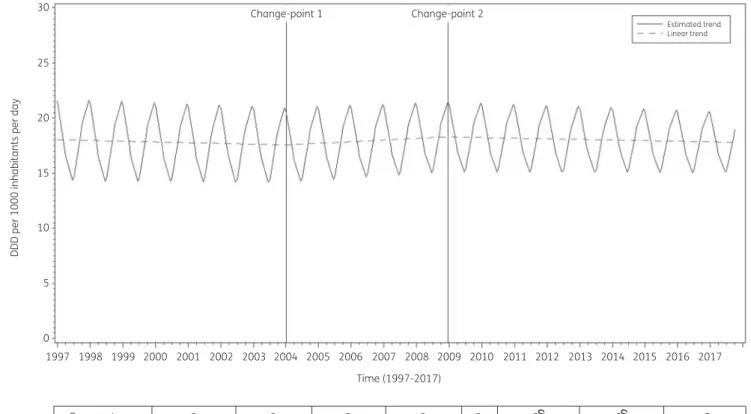
The best fit was obtained for a model including two change-points:
one in the first quarter of 2004 and another in the last quarter of 2008. The final model fits the observed data well (FigureS1).
The longitudinal data analysis estimated an average antibiotic consumption (ATC J01) in the EU/EEA of 18.046 (SE 1.410) DDD per 1000 inhabitants per day in 1997, which did not change signifi- cantly over time:#0.017 (SE 0.022) DDD per 1000 inhabitants per day per quarter between 1997 and the first quarter of 2004;
!0.037 (SE 0.041) DDD per 1000 inhabitants per day per quarter between the second quarter of 2004 and the last quarter of 2008;
and#0.014 (SE 0.059) DDD per 1000 inhabitants per day per quar- ter afterwards. In addition, the analysis showed significant sea- sonal variation with an amplitude of 3.808 (SE 0.342) DDD per 1000 inhabitants per day, which decreased significantly over time:
#0.012 (SE 0.002) DDD per 1000 inhabitants per day per quarter (Figure3).
Based on the final fitted model, antibiotic consumption in the community in 1997 was significantly above average in Belgium, Greece and Slovakia, and significantly below average in Austria, Denmark, Estonia, Germany, the Netherlands, Sweden and the United Kingdom (observed profiles shown in FiguresS2andS3).
The seasonal variation was significantly larger than average in Belgium, Greece, Hungary, Italy, Luxembourg and Slovakia, and significantly smaller than average in Denmark, Estonia, Finland, Iceland, Ireland, the Netherlands, Slovenia, Sweden and the United Kingdom. The decrease in antibiotic consumption be- tween 1997 and the first quarter of 2004 was significantly larger than average in Belgium and Spain. The increase in antibiotic consumption between the second quarter of 2004 and the last quarter of 2008 was significantly larger than average in Table 1.Distribution of antibiotic consumption (ATC J01) in the commu-
nity by ATC level-3, EU/EEA, 2017
Group (ATC code) Proportion (%)
Tetracyclines (J01A) 11.28
Amphenicols (J01B) 0.03
b-Lactam antibacterials, penicillins (J01C) 42.30
Otherb-lactam antibacterials (J01D) 11.62
Sulphonamides and trimethoprim (J01E) 2.85
Macrolides, lincosamides and streptogramins (J01F) 16.10
Aminoglycoside antibacterials (J01G) 0.17
Quinolone antibacterials (J01M) 9.47
Combinations of antibacterials (J01R) 0.11
Other antibacterials (J01X) 6.07
Bruyndonckxet al.
Downloaded from https://academic.oup.com/jac/article/76/Supplement_2/ii7/6328677 by 81728827 user on 20 October 2021
Belgium, Denmark and Lithuania. There were no countries showing a significantly larger than average decrease from the first quarter of 2009 onwards.
Compositional data analysis, 1997–2017
The proportional consumption of sulphonamides and trimetho- prim (J01E) significantly decreased over time relative to 35
30 25 20
DDD per 1000 inhabitants per day
15 10 5 0
b-lactam antibacterials (J01C)
Macrolides, lincosamides, streptogramins (J01F) Tetracyclines (J01A)
Other antibacterials (J01X)
Other b-lactam antibacterials (J01D) Quinolone antibacterials (J01M) Sulphonamides and trimethoprim (J01E) Other antibiotics (J01B, J01G and J01R combined)
Greece Cyprus Spain Romania Poland France Slovakia Belgium Malta Italy Bulgaria Iceland EU/EEA average Czechia United Kingdom Croatia Norway Denmark Finland Lithuania Hungary Germany Latvia Austria Sweden Slovenia Estonia Netherlands
Portugal
Ireland
Luxembourg
Figure 1. Consumption of antibiotics (ATC J01) in the community, expressed in DDD (ATC/DDD index 2019) per 1000 inhabitants per day, 30 EU/EEA countries, 2017. For Czechia, 2015 data are used. For Slovakia, 2016 data are used. For Cyprus and Romania, total care data, i.e. community and hos- pital sector combined, are used. For Ireland, nitrofurantoin (J01XE01) consumption is not included. For Slovenia, sulphonamide and trimethoprim (J01E) consumption is not included.
6 5 4 3 2
Packages per 1000 inhabitants per day
1 0
Greece France Italy EU/EEA average Bulgaria Slovakia Belgium Czechia Spain Croatia Ireland Portugal Iceland Lithuania Latvia Slovenia Austria Finland Estonia Denmark Sweden
b-lactam antibacterials (J01C)
Macrolides, lincosamides, streptogramins (J01F) Tetracyclines (J01A)
Other antibacterials (J01X)
Other b-lactam antibacterials (J01D) Quinolone antibacterials (J01M) Sulphonamides and trimethoprim (J01E) Other antibiotics (J01B, J01G and J01R combined)
Figure 2. Consumption of antibiotics (ATC J01) in the community, expressed in packages per 1000 inhabitants per day, 20 EU/EEA countries, 2017.
For Czechia, 2015 data are used. For Slovakia, 2016 data are used. For Ireland, nitrofurantoin (J01XE01) consumption is not included.
JAC
Downloaded from https://academic.oup.com/jac/article/76/Supplement_2/ii7/6328677 by 81728827 user on 20 October 2021
consumption of all other groups (Table3). The proportional con- sumption of other antibacterials (J01X) significantly increased over time relative to that of all other groups, except for the other antibi- otics (J01B, J01G and J01R combined). In addition, the proportion- al consumption of b-lactam antibacterials (J01C) significantly increased over time relative to that of tetracyclines (J01A) and significantly decreased over time relative to that of quinolone antibacterials (J01M). The proportional consumption of tetracy- clines (J01A) significantly decreased over time relative to that of macrolides, lincosamides and streptogramins (J01F), quinolone antibacterials (J01M) and other antibiotics (J01B, J01G and J01R combined). The proportional consumption of otherb-lactam anti- bacterials (J01D) significantly decreased relative that of quinolone antibacterials (J01M). The proportional consumption of macro- lides, lincosamides and streptogramins (J01F) significantly decreased relative to that of quinolone antibacterials (J01M).
Trends of proportional consumption of antibiotic groups in individual countries are shown in FigureS4. When comparing the composition of the consumption of antibiotics (ATC J01) in 2017 with that in 2009, the proportion of sulphonamides and trimetho- prim (J01E) decreased in most of the participating EU/EEA coun- tries, with the largest decreases observed for Slovenia (#8.92%), Latvia (#5.32%) and Iceland (#5.17%). However, increases were also observed, with the largest increases reported for Slovakia (!3.54%; 2016 data), Romania (!1.94%; total care data, i.e. com- munity and hospital sector combined) and Italy (!1.49%).
The proportion of other antibacterials (J01X) increased in most countries, with the largest increases observed for Poland (!11.00%) and Norway (!8.29%). Decreases were also observed, with the largest decreases reported for Lithuania (#8.24%) and Finland (#1.51%). The proportion ofb-lactam antibacterials (J01C) increased in most countries, with the largest increases observed for France (!11.91%), Portugal (!10.14%) and Croatia (!9.34%).
Decreases were also observed, with the largest decreases observed for Poland (#7.84%), Bulgaria (#7.78%) and Luxembourg (#5.72%). The proportions of tetracyclines (J01A), quinolone antibacterials (J01M), macrolides, lincosamides and streptogramins (J01F) and other b-lactam antibacterials (J01D) increased for some countries while they decreased for others.
More detailed results for the main antibiotic groups are presented in separate articles in this series.9–13
Discussion
We demonstrated that EU/EEA antibiotic consumption in the com- munity expressed in DDD per 1000 inhabitants per day did not change significantly during 1997–2017. In an international study analysing the trend of total (i.e. covering both community and hos- pital sector) antibiotic consumption in 76 countries expressed in DDD per 1000 inhabitants per day, consumption remained stable among high-income countries between 2000 and 2015. Given that the majority of the EU/EEA countries belong to the high-in- come category, this is consistent with the results of our study.14
The analyses also revealed seasonality of antibiotic consump- tion in the community, which was observed for all EU/EEA coun- tries and decreased significantly over time. This may result in a reduction in the incidence of Clostridioides (Clostridium) difficile infections as predicted by mathematical modelling.15 While a limited amount of seasonal variation could be associated with Table2.Rankingofconsumptionofantibiotics(ATCJ01)inthecommunity,expressedinDDDorpackagesper1000inhabitantsperday,20EU/EEAcountries,2017a CountryGreeceFranceItalyBulgariaSlovakiaBelgiumCzechiaSpainCroatiaIrelandPortugalIcelandLithuaniaLatviaSloveniaAustriaFinlandEstoniaDenmarkSweden Rankingby packagesper 1000inhabitants perday
1234567891011121314151617181920 Rankingby DDDper 1000inhabitants perday
1378451021161291516191714201318 NumberofDDD perpackage5.94.74.75.97.37.46.28.96.98.17.68.96.86.25.96.98.66.79.711.8 a ForCzechia,2015dataareused.ForSlovakia,2016dataareused.ForCyprusandRomania,totalcaredataareused.ForIreland,nitrofurantoin(J01XE01)consumptionwasnot included.
Bruyndonckxet al.
Downloaded from https://academic.oup.com/jac/article/76/Supplement_2/ii7/6328677 by 81728827 user on 20 October 2021
seasonality in bacterial pathogens, the extent of the observed seasonality suggests inappropriate prescribing for viral (mostly respiratory) infections during the winter season.16,17In addition, conclusions should not be drawn based on a single quality indica- tor. In a separate article in this series, we evaluated 13 quality indicators, thus allowing for more-solid conclusions.18
We explored countries’ ranking based on antibiotic consumption expressed in DDD per 1000 inhabitants per day or in packages per 1000 inhabitants per day, and found these to be similar. However, since the average number of DDD per package significantly increased between 1997 and 2017, this finding is time-dependent.
Both metrics can be used to summarize a country’s overall antibiotic consumption. In countries solely dispensing complete packages, a package may be considered as a surrogate for a prescription (and hence one treated patient), although some patients may only need half a package while others may need two or more packages.
However, in countries where pharmacies dispense the exact
number of singe units to fulfil a prescription, e.g. the Netherlands and the UK, the number of packages is not a suitable metric and the number of prescriptions instead of the number of packages should be monitored. The DDD is a technical unit defined as the assumed average maintenance dose per day for the main indication of a substance in adults. For antibiotics, the DDD is based on the treat- ment of infections of moderate severity. Its standardization and updates to take into account changes in prescribing practices make the DDD an international standard for surveillance of con- sumption of medicinal products, including antibiotics.19 Nevertheless, the DDD is not a suitable metric for children since the DDD are defined for adults, and specific indicators have been defined for antibiotic consumption in children.20Because our aim in this series was to provide an in-depth overview—in compos- ition and over time—of antibiotic consumption, we used the most complete data, i.e. data expressed in DDD per 1000 inhabi- tants per day, for further analyses.
30 Change-point 1 Change-point 2
Estimated trend Linear trend
25
20
DDD per 1000 inhabitants per day
15
10
5
0
1997 1998 1999 2000 2001 2002 2003 2004 2005 2006 2007 2008 Time (1997-2017)
2009 2010 2011 2012 2013 2014 2015 2016 2017
Parameter b0 b1 b2 b3 b4 bS4 bS4 d
Estimate (std. error)
18.046 (1.410)*
–0.017 (0.022)
0.054 (0.039)
–0.051 (0.050)
–
3.808 (0.342)*
–0.012 (0.002)*
0.399 (0.015)*
Figure 3. Estimated trend (solid line) and linear trend (dashed line) of consumption of antibiotics (ATC J01) in the community based on quarterly data, 25 EU/EEA countries, 1997–2017.b0, predicted consumption in the first quarter of 1997;b1, predicted increase (if positive)/decrease (if negative) in consumption per quarter;b2, predicted difference in slope after versus before the first change-point;b3, predicted difference in slope after versus before the second change-point;b4, predicted difference in slope after versus before the third change-point;b0S, predicted amplitude of the upward winter and downward summer peak in consumption;b1S, predicted increase (if positive)/decrease (if negative) of the amplitude of the upward winter and downward summer peak in consumption per quarter;d, shift in timing of the upward winter and downward summer peak from one year to an- other. *Statistically significant at significance level 0.05.
JAC
Downloaded from https://academic.oup.com/jac/article/76/Supplement_2/ii7/6328677 by 81728827 user on 20 October 2021
The inter-country variability in consumption of antibiotics (ATC J01) expressed in DDD per 1000 inhabitants per day was substantial. This has also been reported for European countries that are not part of the ESAC-Net, but covered by the WHO Europe Antimicrobial Medicines Consumption Network in which consump- tion varied by a factor of 4.3, from 36.4 DDD per 1000 inhabitants per day in Turkey to 8.5 in Azerbaijan.21
Despite changes in DDD values in 2019, which mostly affected the b-lactam antibacterials, penicillins (J01C), this group remained the most consumed antibiotic group in all 30 EU/EEA countries (Czechia 2015 data, Slovakia 2016 data). This finding confirms that of previously published studies.1,2While the proportional consumption of sulphonamides and trimetho- prim (J01E) decreased in most countries, the proportional con- sumption of other antibacterials (J01X) increased in most countries. Given that total antibiotic consumption did not change significantly over time between 1997 and 2017, this implies that consumption of antibiotics from one subgroup was merely replaced by consumption of antibiotics from another subgroup, rather than being reduced overall. More detailed dis- cussions on the main antibiotic groups are given in separate articles in this series.9–13
To further broaden our understanding of appropriate prescribing and the variations between and within EU/EEA countries over time, more detailed data on antibiotic use (e.g.
linked to patient records containing age, gender, indication for prescribing and comorbidities) and antimicrobial resistance rates, and information on treatment guidelines at the national level would be needed.
Nevertheless, the data on antibiotic consumption in the com- munity in EU/EEA countries, available from ESAC-Net, together with the tools of compositional and longitudinal data analyses provided in this series may enable countries to evaluate their own antibiotic consumption by linking their country-specific change- points to possible explanations, e.g. targeted surveillance initia- tives or the implementation of national guidelines. In addition, it
allows countries to evaluate the impact of public awareness cam- paigns and important policy changes for a more prudent use of antibiotics in the community.22
While this study has a major strength in the number of partici- pating countries and the completeness of their recorded data, it has a major limitation in the aggregated nature of the collected data. Because the data only contained information on countries’
antibiotic consumption rates, we were unable to distil any findings by age (e.g. children or elderly) or gender. In addition, the aggrega- tion prevents a distinction between high-but-appropriate and in- appropriate antibiotic prescribing, which is deemed quintessential in fighting overconsumption of antibiotics. For a discussion on the limitations of the statistical approach used in this study and potential explanations for the common change-points detected through these analyses, we refer to the tutorial paper in this series.7
In conclusion, while antibiotic consumption did not change sig- nificantly during 1997–2017, seasonal variation decreased.
Acknowledgements
We are grateful to the National Focal Points for Antimicrobial Consumption, Operational Contact Points for Epidemiology — Antimicrobial Consumption and Operational Contact Points for TESSy/IT data manager — Antimicrobial Consumption, that constitute the European Surveillance of Antimicrobial Consumption Network (ESAC- Net), for their engagement in collecting, validating and reporting anti- microbial consumption data to ECDC. In addition, we would like to thank Vera Vlahovic-Palcevski (consultant for ECDC) for her critical reading of the manuscript.
Members of the ESAC-Net study group
Reinhild Strauss (Austria), Eline Vandael (Belgium), Stefana Sabtcheva (Bulgaria), Arjana Tambic Andrasevic (Croatia), Isavella Kyriakidou (Cyprus), Jirı´ Vlcek (Czechia), Ute Wolff So¨nksen (Denmark), Elviira Linask (Estonia), Emmi Sarvikivi (Finland), Karima Hider-Mlynarz Table 3. Change in the composition of the consumption of antibiotics (ATC J01) in the community, expressed in DDD per 1000 inhabitants per day (ATC/DDD index 2019), 30 EU/EEA countries, as a function of time during the period 1997–2017
J01A J01C J01D J01E J01F J01M J01X Other
J01A #0.023 #0.013 0.031 #0.021 #0.036 #0.072 #0.039
J01C 0.023 0.010 0.054 0.003 #0.013 #0.049 #0.015
J01D 0.013 #0.010 0.044 #0.007 #0.023 #0.054 #0.025
J01E #0.031 #0.054 #0.044 #0.051 #0.067 #0.103 #0.069
J01F 0.021 #0.003 0.007 0.051 #0.016 #0.051 #0.018
J01M 0.036 0.013 0.023 0.067 0.016 #0.036 #0.002
J01X 0.072 0.049 0.054 0.103 0.051 0.036 0.033
Other 0.039 0.015 0.025 0.069 0.018 0.002 #0.033
Values are estimated changes in the log ratio of the row versus column group of antibiotics with increasing time. Bold type indicates a statistically sig- nificant effect; positive values represent an increase and negative values represent a decrease.
J01A, tetracyclines; J01C,b-lactam antibacterials; penicillins J01D, otherb-lactam antibacterials; J01E, sulphonamides and trimethoprim; J01F, mac- rolides, lincosamides and streptogramins; J01M, quinolone antibacterials; J01X, other antibacterials; Other, amphenicols (J01B), aminoglycoside anti- bacterials (J01G) and combinations of antibacterials (J01R), all combined.
Bruyndonckxet al.
Downloaded from https://academic.oup.com/jac/article/76/Supplement_2/ii7/6328677 by 81728827 user on 20 October 2021
(France), Doreen Richter (Germany), Flora Kontopidou (Greece), Ma´ria Matuz (Hungary), Gudrun Aspelund (Iceland), Karen Burns (Ireland), Filomena Fortinguerra (Italy), Elı¯na Dimina (Latvia), Jolanta Kuklyte_ (Lithuania), Marcel Bruch (Luxembourg), Peter Zarb (Malta), Stephanie Natsch (the Netherlands), Hege Salvesen Blix (Norway), Anna Olczak- Pienkowska (Poland), Ana Silva (Portugal), Gabriel Adrian Popescu (Romania), Toma´s Tesar (Slovakia), MilanCizman (Slovenia), Antonio Lo´pez Navas (Spain), Vendela Bergfeldt (Sweden) and Susan Hopkins (the United Kingdom).
Funding
R.B. is funded as a postdoctoral researcher by the Research Foundation—Flanders (FWO 12I6319N). N.H. acknowledges support from the University of Antwerp scientific chair in Evidence-Based Vaccinology, financed in 2009–2020 by an unrestricted grant from Pfizer and in 2016–2019 from GSK. Support from the Methusalem finance pro- gramme of the Flemish Government is gratefully acknowledged.
Transparency declarations
None to declare. This article forms part of a Supplement.
Supplementary data
TablesS1andS2and FiguresS1toS4are available asSupplementary dataatJACOnline.
References
1 French GL. Clinical impact and relevance of antibiotic resistance.Adv Drug Deliv Rev2005;57: 1514–27.
2 European Centre for Disease Prevention and Control (ECDC). European Surveillance of Antimicrobial Consumption Network (ESAC-Net). 2020.
https://www.ecdc.europa.eu/en/about-us/partnerships-and-networks/
disease-and-laboratory-networks/esac-net.
3 Ferech M, Coenen S, Malhotra-Kumar Set al.European Surveillance of Antimicrobial Consumption (ESAC): outpatient antibiotic use in Europe. J Antimicrob Chemother2006;58: 401–7.
4 Adriaenssens N, Coenen S, Versporten Aet al.European Surveillance of Antimicrobial Consumption (ESAC): outpatient antibiotic use in Europe (1997- 2009).J Antimicrob Chemother2011;66: vi3–12.
5 Bruyndonckx R, Adriaenssens N, Versporten Aet al.Consumption of antibi- otics in the community, European Union/European Economic Area, 1997–
2017: data collection, management and analysis.J Antimicrob Chemother 2021;76Suppl 2: ii2–ii6.
6 WHO collaborating centre for drug statistics methodology. ATC Classification index with DDDs 2019. 2018.
7 Bruyndonckx R, Coenen S, Adriaenssens Net al.Analysing the trend over time of antibiotic consumption in the community: a tutorial on the detection
of common change-points. J Antimicrob Chemother 2021; 76 Suppl 2:
ii79–ii85.
8 Faes C, Molenberghs G, Hens Net al.Analysing the composition of out- patient antibiotic use: a tutorial on compositional data analysis.J Antimicrob Chemother2011;66: vi89–94.
9 Bruyndonckx R, Adriaenssens N, Hens Net al.Consumption of penicillins in the community, European Union/European Economic Area, 1997–2017.
J Antimicrob Chemother2021;76Suppl 2: ii14–ii21.
10 Versporten A, Bruyndonckx R, Adriaenssens Net al.Consumption of cephalosporins in the community, European Union/European Economic Area, 1997–2017.J Antimicrob Chemother2021;76Suppl 2:
ii22–ii29.
11 Adriaenssens N, Bruyndonckx R, Versporten Aet al.Consumption of mac- rolides, lincosamides and streptogramins in the community, European Union/European Economic Area, 1997–2017.J Antimicrob Chemother2021;
76Suppl 2: ii30–ii36.
12 Adriaenssens N, Bruyndonckx R, Versporten A et al.
Consumption of quinolones in the community, European Union/
European Economic Area, 1997–2017. J Antimicrob Chemother 2021;
76 Suppl 2: ii37–ii44.
13 Versporten A, Bruyndonckx R, Adriaenssens Net al.Consumption of tetra- cyclines, sulphonamides and trimethoprim, and other antibacterials in the community, European Union/European Economic Area, 1997–2017.
J Antimicrob Chemother2021;76Suppl 2: ii45–ii59.
14 Klein EY, Van Boeckel TP, Martinez EMet al.Global increase and geo- graphic convergence in antibiotic consumption between 2000 and 2015.
Proc Natl Acad Sci USA2018;115: E3463–70.
15 McLure A, Furuya-Kanamori L, Clements ACAet al.Seasonality and com- munity interventions in a mathematical model of Clostridium difficile trans- mission.J Hosp Infect2019;102: 157–64.
16 Walsh TL, Taffe K, Sacca Net al.Risk factors for unnecessary antibiotic prescribing for acute respiratory tract infections in primary care.Mayo Clin Proc Innov Qual Outcomes2020;4: 31–9.
17 Francis NA, Gillespie D, Nuttall Jet al.Antibiotics for acute cough: an inter- national observational study of patient adherence in primary care.Br J Gen Pract2012;62: 429–37.
18 Adriaenssens N, Bruyndonckx R, Versporten Aet al.Quality appraisal of antibiotic consumption in the community, European Union/European Economic Area, 2009 and 2017.J Antimicrob Chemother2021;76Suppl 2:
ii60–ii67.
19 World Health Organisation. WHO report on surveillance of antibiotic con- sumption: 2016-2018 early implementation. 2018. https://www.who.int/
medicines/areas/rational_use/oms-amr-amc-report-2016-2018/en/.
20 Jackson C, Hsia Y, Bielicki JAet al.Estimating global trends in total and childhood antibiotic consumption, 2011-2015.BMJ Glob Health 2019;4:
e001241.
21 WHO Regional Office for Europe Antimicrobial Medicines Consumption (AMC) Network.AMC Data 2011–2017. Copenhagen: WHO Regional Office for Europe; 2020.
22 Bruyndonckx R, Coenen S, Hens Net al.Antibiotic use and resistance in Belgium: the impact of two decades of multi-faceted campaigning.Acta Clin Belg2021;76: 280–8.
JAC
Downloaded from https://academic.oup.com/jac/article/76/Supplement_2/ii7/6328677 by 81728827 user on 20 October 2021