THE DEFORMATION OF CRYSTALLINE AND CROSS-LINKED POLYMERS
I. L. Hopkins and W. O. Baker
I. Introduction 365 1. Stress-Strain Behavior 366
2. Cold Drawing 370 3. Planar Movement in Cold Drawing 377
4. Further Consequences of Crystalline Displacements 379
5. Short-range Displacements in Polymers 383
a. Stress Relaxation 384
6. Creep 384 c. Dynamic Modulus 385
d. Dynamic Viscosity-Frequency Product 385
II. Polyethylene 388 1. Dynamic Properties of Polyethylene 388
2. Stress Relaxation in Polyethylene 396
3. Creep of Polyethylene 396 4. Effect of Extrusion Methods on Properties of Solid Polyethylene 398
5. Extrusion of Liquid Polyethylene as Related to Polymer Structure.... 399
6. Flow Properties of Unmelted Polyethylene in Bulk 401 7. Multiaxial Stressing and Stress-Cracking in Polyethylene 403 III. Hard Rubber: A Highly Polar, Cross-Linked Polymer 408
1. Dynamic Properties of Hard Rubber 408 2. Creep Properties of Hard Rubber 409 3. Stress Relaxation Properties of Hard Rubber 411
IV. Polyamides: Polar Chain Polymers Examined for Both Long and Short
Range Behavior 412 1. Dynamic Properties of Polyamides 413
a. Free Oscillations in Polyamides 413 b. Forced Oscillations in Polyamides 414 2. Stress Relaxation in Polyamides 421
3. Creep in Polyamides 423
V. Conclusion 425 Nomenclature 426
I. Introduction
A discussion of the rheology of crystalline and cross-linked polymers should in some ways resemble that of the dentistry of hens' teeth; i.e., what can be said? The reason is that microcrystallinity on one hand and
365
366 I. L. HOPKINS AND \V. O. BAKER
dense network formation on the other have been developed in polymers largely to prevent flow or, indeed, extensive deformation of any kind.
Hence, in contrast to the other topics in this book, the present chapter will involve special kinds of strains. The really reversible, elastic, displace- ments will be extremely small, generally less than 1 %, and the inelastic ones are likely, in the microcrystalline systems, to be in the range of hundreds of per cent, with a superficial resemblance to true plasticity.
Further, they will be of curious interest in polymer technology because, outside of the field of rubbers, only cold drawing, as in fiber formation of microcrystalline polymers, involves important distortions of severalfold.
Unfortunately, neither of these extremes, of minute deformations or enormous ones, is understood theoretically. This is in contrast to rubbery elasticity and its related viscoelastic formalism. Further, this brief survey will not attempt to expose all the phenomenology of these systems. Rather, the simple principles of chain or network segment motion which must govern this rheology will be, where possible, described and related to molecular qualities of particular plastics. Thereby we hope to couple even closer the test tube and the test lab.
1. STRESS-STRAIN BEHAVIOR
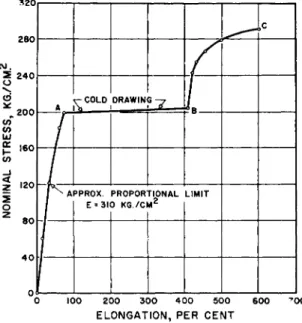
Linear microcrystalline polymers subjected to a uniaxial tension charac- teristically respond with a stress-strain diagram like that shown in Fig. 1.
This is for a high molecular weight polyethylene sebacate. Incidentally, this may have been one of the first substances to have been drawn into a synthetic fiber, in the historic experiments of Carothers,1 although its mechanical properties have not been reported before. The structure of these polymers is essentially paraflinic, with additional cohesion provided by the dipolar layers.2 Hence the strain reported in this curve reflects both a sliding of the hydrocarbon groups and the displacement of strong dipoles, and can fairly be said to be characteristic of most chain polymers.
The early part of the curve looks linear, but more detailed examination will show non-Hookean properties. Hence no particular part of the perform- ance of microcrystalline polymers can be identified solely with the perfectly elastic displacements of atoms or distortion of valence bonds, at ordinary temperatures, or, indeed, perhaps short of liquid nitrogen temperatures.
This curvature in the stress-strain curve has been studied over a range of temperatures and the moduli it denotes have been represented by an expression Ε = EQe~ae where Ε is the slope of a tangent at any point, E0 = the slope at 0 strain, e = the strain, and a = a constant determined for a particular temperature and polymer. Studies using this expression have
1 W. H. Carothers and J. W. Hill, Am. Chem. Soc. 54, 1579 (1932).
2 C. S. Fuller and W. O. Baker, / . Chem. Educ. 20, 3 (1943).
*20
Ο CO (/Γ Id <r
»-CO
—I
<
ο ζ
^ 200 160
80
f
r-COLD Vi DRAWIN
r
/
ΒPPROX.
Ε = 31 PROPOR
0 KG./C TIONAL LIMIT
0 100 200 300 400 500 600 "Ό0 E L O N G A T I O N , P E R C E N T
FIG. 1. Relation of elongation to slowly applied stress in the highly crystalline linear polymer polyethylene sebacate.
included polyethylene. The effects of molecular weight and of some varia- tions in structure were examined. It was concluded by Carey and co- workers that independently of temperature and molecular weight, the relation was that "The product of the initial modulus and the strain at the elastic limit are proportional to the stress at the elastic limit." Since it is well accepted that the "elastic limit'' has to be an arbitrarily defined point, it was desirable to examine the rheology from the very lowest strains upward toward this region in finer detail. Some examples of this have been chosen from recent studies of polyethylene by T. F. Osmer4 of Bell Tele- phone Laboratories. A device giving record of stress-strain behavior at the same time that photoelastic measurements were made has yielded curves shown in the following figures. The complex qualities of this deformation curve (Fig. 2) are well summarized by the creep experiments5 of Gohn and associates, wherein even at stresses of 100 p.s.i. with a creep of 0.01"/
inch after 10,000 hours of continuous loading, there was still not a steady creep rate. Indeed this had not flattened out at 20,000 hours. These findings appear consistent with a later discussion of the dynamics of solid poly-
3 R. H. Carey, E. F. Schulz, and G. J. Dienes, Ind. Eng. Chem. 42, 842 (1950).
4 T. F. Osmer, private communication.
5 G. R. Gohn, J. D . Cummings, and W. C. Ellis, Am. Soc. Testing Materials, Proc.
49, 1139 (1949).
368 I. L. HOPKINS AND W. O. BAKER
1000
2 0 0
/o
—7—-/
—7—-/
28 36
0 4 8 12 16 2 0 2 4
ELONGATION, PER CENT
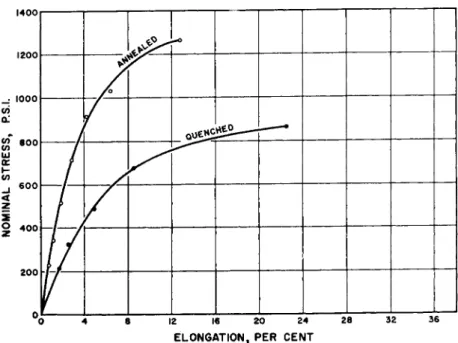
FIG. 2 . The effect of different states of crystallinity on the stress-strain curve of low density polyethylene at 2 5 ° C . The annealed specimen was 0 . 0 3 5 in. thick; the quenched specimen, 0 . 0 3 7 in. thick. Both were 0 . 5 in. wide. Average strain rate was 3 % per minute.
ethylene, in which evidence for a very broad spectrum of relaxation proc- esses is displayed.
The primary significance of Figs. 2 and 3 is direct evidence of the large influence of crystallites on solid polyethylene rheology. Among the non- polar microcrystalline polymers, a great array of which is now known because of the recent use of Ziegler-type catalysts, polyethylene will be taken as reasonably typical. However, the polyethylene of Figs. 2 and 3, and the rest of this part of the discussion, is a low density, imperfectly linear polymer. The linear polyethylene and isotactic hydrocarbon polymers have even more drastic effects of crystallinity on stress-strain properties.
The quenched specimens on Figs. 2 and 3 cannot be assumed to lack all crystallinity, since polyethylene anneals rapidly at 25° C , where the tests were made. However, both density and X-ray scattering showed a minor ordered component, compared to the annealed samples. The almost double initial modulus testifies strongly to the rigidity conferred by tiny paraffin crystals, even separated as they apparently are by a continuous amorphous or mesomorphous phase.
Indeed, these ordered and disordered regions interact on each other mechanically in many subtle, little-known ways. For instance, when the
1200
_· 1000
in
QL W 8 0 0 (/) ω α: h- c/>6 0 0
<
Ζ
2 0 0
I
QUENC
ι— 7^
ι— 7^
12 16 2 0 24
ELONGATION, PER CENT
3 6
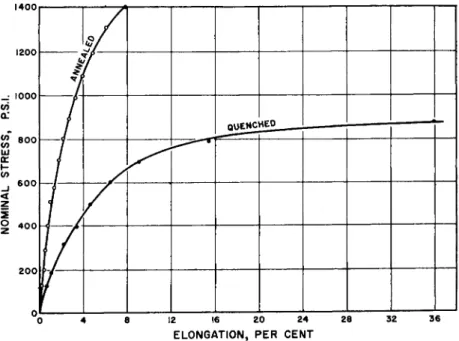
FIG. 3. The effect of different states of erystallinity on low density polyethylene at 25°C at 20X the average strain rate of Fig. 2. The annealed specimen was 0.063 in. thick; the quenched specimen, 0.064 in. thick. Both were 0.5 in. wide. Average strain rate was 60% per minute.
average strain rate of 3 % per minute, in Fig. 2, is raised twentyfold to the 60% per minute of Fig. 3, there is little effect on the quenched curves;
they almost exactly superpose. This is expected from the short relaxation time of amorphous paraffinic chains, as reflected probably in the very low brittle temperature of polyethylene. However, when a large fraction of crystalline regions obtains, the stress-strain curve of Fig. 3 is markedly steeper than at the lower strain rate. Seemingly, some organized rearrange- ments come in even at a few per cent elongation. They involve large num- bers of atoms, both in movement of crystallites in the amorphous solid and probably in plastic slip within the crystallites themselves. Thus, the relaxation times are greatly increased, and the stress builds up rapidly in the strained specimen. Obviously, technical behavior of such systems re- garding impact strength, low temperature flexibility, yield point, creep, and tensile strength will greatly depend on crystalline content and distribu- tion.
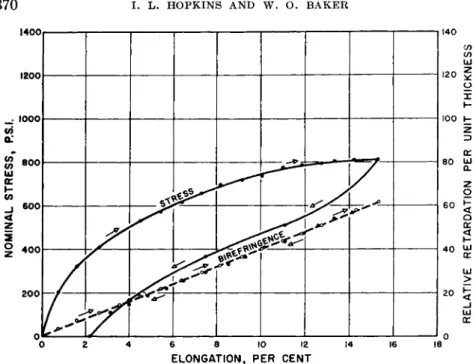
Stress relaxation is also characteristically exhibited in the curve of Fig. 4, in which, however, the stress-optical effect is precisely linear.4, 6 Thus chain orientation over this small strain range seems completely reversible,
6 A. Renfrew and P. Morgan, eds., "Polythene." Interscience, New York, 1957.
370 I. L. HOPKINS AND W. O. BAKER 1400.
1200
1000 Q:
CO in
QC
800
600
400
200
AS
0 2 4 6 8 10 12 14 16 18
/
ELONGATION, PER CENT
FIG. 4. Stress-strain and birefringence relations of low density polyethylene stressed slowly at 25°C. showing irreversible characteristics of deformation but strict reversibility of birefringence. KE Y : 3 , ascending stress;©, descending stress;
O, ascending birefringence; φ, descending birefringence. Average strain rate was 1.5% per minute.
but unrecovered crystallite deformations give large hysteresis loops for mechanical properties. Indeed, in compression tests, where crystallite properties can be greatly suppressed (by rotational disordering7) by elevated temperatures, Fig. 5 illustrates comparative suppression of mechanical hysteresis, compared to Fig. 6. In Fig. 6, low temperature has stiffened both crystals and their "fringes"are so stiffened that recovery progressively disappears. This sort of behavior is usual for chain polymers, and rare except for long times of stressing for chemically cross-linked polymers. If chemical changes in cross linkage accompany the stretching, however, hysteresis is common. The situation with densely cross-bonded structures will be discussed later, particularly for hard rubber.
2. COLD DRAWING
The most spectacular part of the stress-strain curves of macrocrystalline polymers for either uni- or multiaxial stressing is where it flattens out into a plateau. This marks the cold drawing phenomenon where a sharp shoulder
7W . O. Baker, in "High Polymers" (S. B. Twiss, ed.), p. 108. Reinhold, New York, 1945.
1,6 001
COMPRESSION, PER CENT
FIG. 5 . Compression set curves for low density polyethylene at elevated tempera- tures where crystalline deformation is minimized. Specimen was a cylinder, W diameter X high. Rate of test was approximately 5 min. total for loading and unloading each loop. Test temperature, + 1 8 0 ° F .
forms and thin material which is moleeularly highly oriented is pulled out of a more or less unoriented and frequently opaque bulk. This dramatic reduction in cross section, and the lustrous, clear, strong fibers or sheets which it creates, were once thought especially characteristic of linear microcrystalline polymers. Actually both were also present in many early examples of amorphous polymer studies. Indeed the classic report of Hünemörder8 on molecular orientation in polystyrene shows photographs of highly stretched filaments with vestiges of a drawing shoulder visible.
In microcrystalline polymers, however, cold drawing which represents roughly elongation at constant stress (referred to the original cross section) is attended by dramatic reorganization of molecular layers and atomic planes. In the linear polyamides, for example, this leads to beautiful fila- ments giving nylon textiles. In this case, however, the drawing can equally well or actually better be achieved by orientation of the chain axis alone and then subsequent crystallization into oriented crystallites. Similarly,
8M . Hünemörder, Kautschuk 3 ( 3 ) , 1 0 6 ( 1 9 2 7 ) .
372 I. L. HOPKINS AND W. O. BAKER
«OOOi
7 , 0 0 0
0 4 β 1 2 16 2 0 2 4 2 8
C O M P R E S S I O N , P E R C E N T
FIG. 6. Compression set curves for low density polyethylene at low temperatures where plastic behavior prevails over elastic responses. Specimen was a cylinder,
diameter X 3^>" high. Rate of test was approximately 5 min. total for loading and unloading each loop. Test temperature, — 40°F.
stress-strain curves for polyethylene of crystallinity varied by thermal history are indeed typical of the effects also encountered in proceeding to the stage of full cold drawing in polymers of varying crystallinity. However, the point that cold drawing in a phenomenologically similar way can be achieved for either a noncrystalline polyamide or the same one highly crystallized and organized into spherulites, as was long ago shown,9 seems to clarify the question of how this chapter should treat cold drawing. The mesomorphous, but noncrystalline polyamide, which, to repeat, shows typical cold drawing, could not have become heated at the shoulder to within 50° C. or more of the melting point of its crystalline form. If it had, it would have crystallized in the solid according to detailed studies9 widely confirmed. Thus, an amount of heating corresponding closely to heat of fusion of linear polymers does not seem to be critical in the drawing of the mass, at least when it is noncrystalline. Hence, it seems proper to focus mostly on the structural and orientation changes in drawing. That is, it
9 C. S. Fuller, W. 0 . Baker, and N. R. Pape, Am. Chem. Soc. 62, 3275 (1940).
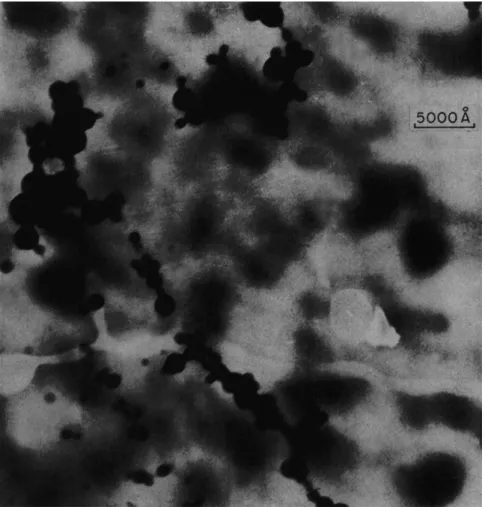
FI G. 7a. Electron micrograph of polyundecanoate polyester showing crystallite sheaves. Original magnification, 3760X.
can be assumed that there is structural continuity between the undrawn and drawn states, although naturally there is a very considerable tempera- ture rise on drawing, as has recently been shown by ingenious observations on thermofluorescent powders.10 Similarly, the detailed study of Marshall and Thompson emphasizes the consequences of the abiadatic working process in polyethyleneterephthalate. Here, there usually is crystallization on drawing of the amorphous polymer, so that the crucial experiment which was noted earlier in the polyamides and might be possible in polyesters at a low temperature, is not normally done.
Microcrystalline polymers characteristically form spherulitic aggregates
10 P. Brauer and F . H. Müller, Kolloid-Z. 135, 65 (1954).
11 I. Marshall and A. B. Thompson, Proc. Hoy. Soc. A221, 541 (1954).
374 I. L. HOPKINS AND W. Ο. BAKER
FT G. 7 6 . Electron micrograph of polydecamethylene sebacamide showing crystal- lite growth from solution. Original magnification, ΙΟ,ΙΟΟΧ.
through their bulk.1 2' 13 Generally these are in the form of sections of spherulites containing very fine sheaves of crystallites \vhose details can be barely discerned in Fig. la for a polyundecanoate polyester of weight average molecular weight about 25,000, but which appear beautifully in the diagrams of Brown14 for polyethylene. Brown's work actually shows a stretched section of one of the thin films which exhibits how the crystallites were made to flow out of the spherulitic sections when the system was
12 C . W . Bunn and T. C . Alcock, Trans. Faraday Soc. 41, 3 1 7 ( 1 9 4 5 ) . 13 S . W . Hawkins and 11. B. Richards, J. Polymer Sei. 4, 5 1 5 ( 1 9 4 9 ) . 14 A. Brown, J. Appl. Phys. 20, 5 5 2 ( 1 9 4 9 ) .
FIG. 7c. Electron micrograph of polyhexamethylene adipamide film showing spherulite clusters of crystalline phase. Original magnification, ΙΟ,ΙΟΟΧ.
oriented. Also, in the linear polyamides, (in a series of electron microscopic studies by C. J. Calbick of the Bell Telephone Laboratories), thin films could be cast on water from cresol or formic acid solution, which then crystallize as the solvent evaporates and grow beautiful spherulites. Fig.
7b shows how these aggregate in polyhexamethylene sebacamide, and Fig.
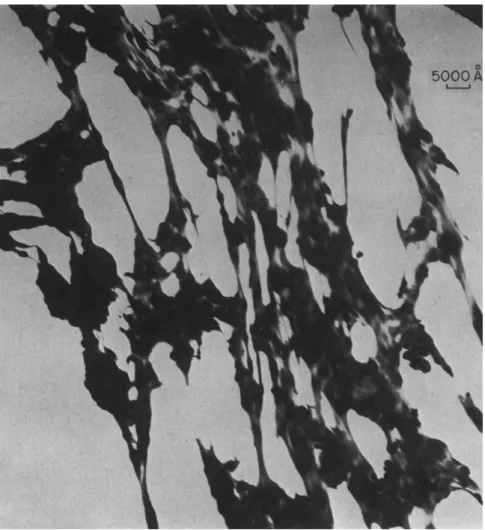
7c is for the familiar nylon 66. In Fig. 7d appears a section of the film of polyhexamethylene adipamide which was stretched in the beam of the electron microscope. These spherulites can easily be seen to appear to flow continuously into the matter drawn out adjacent to them. Perhaps submicroscopic crystallites are being reoriented as the spherulites are
376 I. L. HOPKINS AND W. O. BAKER
FIG. 7d. Electron micrograph of partly drawn film of polyhexamethylene adipa- mide showing distortion of spherulites by fibering. Original magnification, 3760X.
subjected to tension around them, and this is the basic step in the large strain rheology of microcrystalline polymers.
The crystallites and their aggregates, the spherulites already shown to be strongly affected by polymer deformation, are nevertheless largely connected by more or less disordered chains. These disordered chains always tend to pull out so that their long axes eventually line up in the direction of, say, a uniaxial stress. I t is therefore important to know how the arrange- ments of the long chain axis (c-axis in the crystallites) take place in the crystallite. I n this way, some idea of the transmission of stress from the disordered continuum to the crystallites and spherulites can be gained.
The recently discovered principles of spiral growth of crystals generally seem also to apply to polyethylene, at least,1 5 , 16 and probably to poly- amides and others.16 A consequence of this finding was anticipated in an extensive study of the mechanism of crystallization in linear polymers1 7 , 1 8: it caused a spiral arrangement of long chains into fibrillar crystallites, which seems necessary to account for the observed positions of crystal cells in single spherulites.1 9 , 20 Such closely coiled helices of crystallites then are radii of spherulites, or spherulitic sections. Such is the present concept of the chain geometry in the unoriented polymer, on which an external stress (or an internal relaxing force) must work. It leads, in accord with our earlier postulate, to highly organized motions of chain segments along crystal planes and is greatly enriching knowledge of polymer mechan- ics. Indeed, after the great triumph of the kinetic theory of rubbery elas- ticity, and even viscoelasticity, based on independent segment movements, the new findings about orderly motions are peculiarly complementary.
Strikingly, they are appearing as the new isotactic polymers provide overwhelmingly crystalline plastics. For the first time, there may be plastics whose behavior is largely plastic.
3. PLANAR MOVEMENT IN COLD DRAWING
Evidence for this motion of whole planes of atoms occurred in early studies of the disorientation of polyamide filaments caused by heating.9 There was selective growth of the X-ray arcs coming from the main equa- torial reflections, showing that the crystal planes did not go from the oriented to the disoriented state all together, but rather with a selective ease of gliding. Likewise, examination with a tiny X-ray beam of scattering through and on both sides of the neck of a small nylon filament was done by Fankuchen and Mark.21 Here it was established by reference to the earlier structure studies that planes corresponding to sheets of hydrogen- bonded chains were first being drawn around so that the ribbonlike sheets were in the direction of the uniaxial stress. Similar planar motion was observed for various stages in the orientation of cellulose and some of its derivatives, as discussed by Sisson.22 Incidentally, the study of Fankuchen
1 5 R. Jaccodine, Nature 176, 305 (1955).
1 6 E. W. Fischer, Z. Naturforsch. 12a, 753 (1957).
17 L. B. Morgan, J. Appl. Chem. 4, 160 (1954).
18 A. Keller, G. R. Lester, and L. B. Morgan, Phil. Trans. Roy. Soc. London, Ser.
A 247, 1 (1954).
19 A. Keller, Nature 169, 913 (1952) ; 171, 170 (1953).
2 0 A. Keller, Polymer Sei. 17, 351 (1955).
2 1 I. Fankuchen and H. Mark, / . Appl. Phys. 15, 364 (1944). 245 at seg.
2 2 W. A. Sisson, in "Cellulose and Its Derivatives" (E. Ott, ed.), p. 245 et seq.
Inter-science, New York, 1943.
378 I. L. HOPKINS AND W. O. BAKER
and Mark also revealed large differences in the crystallinity of their mono- filament, reflecting variations in the quenching, water annealing and the heating during drawing to which it was exposed. The present interpretation of crystalline rearrangements in the rheology of drawing emphasizes that all these features are important in understanding the force-extension behavior of such systems.
The most striking and intensive probe of the deformations during cold drawing has been done for polyethylene. Here it was found that first stages of the drawing just beyond the yield region caused an extraordinary splitting of X-ray diffraction rings.7 The structure these rings represent was pretty well known by the early study of Bunn.23 The inner strong ring corresponding to (110) planes, and the outer weaker ones to (200) planes, split so that the (200) was readily pulled down to equatorial spots but the (110) arcs split further above and below the equator of the diagram.7 This indicates that the (011) axis is tilted at a very large angle to the direc- tion of the stress, and yet this is the axis containing the carbon chains of polyethylene. Hence the very element of structure most capable of support- ing the applied stress is, by crystallographic responses to the stress, thrown into a position where it is not pulled on. Weaker, van der Waals', inter- actions in the solid bear most of the external force. This has turned out to be a predominant feature of microcrystalline polymer mechanics. Recently, detailed studies by Brown,14 and Horsley and Nancarrow24 have emphasized the quasimetallic features7 of polyethylene plastic flow. They have shown that selective planar glide is achieved on relaxing fully stretched fibers from their condition of having the chain axes all parallel to the direction of principal stress. Again, the crystallites, disorienting as in the polyamide cases noted, do not go through randon rearrangements, but slip back so that at an intermediate state the long axes are again largely tilted with respect to the principal force axis. However, for polyethylene, this was not found on stretching above 95° C , where crystalline anisotropy and probably crystal content are drastically reduced. This is strong support for the earlier thesis that the mechanics of cold drawing of these microcrystalline systems are dominated by crystal planes rather than by the melting of crystallites which reform only in the oriented condition. Thus, in general, a chain polymer whose crystallites respond in an uneven way to plastic flow will have the (1/cO) lattice points off the equator of an X-ray diagram instead of lying on it, as simple extension of the chain axis in the direction of flow would produce. (110) reflections will not in general be thus split, however.
2 3 C. W. Bunn, Trans. Faraday Soc. 35, 482 (1939).
2 4 R. A. Horsley and H. A. Nancarrow, Brit. J. Appl. Phys. 2, 345 (1951) ; S. Krimm, Phys. Chem. 57, 22 (1953).
For polyethylene, (110) and (100) seem, however, to be planes along which slip could most readily occur during flow, and where indeed it does seem to take place in the latter stages of extension when the chain axes are finally in the direction of the force. Correspondingly, on relaxing, movement back appears to occur along these very planes. Then, chain axes come back again to an intermediate position nearly normal to the direction of the original stress. However, the intermediate configurations observed for the original pulling before relaxing seem to be caused by some- thing like crystallite shape or other details such as the nature of the fringes between crystalline and amorphous volumes. Also critical for this extraor- dinary stretching behavior may be the suggestion of Bunn and Alcock,12 that molecular orientation will be stepwise and involve some chains at large angles to the stretching direction, because in this way a few potential barriers at a time can be surmounted. In the case of relaxing, the retractive force is provided by the rekinking of rubbery amorphous segments.9
Then, since this process often occurs near the melting point of the crystal- lites, an additional factor may be orientation in which the axis with the lowest coefficient of thermal expansion and hence the least sensitivity to the effect of external force on melting point, bears the main stress/4 This would at least put the a axis, with its large coefficient, away from the stress direction on stretching at high temperatures. On relaxing, the reverse would happen, with this axis parallel to the direction of stretch.
4. FURTHER CONSEQUENCES OF CRYSTALLINE DISPLACEMENTS
These various interpretations, and many new and ingenious studies, have been critically analyzed by Keller.25 Many new aspects are now being revealed of mechanical properties of the microcrystalline polymers which may clothe (cellulose, polyamides, polyesters, polyvinylidenes, polyacryls, poly olefins, etc.), help to shelter (cellulose, polyolefins, etc.) and other- wise comfort (plastic piping for plumbing, plastic wiring for communica- tions and power) mankind. No longer are the classical intuitions valid that high average molecular weight alone, for instance, sets a high yield strength for a fiber-forming system. For small enough filaments, the crystallite ar- rangement and statistics of stress distribution would be expected to be- come significant.
Such an effect, doubtless well-known to all synthetic fiber technologists, was observed in our Laboratories by Mr. R. L. Taylor, some years ago, for many linear polyesters. For instance, polyethylene sebacate of varying weight average molecular weight indicated by the intrinsic viscosity in chloroform solution, at 25° C , shown in Fig. 8, showed marked differences
2 5 A. Keller, J. Polymer Sei. 15, 31 (1955) ; see also references therein.
380 I . L . H O P K I N S A N D W . 0 . B A K E R
380
1 1 1 1 1 1 1 1 Γ^Γ~
CM.
ο 3 40 : -A—-
S y^/i
5xl0i4 00.85 0.90 0.95 1.00 1.05 1.10 1.15 1.20 1.25 1.30 l I—I
1
1 1—ί-»—1 1 1 u 1INTRINSIC VISCOSITY, D E C I L I T E R S P E R GRAM
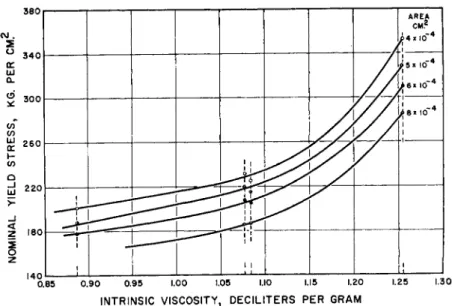
FIG. 8. Relation of nominal yield stress of filaments of polyethylene sebacate to viscosity average molecular weight at different levels of original cross section.
associated with a twofold variation in original cross section. While the yield stress rose regularly with increasing intrinsic viscosity the larger area filaments yielded at consistently lower values than the smaller. Presumably the probability of crystallite and spherulite arrangements favoring easiest planar displacements was greater in the larger diameter specimens.
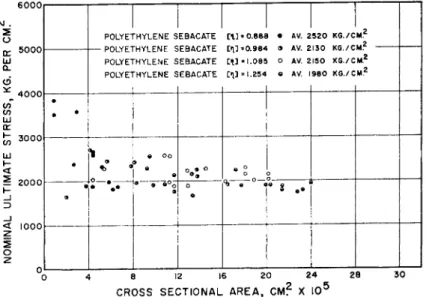
For tensile strength, or nominal stress at rupture (Fig. 9), the same filaments show little dependence on final cross-sectional area, since now they are all highly drawn with crystallites and chain axes "fully" extended.
Even the molecular weight range covered has only the effect of allowing the shorter chain length but more ductile polymer further reduction in area before rupture at the characteristic value. Of course, the lowest molec- ular weight samples drew so highly that their rupture is at high nominal stress values.
However, when various very fine filament sizes of a high molecular weight polyethylene sebacate were tested to rupture, similar strikingly large effects were found, as in Fig. 10. The areas are again down a factor of 10 from those of Fig. 9, and perhaps further reflect the more perfect orientation of large draw ratios (easily six- or sevenfold).
In all cases, the powerful influence of crystallites and cooperative chain orientation on flow and plasticity shows up. Each effect concerns some super-chain displacements, always contained in a disordered matrix.
Indeed, under powerful stress, even the noncrystalline chains orient
OD . 5
Ο CC UJ CL
0 in co LÜ Ct h-
CO Ixl
_ l
_J
< 1000
Ζ Ο Ζ
ο
POLYETHYLENE SEBACATE CIL » 0.888 - POLYETHYLENE SEBACATE CL] »0.984 POLYETHYLENE SEBACATE C«LD«i.085 POLYETHYLENE SEBACATE Z\l = 1.254
• AV. 2520 KG./CM.
β AV. 2130 KG./CM.2 Ο AV. 2150 KG./CM.' Ο AV. 1980 KG./CM.2
_ o _#
28 CROSS S E C T I O N A L A R E A , C M ? Χ Ι Ο5
FIG. 9 . Breaking strength of polyethylene sebaeate polyester fibers of various viscosity average molecular weights as a function of cross sectional area.
18,000
Ο 6,000 Ζ
4,000
CROSS S E C T I O N A L A R E A , C M .2 Χ I06
FIG. 10. Breaking strength of polyethylene sebaeate polyester fibers of very small cross section as influenced by cross sectional area of fiber.
382 I. L. HOPKINS AND W. O. BAKER
strongly.26"28 Thus, the very transmission of stress to the crystallite regions itself varies.
These subtle structure changes seem to have drastic effects on the mechanics of polymers. This arises because crystallite rotation and planar orientation go through such large angles during a simple uniaxial stretch.
Then, it might be expected, during multiaxial stressing with a two-way pull, that occasionally a large stress would meet an arrangement of polymer chains where they could be readily pulled apart sideways, i.e. in directions normal to their long axes. Now the basic element of the physical properties of chain polymers and presumably the source of their amazing utility is that the long chain axes contribute great strength. This is either by sus- taining a stress directly or entangling with many others, so that the stress is spread around among primary valence bonds. However, the very element of microcrystallinity is that chain segments are not entangled, but rather neatly laid out laterally and lengthwise. Hence if forces are brought in to meet these chains chiefly normal to their long axes in the crystallites, the structure may show fatal weakness. Examples of this will be discussed in detail in later sections on stress cracking and brittleness of polyethylene and other plastics.
The import of the present discussion, however, is that the purely crystal- line rearrangements in the deformation of linear polymers are inadequate to account for all of their properties. Indeed, the rather surprising inter- crystallite (and sometimes intra-) changes sustained by deformed polymers emphasize the importance of the disordered phases. Obviously rheology of these systems involves more intimate and delicate interaction of crystal and liquid mechanics than has been encountered before. While the crystal- lites are probably also defect structures, and the liquids may have quasi- crystalline packing, certain characteristic properties of each state persist in the presence of the other. Indeed, where such coexistence is practically lost, as in some special stereoisomeric polymers recently synthesized, the domination of microcrystalline properties seems disastrous. Brittle environ- mental and impact sensitive qualities appear even in certain poly ethylenes.
Accordingly, the discussion should turn now to examination of the liquidlike or viscoelastic properties of microcrystalline and cross-linked polymers. Here, the orderly deformation and movement of relatively large arrangements of molecular segments is not expected. Rather, the rapid diffusionlike thermal agitation of single chain segments is thought to be biased by external stresses. The following paragraphs will attempt
2 6 I. L. Hopkins, W. O. Baker, and J. B. Howard, / . Appl. Phys. 21, 206 (1950).
27 D. R. Holmes, R. G. Miller, R. P. Palmer, and C. W. Bunn, Nature 171, 1104 (1953).
28 W. P. Slichter, Polymer Set. 21, 141 (1956).
to describe the position of these kinetic effects, which are in contrast to the foregoing static structures, in understanding crystalline and cross-linked polymers.
5. SHORT-RANGE DISPLACEMENTS IN POLYMERS
Linear polymers in which long-range molecular movements are either prevented or strongly inhibited by cross-linking, entanglement, partial involvement in crystallites, or other bonding arrangements as in glass, have certain viscoelastic properties in common. In stress relaxation, they are often characterized by a nearly linear relation between stress and the logarithm of time over several units of the latter. The early part of a creep curve represented by deflection against the logarithm of the time may often similarly appear nearly linear. In dynamic tests, in which the mechani- cal impedance is represented by a spring and dashpot in parallel (Kelvin- Voigt element) the stiffness of the spring (the dynamic modulus) may change only very slowly with frequency over a considerable frequency range, as will the product of the frequency and the viscous resistance of the dashpot. Since the mechanical loss factor tan δ is the quotient of these two slowly changing quantities, it will be fairly constant over some decades of frequency change. Specific cases of these phenomena will be adduced in the pages to follow. The discussion throughout will be in terms of the theory of linear viscoelasticity and deviations from it.29
Complete characterization of a material within the range of strains and stresses for which the behavior is linear (within which the superposition principle is valid) requires that measurements be made in some manner over the entire time scale represented by the characteristic relaxation times of the material. For long times stress relaxation or creep measure- ments are ordinarily used, while for short times measurements at audio
2 9 The background of the theory of linear viscoelasticity is available in several books. An excellent summary of the theory up to 1943 may be found in H. Leader- man, ''Creep of Filamentous Materials and other High Polymers" (The Textile Foundation, Washington, D . C , 1943). A most inclusive discussion of the theory, deviations from it, its application to materials, and approximate methods is provided by Turner Alfrey, Jr., 4'Mechanical Behavior of High Polymers" (Interscience, New York, 1948). A most complete presentation of the linear theory is given in B. Gross,
"Mathematical Structure of the Theories of Viscoelasticity" (Hermann, Paris, 1953). The form of distribution function described here has been treated by W. Kuhn, Ο. Kunzle, and A. Preissmann [Helv. Chem. Acta. 30, 307, 464 (1947)]. Α. V. Tobolsky, B. A. Dunell, and R. D. Andrews [Textile Research J. 21, 404 (1951)] have also dis- cussed this function in detail.
Recent summaries of certain aspects of this field are given by Turner Alfrey, Jr.
and E. F. Gurnee, "Rheology: Theory and Applications," Vol. I, Chapter 11, Aca- demic Press, New York, 1956; H. Leaderman, ibid., Vol. II, Chapter 1, 1957; Arthur Tobolsky, ibid., Vol. II, Chapter 2; and John D. Ferry, ibid., Vol. II, Chapter 11.
384 I. L. HOPKINS AND W. O. BAKER
and supersonic frequencies are required. But generally at ordinary tempera- tures, the time required for complete relaxation on the one hand, and the extreme frequency of mechanical vibration on the other, are not available, with the result that only by the artifice of introducing temperature as a parameter may a complete analysis be made. The effect of raising the temperature is to reduce the relaxation times to such a range that the long times become short enough for practicable relaxation tests; or lowering the temperature so lengthens them that the shortest of them correspond to an attainable vibration period. This procedure is valid for materials in which a change of temperature is not associated with a change of structure, such as melting of crystallites or dispersion of spherulites. This kind of charac- terization is complete for but few materials, although many of them show, over part of the time range, some of the characteristics mentioned above.
It has been shown29 that these modes of behavior may be accounted for by the assumption of a distribution of relaxation times
The characteristics of such a distribution have been discussed at length29 and are well known. We shall not repeat the mathematics, but merely state the salient features of the behavior of such a hypothetical material.
It is assumed that r2 is at least several orders of magnitude greater than ri.
a. Stress Relaxation
Stress is extremely nearly although not precisely linear with log time within most of the region between t = η and t = r2. The linear portion of the curve (Fig. 11), if extended, intersects the maximum and the zero stress lines at log t — (log η — 0.251) and (log r2 — 0.251), respectively.
If Er(t), the relaxation modulus, is defined as (stress at time t)/strain, then dEr(t)/dt = —2.303 Κ is the slope of the linear part of the curve.
b. Creep
If we define a relaxation function as E(T) = K/r,
E(r) = 0, τ < ri, r > T2 Tl < 7 < T2
ψ(ί) — (stress at time t)/ (stress at time 0) and a creep function as
<p(t) = (deflection at time ^/(deflection at time 0), then these two functions are related by the integral equation30
(1)
3 0 I. L. Hopkins and R. W. Hamming, / . Appl. Phys. 28, 906 (1957).
η I 1 I I I I I - C ^ I
-10 - β - 6 - 4 - 2 0 2 4 6 LOG T I M E
FIG. 11. Relaxation and creep functions for "box" distribution of relaxation times, η = 10"5 and r2 = 105.
It is characteristic of this equation that the only functions ψ(ί) and <p(t) of the forms φ(ί) = 1 — f(t) and φ{ί) = 1 + cf(t) which will satisfy it are those with f(t) = 0 ; that is, if there were no creep or relaxation at all.
If the constant c = 1, then ψ(ί) + φ{£) = 2 , which is approximately true when ψ(ή and φ(ί) are near 1, but the deviation is quite appreciable when ψ(ί) = 0.9 or φ{ΐ) = 1.1. In fact, it appears from a few calculated cases that if either ψ(ί) or <p(t) is linear in log t, the approximate identity <p(t) =
\/yp(t) is a satisfactory representation for a considerably greater range.
c. Dynamic Modulus
The dynamic modulus is extremely nearly linear with log ω within most of the region between ω! = 1 / τ2 and ω2 = 1 / n . The linear portion of the curve, if extended, intersects the zero and the maximum modulus lines at log ω = —log T2 and —log η , respectively. The slope is positive and is numerically equal to that of the relaxation curve, 2.303 K.
d. Dynamic Viscosity-Frequency Product
If Τ2/ΤΙ > 1 06, it may be shown that within the limits ΩΙ ~ 6 4 / R2 and Ω2 ~ 1/64ΤΙ , the viscosity-frequency product ωη does not vary more than 1 % from its maximum value, which occurs at ω = χ/ΐ/τιτ2 · The viscosity itself therefore varies very nearly with l / ω in this range. While a tentative value of Κ and limits η and r2 may easily be found for any material which
386 I. L. HOPKINS AND W. O. BAKER
10 I 1 1 1 1 1 1 1 1 1
UJ Ϊ5β
I-
FI I ^
r υ 4 1 1 / v£<?
/
(DO / SO
3 ^ / . / &
α 2 1 1 1 / y \/
< LOG CREEP ASYMPTOTE ^ /
0-8 -6 -4 -2 0 2 4 6 θ 10 12 LOG TIME
FIG. 12. Log relaxation and creep functions and creep asymptote for "box" dis- tribution of relaxation times, π = 10~5 and τ2 = 105.
displays any of the behavior mentioned, such a description is usually only partial. For example, a stress relaxation experiment may be compatible with such a characterization, but this test does not even "see" the shorter relaxation times, their effect having vanished even while the initial strain was being applied. On the other hand, dynamic data are usually taken with relatively short periods and characterize a part of the relaxation spectrum which may have quite a different form. It is not surprising, therefore, that complete characterizations are not available for many of these materials.
It is in fact not known whether or not certain of them would ever relax completely. Nevertheless, the fact that all the properties mentioned above are so often approximated in reality gives this method of analysis and simplification a certain qualitative value.
For purposes of illustration, Figs. 11 to 14 show the curves derived from a hypothetical material characterized by the relaxation distribution
E(T) = 0.4342/r, η < τ < r2
= 0 elsewhere
where η = 10" \ r2 = 10". In Fig. 11 are shown the relaxation and creep functions \f/(t) and <p(t), the latter having been calculated by numerical solution of the integral equation ( l ) .3 0 The asymptote approached by the creep function for times greater than r2 is 11.502 + 2.303 X 10~4/; this together with the relaxation and creep functions are plotted on a log-log scale in Fig. 12. The dynamic functions are plotted against log ω in Fig.
13, and on log-log coordinates in Fig. 14.
"T™* / / ι I I
1/
Q 0.6 \
P> V ι C 1
Ο 0 4 \ /
0.2
y
^ S .- 8 - 6 - 4 - 2 0 2 4 6 8
LOG Ω
FIG. 1 3 . Dynamic properties for " b o x " distribution of relaxation times, η = 1 0 -5 and r2 = 1 06.
^
- a [ I I I I I I I I - β - 6 - 4 - 2 Ο 2 4 6 8 10
LOG
CJ
FIG. 1 4 . Log dynamic properties for " b o x " distribution of relaxation times, τι = 1 0- 6 and τ2 = 1 05. Numbers at ends of curves are slopes as ω —» 0 and ω —> « 3 .
388 I. L. HOPKINS AND W. O. BAKER II. Polyethylene
1. DYNAMIC PROPERTIES OF POLYETHYLENE
The literature on dynamic testing of polyethylene may be separated into two major groups; tests in which temperature is the main variable, with frequency either being held constant or changing as the change of
modulus with temperature causes the resonant frequency of the test system to vary, and tests in which the temperature is held constant while the frequency is varied. The discussion will be in that order; and to bring the data to a common basis, Young's modulus is converted approximately to shear by dividing by 3, a procedure which will be justified later.
In the earlier papers, the identified materials were all standard low- density polyethylenes, and while there were differences between them, the picture that emerges is consistent. The later papers will be discussed separately. The data presented in the literature are in various forms;
wherever possible, tabulated data or plots were recalculated to give the shear modulus and mechanical loss factors, tan δ. While the accuracy of this calculation is not always high, it serves the present purpose.
Nielsen and Buchdahl,31 Schmieder and Wolf,32 Oakes and Robinson,33 and Sauer and Kline34 have used free vibration methods, and Thurn35 and Wada and Yamamoto36 have used forced oscillations over various tempera- ture ranges. Figures 1 5 and 1 6 show the shear moduli and loss factors, respectively. Figure 15 shows consistency among the data, with reasonable agreement where the test frequencies are nearly the same, and also demon- strates qualitatively the "reduced variable"37 effect in the maintenance of a high modulus at high frequencies even at the highest temperatures.
Fig. 16, in which the mechanical loss factor is plotted against log time, shows the same consistency, except that the data of Thurn at 2 Mc. and the corroborating data of Wada and Yamamoto at 1.46 Mc. show not only a displacement to the right on the log time scale (appropriate to the reduced variable scheme) but also a different form. Schmieder and Wolf attribute the loss peak at circa — 1 0 0 ° C. to amorphous unbranched chain parts, that at 5 ° C. to the ' 'constrained" amorphous at the branch points of the main chain, and that at + 5 4 ° C. to the crystalline. Oakes and Robinson believe the low temperature peak to be possibly associated with flexibility in a limited number of main chain-CH2 links. The — 3 0 ° to
31 L. E. Nielsen and R. Buchdahl, SPE Journal 9, 16 (1953).
32 K. Schmieder and K. Wolf, Kolloid-Z. 134, 149 (1953).
33 W. G. Oakes and D . W. Robinson, J. Polymer Sei. 14, 505 (1954).
34 J. A. Sauer and D . E. Kline, J. Polymer Sei. 18, 491 (1955).
3' H. Thurn, Z. angew. Phys. 7, 44 (1955).
36 Y. Wada and K. Yamamoto, / . Phys. Soc. Japan 11, 887 (1956).
37 Α. V. Tobolsky and R. D. Andrews, J. Chem. Phys. 13, 3 (1945).
(VJ 10.0 2 Ο
II
£6)10 5 KC (36)1.4 6 MC
£6)10 5 KC (36)1.4 6 MC (35); 2 MC
34) 1 Κ C
Y T F 3 ) ~ ! < IPS (32 ) ~ 1 0 C P S \
2 0 0 2 5 0 300 3 5 0 4 0 0 T E M P E R A T U R E IN DEGREES KELVIN
FIG. 15. Dynamic shear modulus as function of temperature for polyethylene with test frequency as parameter. The numbers in parentheses are literature refer- ences.
T E M P E R A T U R E IN DEGREES CENTIGRADE - 5 0 0 - 5 0 100
0.20
Ζ
£ 0 . 1 5
I 1 I I
r ft Γ 3)~1C 0 CPS
HI
» \\
III ν Ί
\
/ {34)1 KC \\
/s lj
/
f b o -\\ , - 1 CPSV /Τ36)1 00 KC /s V <
^ { 3 2 ~ 10 ZPS
V
—^
(36)1.46 MC/S-^"
/ N
/ / 1
ν \
\
(35) 2MC/S 200 2 5 0 300 350 4 0 0
T E M P E R A T U R E IN DEGREES KELVIN
FIG. 1 6 . Dynamic loss factor as function of temperature for polyethylene, with frequency as a parameter. The numbers in parentheses are literature references.
T E M P E R A T U R E IN D E G R E E S CENTIGRADE
390 I. L. HOPKINS AND W. O. BAKER
+ 5 0 ° C. range contains signs of multiple loss peak structure, which they believe to be frequency dependent and influenced by molecular weight;
the dispersion region from —60 to + 4 0 is absent from loss curves for straight unbranched poly ethylenes, as will be discussed later. The high peak at 60-80° C. is attributed by Oakes and Robinson to relatively large scale mobility of the polymer chains, enhanced by the onset of melting in the crystalline regions. The high modulus throughout the temperature range in Thurn's data suggests that at his test frequency, 2 M c , bond- angle bending is the predominant mode of compliance, with only slightly longer range effects coming into play at the higher temperatures. The constancy of the loss factor from —70° to + 7 0 ° C. (within ± 2 5 %) suggests that no new major compliance mechanism has come into play. In other words no movements large enough to distinguish between branch points, crystallites, and amorphous material, have developed in that range.
Dynamic tests over a range of frequencies, with temperature constant, have been made by forced vibration methods by Hillier,3 8 , 39 Lethersich,40
McSkimin,41 Dunell and Dillon,42 Mason and McSkimin,43 and Philippoff.44
The values of shear modulus and the loss factor tan δ are plotted against log frequency in Fig. 17. Here again the picture is consistent; and this plot, covering a range of 1012 c.p.s., shows that polyethylene requires a tremen- dous range of logarithmic time or frequency to describe its properties. The maximum value of shear modulus in Fig. 15 is in excess of 2 Χ 1010 dynes/
c m / at 25° C , while the maximum in Fig. 17 is somewhat less than 10 . The minimum value is about 108, obtained by Philippoff at 75° C. at about 10~5 c.p.s. As will be discussed later, the minimum in stress relaxation obtained by Catsiff et ai.45 is about 2 X 10⁷, obtained after 1 hr. at 105° C.
The range of 1012 in frequency in Fig. 17 therefore does not encompass the total realizable range of moduli for polyethylene. Philippoff,44 utilizing the principle of reduced variables, has synthesized a plot in which a frequency range of 1024 is required to include the measurements he has made on the dynamic properties, and even this is not really enough, since in his diagram of modulus versus frequency the curve has not leveled off at either end.
Further, the technique of reduced variables itself, in this case, tends to minimize the length of the spectrum of relaxation times. That this is so can be shown by the following considerations.
38 K. W. Hillier, Proc. Roy. Soc. B62, 701 (1949).
3 9 K. W. Hillier, Proc. Roy. Soc. B64, 998 (1951).
4 0 W. Lethersich, J. Set. Instr. 27, 303 (1950).
41 H. J. McSkimin, Acoust. Soc. Am. 23, 429 (1951).
42 B. A. Dunell and J. H. Dillon, Textile Research J. 21, 393 (1951).
4 3 W. P. Mason and H. J. McSkimin, Bell System Tech. J. 31, 122 (1952).
4 4 W. Philippoff, Appl. Phys. 25, 1102 (1954).
4 5 E. Catsiff, J. Offenbach, and Α. V. Tobolsky, J. Colloid Sei. 11, 48 (1956).
FIG. 17. Dynamic modulus and loss factor for polyethylene as function of fre- quency with temperature as a parameter. The numbers in parentheses are literature references.
The concept of reduced variables is predicated on the idea that the effect of a change of temperature is to change all relaxation times by the same factor;46 and this implies that there shall be no structural change associated with the temperature change. However, there is a change in the crystalline content of polyethylene associated with a temperature change from 25° C.
to 73° C .7'4 7 In the dynamic tests at 73° C , the minimum shear modulus will be obtained at the lowest frequency of test, and, by the continued joining of curves from 25° C. (the usual base temperature), the modulus obtained will be ascribed to some lower frequency at 25° C. But the modulus is lower than it would have been had the degree of crystallinity not de- creased at the higher temperature; this low modulus in a material at 25° C.
would actually have been obtained only at a still lower frequency than that deduced by this method. Thus the low end of the frequency scale has been telescoped, and Philippoff's estimate of 1024 is an underestimate.
Considering that this accounts only for the decrease of the Young's modulus from something under the ultrahigh-frequency high to something over
108 dynes/cm.2, or 3 Χ 107 in shear—a figure corresponding to the stiffness of a fairly stiff soft rubber for a period of seconds or minutes—the long-time,
46 R. S. Marvin, E. R. Fitzgerald, and J. D. Ferry, Appl. Phys. 21, 197 (1950).
47 R. B. Richards, Trans. Faraday Soc. 41, 127 (1945).
I. L. HOPKINS AND W. O. BAKER
or low frequency, end of the relaxation spectrum is undefined, and may be indefinitely long with the crystallites acting as permanent cross links.
The gentle positive slope of the log modulus-log frequency curve, and the moderate change in the mechanical loss factor over the 12 decades covered in Fig. 17 seem characteristic of materials in which long-range movements are prevented either by cross-linking, crystallinity, or other bonding arrangements, as in glass, which prevent unlimited relative move- ment of chains. Ebonite behaves similarly over the range from 0.0001 to 10,000 c.p.s.,4 0 , 48 and fused quartz at 15° C. has a shear modulus of 3.00 X 10¹¹ dynes/cm.2 in a static test according to Horton,49 and 3.12 Χ 1011 at 12 Mc./sec. according to McSkimin.50
McSkimin and Mason, and McSkimin have measured both the shear and longitudinal wave propagation constants for polyethylene in the mega- cycle region, and have calculated the Lamé constants λ and μ as well as their associated viscosities χ and η respectively. They found that at 25° C , λ has a value of about 3.0 Χ 1010 dynes/cm.2, and is nearly independent of frequency over the 8- to 30-Mc. range, χ is found to be nearly equal to 77/3, whence the shear and bulk viscosities are about equal.5 3a
Parks and Richards,51 Weir,5 2 and Bridgman53 have measured the "static"
compressibility of polyethylene. Recalculation of their results to a common basis gives the following bulk moduli at low pressures, in 1010 dynes/cm.2: Parks and Richards, 1.8; Weir, 3.9; Bridgman, 3.5.
Weir remarks on the discrepancy between his results and those of Parks and Richards, and on his agreement with Bridgman.
From the formulas in footnote 53a.
Β = λ + 2μ/3
Since for these "static" tests μ, the shear modulus, is only about 4 Χ 108, Β is very nearly equal to λ. Then, using the mean of the results of Weir
4 8 R. L. Wegel and W. Walther, Physics 6, 141 (1935).
4 9 F. Horton, Phil. Trans. Roy. Soc. London, Ser. A 204, 407 (1905).
5 0 H. J. McSkimin, J. Appl. Phys. 24, 988 (1953).
61 W. Parks and R. B. Richards, Trans. Faraday Soc. 45, 203 (1949).
6 2 C. E. Weir, J. Research Natl. Bur. Standards 46, 207 (1955).
6 3 P. W. Bridgman, Proc. Am. Acad. Arts Sei. 76, 71 (1948).
6 3a The relation between the elastic constants is Β = Vs(S\ + 2μ)
where Β is the bulk modulus. If η Β is the bulk viscosity, then VB - H ( 3X + 2η)
Substituting 3χ = η,
VB = η
μ Ε/μ
107 3.000
10* 2.997
109 2.967
1010 2.75
The assumption of a ratio of 3 for Ε/μ is then justified, with an error of 1 % at μ = 109, and 8 % at 101 0.
The only study of dynamic compressibility of polyethylene is that of Philippoff and Brodnyan,54 who worked in the range of 0.0003 to 5 cycles per second, and from —24° to + 9 5 ° C. Their tentative conclusion is that the bulk modulus has no imaginary component.
Taylor55 measured the stress-strain behavior of polyethylene in a single compression pulse of about 17 msec, by means of a Hopkinson bar. He found that the effects observed in his experiments could be accounted for by the assumption of a single Maxwell element with a modulus of 2 Χ 109 dynes/cm.2 and a relaxation time of 1.7 msec.
Kolsky56 has performed similar measurements with pulse durations of about 20 μββο. At the maximum rate of stress and strain (in the thinnest specimen) the Young's modulus was about 1010 dynes/cm.2 at 21° C.
The 20^sec. half-wave corresponds to a frequency of 25 k c ; from Fig. 17 the shear modulus at this frequency as ascertained from steady-state dynamic tests is about 2 Χ 109 dynes/cm.2, corresponding to a Young's modulus of 6 Χ 109 dynes/cm.2. More recently, Kolsky57 found that if the response of the material to sinusoidal stresses over a wide frequency range is known, the pulse shapes can be predicted accurately by means of a numerical Fourier synthesis; and that where the damping loss is not too
5 4 W. Philippoff and J. Brodnyan, / . Appl. Phys. 26, 846 (1955).
6 6 G . I. Taylor, J. Inst. Civil Engrs. (London) 8, 486 (1945-1946).
5 6 H. Kolsky, Proc. Phys. Soc. (London) B62, 676 (1949).
6 7 H. Kolsky, Phil. Mag. [8] 1, 693 (1956).
and Bridgman, λ = 3.7 Χ 1010 dynes/cm.2. This is nearly the same as the 3.0 Χ 1010 obtained by Mason and McSkimin43 in the 8- to 30-Mc. range, and seems to confirm their observation of the constancy of λ, although information at intermediate frequencies would certainly be required before the generalization could be fully accepted.
We are now in a position to assess the error in the original assumption that Ε = 36?. From classical elastic theory,
Ε/μ = (3λ + 2μ)/(λ + μ) = 3 - μ/(λ + μ)
If λ = 3 Χ 101 0, the Ε/μ ratio corresponding to various values of μ be- comes
394 I. L. HOPKINS AND W. O. BAKER
large and is "constant" over a wide frequency range, as it is for many polymers, a general solution of the problem can be obtained which gives the pulse shape for all such polymers and for all distances of travel.
Hillier and Kolsky68 measured the dynamic Young's modulus of poly- ethylene filaments at 20° C. and 3 k c , the dynamic strains being super- imposed on static strains up to 1.37 in./in. After a slight initial decrease in the dynamic modulus, it was found to be nearly linear with strain. It was 5.65 X 10⁹ at zero strain, and 1.72 X 10¹⁰ at a strain of 1.37. Experiments were also made in which the specimen was allowed to relax at a strain of 1.0; it was found that the change in dynamic modulus during this relaxa- tion was extremely small. It would seem, then, that the modulus is a function of strain (i.e., of configuration) rather than of stress—being, in this, reminiscent of birefringence.59
The foregoing references have dealt with low density (approximately 0.92 gm./cc.) polyethylenes. Nielsen60 measured the shear modulus and logarithmic decrement of six polyethylenes of different densities (0.92-0.96 gm./cc.) at frequencies of 0.2 to 1 c.p.s. and at temperatures from 25° C.
to the melting point. He found that for all the materials, and over the temperature range studied, the logarithm of the shear modulus is linearly related to the specific volume. The loss peak at approximately 60° C , shown in Fig. 16, is found to shift along the temperature scale, from a minimum of 50° C. for density 0.92 to 70° C. for density 0.95, and a plateau rather than a peak is found for density 0.96. The variation in the height of the maximum is not great, the limits of the logarithmic decrement being 0.8 to 1.0, corresponding to tan δ values from about 0.25 to 0.32.
Kline and co-workers61 have performed similar experiments at frequencies from about 100 to 2000 c.p.s., and at temperatures from 80° to 380° K.
( — 193° to 107° C ) . The three polyethylenes are characterized in Table I.
They confirm the finding of Oakes and Robinson33 that for the unbranched material the dispersion region from —50° to 60° C. is almost entirely suppressed. The three absorption peaks described by Kline et al. are given in Table II. They attribute the a peak to movements of large sections of the main chains themselves, which become possible as the crystallites begin to melt. The peak tends to shift to higher temperatures as the branch- ing is decreased, corresponding to the higher and sharper melting points of the more highly crystalline materials.60 The β peak may arise from the onset of diffusional motion of amorphous chain segments containing branch points which cooperate with main and side chain groups in this movement.
6 8 K. W. Hillier and H. Kolsky, Proc. Royal Soc. B62, 111 (1949).
5 9 R. S. Stein, S. Krimm, and Α. V. Tobolsky, Textile Research J. 19, 8 (1949).
6 0 L. E. Nielsen, J. Appl. Phys. 25, 1209 (1954).
61 D. E. Kline, J. A. Sauer, and A. E. Woodward, Polymer Sei. 22, 455 (1956).