Ecological footprint calculation of the Budapest Metropolitan Region in a multi-method perspective
Gabor Harangozo1, Zoltan Kovacs2, Cecilia Szigeti3, Attila Csaba Kondor4
1Corvinus University of Budapest, e-mail address: gabor.harangozo@uni-corvinus.hu
2Hungarian Academy of Sciences, e-mail address: zkovacs@iif.hu
3Szechenyi Istvan University, e-mail address: szigetic@sze.hu
4Hungarian Academy of Sciences, e-mail address: kondor.attila@csfk.mta.hu
Abstract
The main aim of this paper is to analyse the environmental impacts of the transformation of the Budapest Metropolitan Region through the ecological footprint indicator, between 2003 and 2013. Similarly to other major urban agglomerations in East Central Europe, the socio-spatial structure of the Budapest Metropolitan Region has gone through substantial changes since the change of regime, when the movement of younger and more affluent strata from the core city to the suburban zone commenced. According to our hypothesis the quickly growing population of the suburbs, with higher level of consumption has resulted in the reshuffle of the ecological footprint of the urban region.
In this study, two methods are used to estimate the ecological footprint of the Budapest Metropolitan Region. The first is a top-down, compound method using regional GDP data as the basis of the calculation. The second is a component-based approach, combining an environmentally extended input-output model with local household consumption data. The second approach also enables us to cover the embedded (in the total life-cycle of goods and services consumed by households) ecological footprint of household consumption.
Although the indirect, embedded household footprint decreased by 11% in Hungary between 2003 and 2013, it increased by 6% in Budapest and by 8% in the suburban zone. In the suburban area the growing ecological footprint is mainly the outcome of population growth, in Budapest the major driver of growth is the increasing consumption. The direct household ecological footprint accounted more than double in the suburban zone compared to the respective value in Budapest for 2013. This is mainly due to the higher (and growing, because of the spreading of wood combustion) heating footprint, whereas, there was no significant difference regarding the carbon footprint of the fuels used for vehicles.
This research was funded by NKFI fund K119710.
Keywords: suburbanization, ecological footprint, sustainable development, environmentally extended input-output analysis, Budapest Metropolitan Region.
1. Introduction
As suburbanization and urban sprawl continuously transform the spatial pattern of urban regions, the social and ecological impacts of these processes are increasingly on the agenda. Cities during stat-socialism were characterized by a clear urban edge framed by the last towers of the vast mass-housing complexes built during the 1970s and 1980s, and there were no signs that resembled residential or commercial sprawl (Hirt, 2013). The upswing of suburban areas was also prevented by poorly- organized public services, low levels of car ownership and limited infrastructural networks. After 1990, in line with the advent of a free market system and privatization of land suburbanization started to intensify. The process of suburbanization, i.e. the decentralization of people and urban functions (housing, jobs) is among the most studied phenomena of post-socialist urban transition (Hirt, 2007; Kok and Kovács, 1999; Kovács and Tosics, 2014; Slaev et al., 2018). Most of the previous studies focused primarily on the socio-economic contexts of suburbanization, the newly evolving patterns of social segregation and economy around cities, however, the impacts of suburbanization on the sustainability of urbanization and the environmental consequences of urban sprawl have been insufficiently explored to date.
Cities cannot survive without their wider hinterlands for resources and emissions sequestration (Kissinger and Haim, 2008).
The location of jobs, residences and other facilities within city region strongly affects the spatial pattern of mobility and consumption. However, this pattern is continuously reconfigured by suburbanization and urban sprawl, which often cause harmful ecological consequences such as the fragmentation of land use, the loss of biodiversity, or the impairment of ecological functions (Mustard et al., 2004; Dietz et al., 2007; Bohnet-Pert, 2010; Piña-Martinez, 2014). The decentralization of production and consumption destroy exactly that hinterland what cities hinge upon. Measuring the sustainability of urbanization the concept of ecological footprint provides a valuable tool (Rees, 1992). This paper presents the results of a study, which estimate the spatial and temporal changes of a supporting hinterland for post-socialist Budapest and its urban region by using the Ecological Footprint Analysis (EFA). We wanted to explore how much of an ecosystem(s) the studied population dependent on, and how it has changed due to suburbanization between 2003 and 2013, when large masses of relatively affluent people relocated from the core city to the suburbs (Kok and Kovács, 1999; Kovács and Tosics, 2014).
The rest of this paper is organized as follows. First, we review the literature on ecological footprint as a tool for measuring the environmental impacts of urbanization. We then discuss the methodology, including the collection and analysis of data. A section then follows with main findings of the research and comparison of the results derived by compound and component based methods, and the temporal and spatial change of EF in the urban region of Budapest. Finally, we outline the limitations of the study, discuss the findings and present our conclusions.
2. Ecological footprint as an environmental indicator of urbanization
Ecological footprint (EF) has become a popular indicator since its first publication in the early 1990s (Rees, 1992; Wackernagel and Rees, 1996) The purpose of the concept is to determine the size of land used by humans to meet the needs of a certain population group. EF calculations first focused on specific countries, but later on, approaches calculating the ecological footprint at the regional, individual and even organizational level have become widely used (GFN, 2012). Among the regional level EF calculations, those focusing on the environmental impacts of urbanization has become especially popular (Jones and Kammen, 2014; Moore, et al., 2013). In the most common approach (see for example Wackernagel et al., 1999), ecological footprint is composed of six different land-use components (cropland, grazing land, forest land, fishing grounds, carbon footprint/carbon uptake land and built-up land) and measured in global hectares (gha) considering also the bio-productivity of each land type.
Although data for urbanized areas are not as consistently calculated as for nation states and are therefore, less comparable, EF calculations at urban level have become widespread in North America, Western Europe and China (Wackernagel et al., 2006), In the growing body of literature studies focusing on spatio-temporal differences of ecological footprint within a given urban region are still rare.
Papers analysing the spatial differences of ecological footprint within urban areas focus primarily upon the problem of whether the compact or the sprawling urban morphology is more favourable for sustainable settlement (e.g. Kahn, 2000; Legras and Cavailhès, 2016; Ogle et al., 2017; Thomson and Newman, 2018).
Temporal changes of the ecological footprint are dealt with only rarely in the literature, even though this aspect would be also important according to some authors (Van der Bergh and Verbruggen, 1999). Papers usually deal with temporality in a model- like manner (Mostafa, 2010; Lu-Chen, 2017), in most cases sprawl or suburbanization is shown as a constant background process or endowment. Research results are based mostly on data collection at a given time (e.g. census, questionnaire surveys), the combination of space and time approaches in the analysis of urban sprawl and suburbanization is still lacking. In this paper, therefore, we focus on the spatiotemporal change of the ecological footprint in the Budapest Metropolitan Region (BMR). We seek to answer the question how the spatiotemporal transformation of the investigated urban region impacts the structure of ecological footprint within the urbanized area.
Since the seminal work of Rees (1992) that already addressed urban ecological footprint, several methodological advances have been achieved regarding the calculation of ecological footprint at the sub-national level. In the following a brief account is provided on the most important methodological approaches used in the literature.
The compound approach adjusted to the sub-national level is based on national ecological footprint data adapted to a smaller geographical area. The crudest way is to use per capita national footprint values multiplied by the size of population of a certain area (Moore et al., 2013), but usually calculation aims to better address local characteristics (see for example one of the first city-level calculation by Wackernagel, 1998 on Santiago de Chile or Ewing et al., 2010 for further methodological considerations). As this approach is based on national level data, it follows a top-down logic. On the one hand, the major benefit of this approach is the relatively easier data availability. On the other hand, however, without using local data specific to the region information loss may occur and the evaluation of local policies can also be more difficult (Aall and Norland, 2005; Wilson and Grant, 2009).
The component-based approach uses local data for the sub-national geographical unit to quantify the study population’s consumption activities focusing on some (e.g. commuting, energy use etc., see. Muñiz et al., 2013) or all components of the ecological footprint (Barrett, 2001). One direction follows a bottom-up logic, using local databases to quantify the material and energy flows required for the calculation (Simmons et al., 2000). The basis is usually a material flow analysis (Wiedmann et al., 2006), but it may be integrated to an urban metabolism framework (Curry et al., 2011) to collect and structure the data, as attempted by Moore et al. (2013) for Vancouver and Piña and Martinez (2014) for Bogota. An advantage of this approach that it enables policy makers to better understand the exact flow of materials and energy in the region analysed, providing better opportunities to influence them (Collins and Flynn, 2006). However, the availability of local data (Hengrasmee, 2013) or the resources needed to obtain them (Xu and San Martin, 2010) and the proper definition of system boundaries (for example beyond the direct carbon emissions of local commuting, shall the ecological footprint calculation also cover the indirect environmental impacts of the whole supply chain of the vehicle manufacturing; and if yes, how) make these calculations increasingly difficult.
Beyond the bottom-up sub-approach, the alternative is the combination of the top-down and bottom-up approaches. The application of an input-output model extended with environmental data (environmentally extended input-output analysis, EEIO) can be adapted to a subnational unit by integrating it with local production or consumption data (labelled as sub-national input output analysis, SNIO, by Moore et al., 2013). Input-output models (based on Leontief, 1936) aim at calculating the interrelationships between different economic sectors by quantifying the resource need from one sector per unit of output in another. EEIOs were first applied for ecological footprint calculations by Bicknell et al. (1998) and Ferng (2001). The pioneering paper by Barrett et al. (2005) using this approach in the EF calculation for Wales and Cardiff has been followed by many others like Gu et al. (2015). The advantage of the SNIO model is the relatively easy access to data (regarding the national level input-output data), whereas, data of production or consumption at the local level may be problematic.
In this paper two methods are simultaneously applied to quantify the changing ecological footprint of the Budapest Metropolitan Region. The first one follows a compound approach based on the correlation of the GDP and ecological footprint and uses the GDP data specific for the investigated area (estimated through an own model). The second method is a combined component-based approach, where a national input-output model is integrated with area specific household consumption data.
3. Methods
For the sake of analysis census data on commuting to work (2001) were considered and boundaries of the Budapest Metropolitan Region (BMR) were defined using the threshold of 15 per cent of commuters to the core city from the economically active population. In addition, territorial consolidation was applied, i.e. excluding municipalities that are exclaves outside the core territory and including those that form windows inside the territory. According to our delimitation the BMR includes the City of Budapest (525 sq. km) and 185 surrounding municipalities of various size covering 6,077 sq.
km with a maximum radius of 70 km. The delimitation of the BMR used in this research does not correspond to a metropolitan planning unit, as such does not exist. In the neoliberal Hungarian public administration system established by Act 65/1990 local municipalities enjoy great deal of autonomy regarding planning rights.
A compound method
One method for calculating the ecological footprint of the Budapest Metropolitan Region is based on an own linear regression model, originally developed to estimate historical ecological footprint values for the world (Toth and Szigeti, 2016; Szigeti et al. 2017). First it is necessary to estimate the BMR-level GDP data at basic prices (gross value added, GVA). Since GVA data are available only at county (NUTS3) level in Hungary, a model has been developed that allows a relatively accurate estimation of value added for smaller territorial units. The computing applies a top-down method of regional GDP calculation (Kahoun and Sixta, 2013), by which value added data provided by the Hungarian Central Statistical Office (HCSO) at the NUTS3 level could be split up to finer territorial resolution, based on the indirect variables that show high correlations with official county GDP-shares and available at the municipal level in the TeIR (National Spatial Planning and Regional Planning Information System, www.teir.hu) database. For a detailed mathematical presentation of the model see Koppány et al. (2018). Using an optimal weight vector, the national GVA share of each settlement and then finally the GVA data of each settlement (and thus also for the urban region in question) could be estimated.
A component-based method
The calculation of the household consumption based ecological footprint of the BMR covers two fields. First, we calculated the indirect EF of household consumption, embedded in the supply chains of the goods and services consumed. Second, we added an indirect EF part generated by household consumption (covering heating and transport related carbon emissions).
The embedded part of the household consumption related EF is based on an environmentally extended input-output analysis (EEIO). In this paper the EEIO model has been developed for a subnational area, the Budapest Metropolitan Region. The calculation was based on the model of Wiedmann et al. (2006) with further extensions and considerations
The embedded EF of the household consumption was calculated based on the following equation:
EF = EFdir * (I-A)-1 * FD
where EFdir stands for the direct intensity matrix, covering EF that are directly related to the production activities of different sectors per million units of national currency. The (I-A)-1 is the Leontief-inverse matrix derived from the national input-output model, while FD is the household level final demand vector (final demand by sectors) for the area and period covered. The EFdir vector is calculated by using the Hungarian dataset of the Global Footprint Network (GFN, 2011). The FD vector contains household consumption data gathered and sold by the Hungarian Central Statistical Office (HCSO) for 2003 and 2013 for Budapest and its agglomeration.
4. Results and Discussion
At the current point, there are only preliminary results based on the calculation that are presented at the followings.
When examining the data, there are several trends, depending on whether we examine the absolute or per capita ecological footprint values.
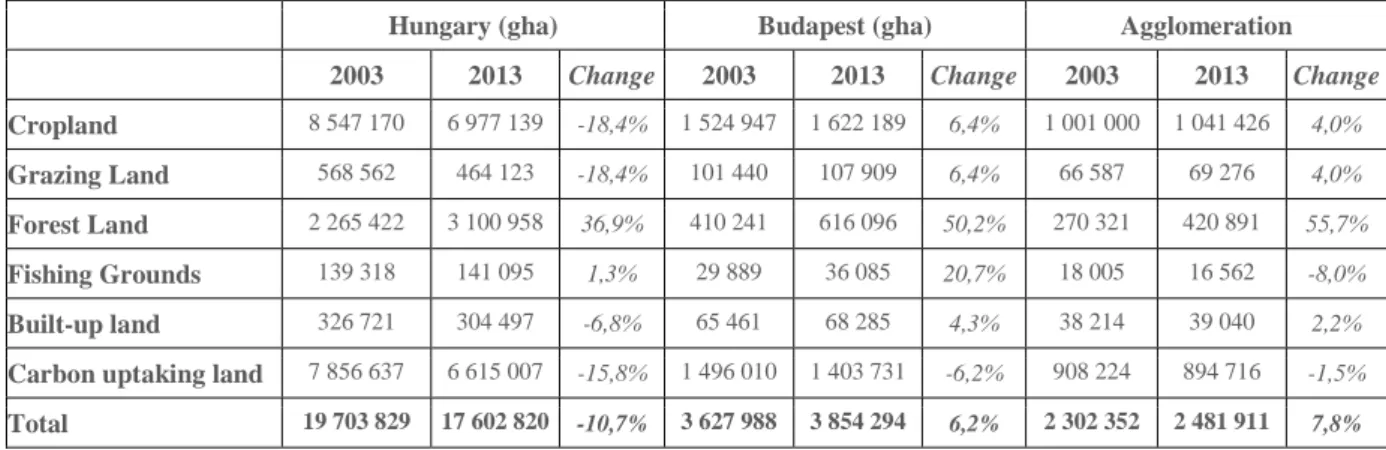
Table 1. Absolute indirect household consumption related ecological footprint by land use, in 2003 and in 2013 (gha).
Hungary (gha) Budapest (gha) Agglomeration
2003 2013 Change 2003 2013 Change 2003 2013 Change Cropland 8 547 170 6 977 139 -18,4% 1 524 947 1 622 189 6,4% 1 001 000 1 041 426 4,0%
Grazing Land 568 562 464 123 -18,4% 101 440 107 909 6,4% 66 587 69 276 4,0%
Forest Land 2 265 422 3 100 958 36,9% 410 241 616 096 50,2% 270 321 420 891 55,7%
Fishing Grounds 139 318 141 095 1,3% 29 889 36 085 20,7% 18 005 16 562 -8,0%
Built-up land 326 721 304 497 -6,8% 65 461 68 285 4,3% 38 214 39 040 2,2%
Carbon uptaking land 7 856 637 6 615 007 -15,8% 1 496 010 1 403 731 -6,2% 908 224 894 716 -1,5%
Total 19 703 829 17 602 820 -10,7% 3 627 988 3 854 294 6,2% 2 302 352 2 481 911 7,8%
Examining the absolute indirect ecological footprint values by land use, it seems that within the footprint of household consumption, the three most important elements are croplands, forest and carbon footprint. The three most important components are responsible for 95% of the absolute footprint and the other three components (grazing land, built-up land and fishing grounds related footprint) only have a share of less than 5%. Comparing the results in Table 1 with the national data (GFN database), it is interesting to note that the national contribution of the three smaller components is between 7-8%.
The ecological footprint embedded in household consumption showed a different direction at the level of different territorial units between 2003 and 2013. While this value fell by 11% nationwide, it rose by 6% for Budapest and 8% for the agglomeration.
The changes in the EF indicator is explained by the changes in the size of population and the size and structure of per capita consumption. The evolution of the Budapest and agglomeration population between 2003 and 2013 was different from each other, as well as from the national trend. While at national level the population decreased by 2% (from 10 142 362 to 9 987 908), in Budapest it increased by 2% (from 1 705 309 to 1 744 665) and in the agglomeration by 10% (from 1 053 448 to 1 155 338 people). In case of Budapest, the rapid population decline due to the migration loss (suburbanization) slowed down around 2004 and then stopped. Population, especially in the years following the financial crisis in 2008, started to grow.
Although the rapid population growth of the agglomeration zone was dampened by the financial and economic crisis of 2008, the population of most of the settlements near Budapest has grown steadily from year to year. On the one hand, immigration from rural areas was continuous, and on the other hand, due to the more youthful age composition, natural decrease was also lower than the national average, moreover, there was no positive natural reproduction in one settlement (Dövényi 2007, 2009;
KSH 2012a, 2012b).
Another important determinant of ecological footprint changes is the consumption structure, i.e. the evolution of ecological footprint per capita.
Table 2. Per capita indirect household consumption related ecological footprint by land use, in 2003 and in 2013 (gha).
Hungary (gha) Budapest (gha) Agglomeration
2003 2013 Change 2003 2013 Change 2003 2013 Change
Cropland 0,84 0,70 -16,7% 0,89 0,93 4,5% 0,95 0,90 -5,3%
Grazing Land 0,06 0,05 -16,7% 0,06 0,06 0,0% 0,06 0,06 0,0%
Forest Land 0,22 0,31 40,9% 0,24 0,35 45,8% 0,26 0,36 38,5%
Fishing Grounds 0,01 0,01 0,0% 0,02 0,02 0,0% 0,02 0,01 -50,0%
Built-up land 0,03 0,03 0,0% 0,04 0,04 0,0% 0,04 0,03 -25,0%
Carbon uptaking land 0,77 0,66 -14,3% 0,88 0,80 -9,1% 0,86 0,77 -10,5%
Total 1,94 1,76 -9,3% 2,13 2,21 3,8% 2,19 2,15 -1,8%
Examining the evolution of the household consumption related ecological footprint per capita, it can be seen that the gap has been opened in comparison with the different base (national, Budapest and agglomeration) related to the different income levels. On the basis of the data, it can be stated that the value of the household income or consumption to the pre-crisis level and its slow-moving value as well as the transformation of the domestic and import production structure and the slow improvement of eco-efficiency in Budapest is 4% in the agglomeration. A decrease of 2% was observed while a national decrease of 9% was observed. While in Hungary the absolute and per capita consumption ecological footprint decreased, both indicators increased in Budapest and in the case of the agglomeration the increase in the absolute footprint per capita ecological footprint – albeit at a lower rate than the national level – has declined.
In case of Budapest, the main reason for the growth is the increase of income levels and household consumption at a rate above the national average. In case of the agglomeration, the increase in population size leads to an increase in absolute footprint.
There are several reasons for this: the proportion of the dependent population is higher due to the large number of families with small children, and the population of the settlements around Budapest is not only a high status moving from Budapest, but also a lower income population moving from the capital or the countryside.
5. Conclusions
In the last few decades, the urban regions of the world have been characterized by the urban sprawl. It is characterized by a dynamically growing population (Africa, Asia) and shrinking urban areas (Europe) and directs researchers to the environmental sustainability of urbanization. In our study, we examined the environmental impacts of the development of the Budapest Metropolitan Region with the help of the ecological footprint concept. In the course of the calculations, we have quantified not only the direct, but also the indirect ecological footprint embedded into household consumption, using an input- output (IO) model supplemented with environmental data. The most important results are:
The ecological footprint embedded in household consumption showed a different direction at the level of different territorial units between 2003 and 2013. While it decreased by 11% nationally, it increased by 6% for Budapest and by 8% for the agglomeration.
The change is explained by the different dynamics of population change and the changes in the size and structure of per capita consumption. In the case of Budapest, the growth was primarily due to the increase in individual consumption and in the agglomeration primarily due to the increase in population.
Due to the different consumption structure resulting from the different social environment, in 2013 the agglomeration had a higher per capita ecological footprint of food consumption, energy consumption and transport, while in Budapest it was higher for health care, education, clothing and services (e.g. telecommunication, entertainment,
culture, hospitality and accommodation services). The latter can be explained mainly by the higher consumption opportunities resulting from higher per capita income.
On the basis of the study it can be stated that the methodology of ecological footprint is suitable for the environmental assessment of household consumption not only for the direct but also for the indirect components. It is also suitable for testing any geographical unit, provided that the consumption data is available in the appropriate area. In addition, the method may be used in the future for a deeper examination of a sub-area (such as commuting), but it is also a prerequisite for us to have adequate data on the area in relation to the expenditure for that activity.
References
Aall, C. & Norland, I., 2005. The use of the ecological footprint in local politics and administration: results and implications from Norway. Local Environment 10 (2), 159-172.
Barrett, J., Birch, R., Cherrett, N. & Wiedmann, T. 2005. Reducing Wales’ Ecological Footprint—Main Report. Stockholm Environment Institute, University of York; published by WWF Cymru, Cardiff, UK; March 2005.
Barrett, J. 2001. Component ecological footprint: developing sustainable scenarios. Impact Assessment and Project Appraisal 19 (2), 107-118.
Bicknell, K. B., Ball, R. J., Cullen, R. & Bigsby, H. R. 1998. New methodology for the ecological footprint with an application to the New Zealand economy, Ecological Economics, 27(2): 149–160.
Bohnet, I.C. & Pert, P.L. 2010. Patterns, drivers and impacts of urban growth—A study from Cairns, Queensland, Australia from 1952 to 2031 Landscape and Urban Planning 97: 239–248.
Collins, A. & Flynn, A., 2006. Engaging with the ecological footprint as a decisionmaking tool: process and responses. Local Environment 12 (3), 295-312.
Curry, R., Maguire, C., Simmons, C. & Lewis, K., 2011. The use of material flow analysis and the ecological footprint in regional policy-making: application and insights from Northern Ireland. Local Environment 16 (2), 165-179.
Dietz, Th., Rosa, E.A. & York, R. 2007. Driving the human ecological footprint Frontiers in Ecology and Environment 5. 1.
13-18.
Dövényi Z. 2007. A belföldi vándormozgalom strukturális és területi sajátosságai Magyarországon. Demográfia 50(4): 335–
359.
Dövényi Z. 2009. A belső vándormozgalom Magyarországon: folyamatok és struktúrák Statisztikai Szemle 87(7-8): 748–762.
Ewing, B., Reed, A., Galli, A., Kitzes, J. & Wackernagel, M. 2010. Calculation Methodology for the National Footprint Accounts, 2010 Edition. Global Footprint Network, Oakland.
Ferng, J. J. 2001. Using composition of land multiplier to estimate ecological footprints associated with production activity.
Ecological Economics, 37(2): 159–172.
GFN. 2012. Footprint Basics – Overview. Global Footprint Network, www.footprintnetwork.org. Accessed 17.11.2018.
Gu, Q., Wang, H., Zheng, Y., Zhu, J. & Li, X. 2015. Ecological footprint analysis for urban agglomeration sustainability in the middle stream of the Yangtze River. Ecological Modelling 318. 86-99.
Hengrasmee, S. 2013. A study of suburban Thailand. In. Vale, R., & Vale, B. (Eds.) Living within a fair share ecological footprint. Routledge. 201-214.
Hirt, S. 2013. Whatever happened to the (post)socialist city? Cities, 32. 529–538.
Hirt, S. 2007. Suburbanizing Sofia: Characteristics of post-socialist peri-urban change. Urban Geography, 28(8), 755–780.
Jones, Ch. & Kammen, D. M. 2014. Spatial Distribution of U.S. Household Carbon Footprints Reveals Suburbanization Undermines Greenhouse Gas Benefits of Urban Population Density. Environmental Science and Technology 48. 2. 895−902.
Kahn, M. E. 2000. The environmental impact of suburbanization Journal of PolicyAnalysis and Management 19. 4. 569–586.
Kahoun, J. & Sixta, J. 2013. Regional GDP Compilation: Production, Income and Expenditure Approach. Statistika, 93 (4), pp. 24– 36
Kissinger, M. & Haim, A. 2008. Urban hinterlands – the case of an Israeli town ecological footprint. Environment Development and Sustainability, 10 (4), 391– 405.
Kok, H., & Kovács, Z. 1999. The process of suburbanization in the agglomeration of Budapest. Netherlands Journal of Housing and the Built Environment, 14(2), 119–141.
Koppány, K., Kovács Z. & Dusek, T. 2018. A gazdasági teljesítmény területi eloszlása és koncentrációja Magyarországon.
(Spatial Distribution and Contentration of Economic Performance in Hungary). Kautz Gyula Memorial Conference, 5th June 2018, Győr, Hungary.
Kovács, Z., & Tosics, I. 2014. Urban sprawl on the Danube: the impacts of suburbanization in Budapest. In K. Stanilov, & L.
Sýkora (Eds.), Confronting suburbanization: Urban decentralization in postsocialist Central and Eastern Europe (pp. 33–64).
Oxford: Wiley-Blackwell.
KSH (2012a): Magyarország, 2011. 177 p.
KSH (2012b): A belföldi vándorlás főbb folyamatai, 1990–2011 Statisztikai Tükör 6 (85): 1 –5.
Legras, S. & Cavailhès, J. 2016. Environmental performance of the urban form. Regional Science and Urban Economics 59.
1–11.
Leontief, W. 1936. Quantitative input and output relations in the economic system of the United States. Review of Economics and Statistics, 18(3): 105–125.
Lu, Y. & Chen, B. 2017. Urban ecological footprint prediction based on the Markov chain. Journal of Cleaner Production 163.
146–153.
Moore, J., Kissinger, M., & Rees, W. E. 2013. An urban metabolism and ecological footprint assessment of Metro Vancouver.
Journal of environmental management, 124, 51-61.
Mostafa, M.M. 2010. A Bayesian approach to analyzing the ecological footprint of 140 nations Ecological Indicators 10. 808–
817.
Muñiz, I., Catalayud, D. & Dobano, R. 2013. The compensation hypothesis in Barcelona measured through the ecological footprint of mobility and housing Landscape and Urban Planning 113 113–119.
Mustard, J.F., Defries, R.F., Fisher, T. & Moran, E. 2004. Land-Use and Land-Cover Change Pathways and Impacts. In:
Gutman, G. – Janetos, A.C. – Justice, C.O., – Moran, E.F. – Mustard, J.F. – Rindfuss, R.R. – Skole, D. – Turner II, B.L. – Cochrane, M.A. (eds) Land Change Science: Observing, Monitoring, and Understanding Trajectories of Change on Earth’s Surface. Kluwier Netherlands. 411-429.
Ogle, J., Delparte, D. & Sanger, H. 2017. Quantifying the sustainability of urban growth and form through time: An algorithmic analysis of a city's development Applied Geography
Piña, W.H.A. & Martinez, C.I.P. 2014. Urban material flow analysis: An approach for Bogotá, Colombia Ecological Indicators 42: 32–42.
Rees, W. E. 1992. Ecological footprints and appropriated carrying capacity: What urban economics leave out. Environment and Urbanization, 4, 120-130.
Simmons, C., Lewis K. & Barrett, J. 2000. Two feet — two approaches: a component-based model of ecological footprinting.
Ecological Economics, 32(3): 375–380.
Slaev, A. D., Nedović-Budić, Z., Krunić, N. Petrić, J., & Daskalova, D. 2018. Suburbanization and sprawl in post-socialist Belgrade and Sofia. European Planning Studies, 26(7), 1389–1412.
Szigeti, C., Tóth, G. & Szabo, D. R. 2017. Decoupling – shifts in ecological footprint intensity of nations in the last decade, Ecological Indicators 72: pp. 111-117.
Thomson, G. & Newman, P. 2018. Urban fabrics and urban metabolism – from sustainable to regenerative cities Resources, Conservation and Recycling 132. 218–229.
Toth, G. & Szigeti, C. 2016. The historical ecological footprint: From over-population to over-consumption. Ecological Indicators 60: pp. 283-291.
Van der Bergh, J.C.J.M & Verbruggen, H. 1999. Spatial sustainability, trade and indicators: an evaluation of the ecological footprint Ecological Economics 29. 61–72.
Wackernagel, M., 1998. The ecological footprint of Santiago de Chile. Local Environment 3 (1), 7-25.
Wackernagel, M., Onisto, L., Bello, P., Linares, A. C., Falfán, I. S. L., Garcıa, J. M., Guerrero, A. I. S & Guerrero, M. G. S.
1999. National natural capital accounting with the ecological footprint concept. Ecological economics, 29(3), 375-390.
Wackernagel, M. & Rees, W. E. 1996. Our ecological footprint: Reducing human impact on the Earth, Gabriola Island, BC, New Society Publishers.
Wiedmann, T., Minx, J., Barrett, J. & Wackernagel, M. 2006. Allocating ecological footprints to final consumption categories with input–output analysis. Ecological Economics 56(1): 28–48.
Wilson, J. & Grant, J., 2009. Calculating ecological footprints at the municipal level: what is a reasonable approach for Canada? Local Environment 14 (10), 963-979.
Xu, S. & San Martin, I., 2010. Ecological Footprint for the Twin Cities: Impacts of Consumption in the 7-county Metro Area.
Metropolitan Design Centre, College of Design, University of Minnesota, Minnesota.