Doctoral School of Business Informatics
THESIS SUMMARY to the Ph.D. dissertation by
Fizar Ahmed
Matching future job requirements with educational portfolio
Supervisor:
Ildikó Borbásné Szabó Ph.D.
Budapest, 2018
Department of Information Systems
THESIS SUMMARY to the Ph.D. dissertation by
Fizar Ahmed
Matching future job requirements with educational portfolio
Supervisor:
Ildikó Borbásné Szabó Ph.D.
© Fizar Ahmed
3 Table of contents
1 The history and the importance of this research ... 5
1.1 Scope of the research ... 5
1.2 Research background ... 5
1.3 Research methodology ... 7
1.4 Research questions ... 8
2 The results of the thesis ... 9
2.1 Data collection ... 9
2.1.1 Central Statistical Office (CSO), Hungary ... 9
2.1.2 Eurostat ... 9
2.1.3 OECD ... 9
2.1.4 World Input-Output Database (WIOD) ... 10
2.2 Data Pre-processing ... 10
2.3 Experiment Result and Analysis ... 11
2.3.1 Modelling expected changes ... 11
2.3.2 Analysis with Business scenarios ... 14
2.4 Changing the requested labour force (technology, different structure) ... 15
2.5 An application scenario for labour requirements of an industry using different coefficient changes ... 17
2.5.1 Changes in the importance of managerial competences ... 19
2.5.2 General managerial competences ... 19
2.5.3 General competences before and after changes in coefficients ... 21
2.5.4 Sector-specific managerial competences ... 24
2.6 Validation of the model ... 24
3 Conclusion and Future Works... 25
4 Bibliography... 26
5 Publications concerning on the topic ... 26
4
Figure 1 Research steps... 8
Figure 2 Shows the number of workforces on production (thousand Euros) of the products broken down by the sections of the industries classification the NACE Rev. 2, in thousand persons. ... 12
Figure 3 Changes in labour output ... 13
Figure 4 Sector-wise number of labour for manager ... 14
Figure 5 Coefficients ... 14
Figure 6 Number and distribution of managerial position by sectors ... 15
Figure 7 Number and distribution of managerial position by sectors in 5 years ... 16
Figure 8 Changing coefficient values between two industries. ... 17
Figure 9 Total domestic product after changing coefficient. ... 18
Figure 10 Total labour in thousand ... 18
Figure 11 Occupation-based labour of manager position in a particular industry ... 18
Figure 12 Plot shows labour changes after changing coefficient... 18
Figure 13 The distribution of general competences among the selected occupations ... 20
Figure 14. Difference between new situations ... 21
Figure 15. The graph of changes labour according to general competences ... 21
Table 1 Occupation coefficient changes in percentages ... 13
Table 2 Competences in three groups ... 22
5
1 The history and the importance of this research
1.1 Scope of the research
Labor market is changing continually due to various environmental factors. Major influencing factors such as expanding promising economies, an increasingly global labor market and new technology are all having a significant impact on the demand and required supply of skilled labor as well as prospect for new employment. Therefore, uncovering the future job trends based on several economic indicators with the required skills in industrial sectors, especially in European industries, are of utmost importance, this is the main focus of this research.
For dramatic changes of technologies and other nature of jobs, the stability time of competences need to be maintained by HEI. 3-5 years time long is important for HEI to maintain the competence graphs. To minimize the gap in technology and other relevant issues between Member States of the European Union, they launched the Strategies for Smart Specialisation Platform1 (S3 Platform) in June 2011 to provide professional advice to EU member states and regions for the design of their research and innovation strategies for smart specialisation. In this research, many economical perimeters of EU Member States can be used for suggesting competence building as follows the present needs of industries.
The aim of this research is to develop a system that is capable of predicting future trends of jobs in different industries by following different economic scenarios and investigating the need for the development of core competencies in curricula. It is difficult to accurately predict which jobs and consequently which occupations will be demanded in the future, and how many jobs will be created in these occupations. Economic conditions, technological developments, demographics, consumer behaviors and many other factors are influencing labor market, occupational composition, and different types of future job opportunities.
1.2 Research background
This research shares some of the goals set out by the EUROPE 2020 strategy. "EUROPE 2020: A Strategy for Smart, Sustainable and Inclusive Growth" - in which the European Union defines their goals by 2020. The European Commission proposes two headline targets with others; these targets are: 75% of the population aged 20-64 should be employed and 3% of the EU's GDP should be invested in R & D. Employment generation is one of the most important factors for the
1 http://s3platform.jrc.ec.europa.eu/
6 development of a country (Borbás, 2012). However, for the development of sector-specific employment, it is compulsory to develop sector-specific skilled manpower. Countries, enterprises and individuals all recognize skills development as a strategic goal and consequently seek investment opportunities in skills. In aspiring to realize the potential of skills development, they face common challenges.
European labour market is now recovering from a very critical situation. According to the "Labour Market and Wage Developments in Europe 20152" reports, after two years of consecutive declines, in 2014 the hours worked per person employed have slightly increased. The reduction in the number of hours worked has been a key adjustment mechanism following the 2008 crisis and 2011 recession. EURES -The European Job Mobility Portal also shows that in late summer 2015, trends on the labour market continued to be favourable3. According to the Federal Employment Agency, after allowing for seasonal fluctuations, both unemployment and under-employment fell in August, and employment continued to grow. There is still solid demand on the labour market.
Developing the state of the labor market is now important to analyze the situation of skilled labor in the EU area. The report on "Labor market shortages in the European Union-2015" shows that in some regions there are qualitative shortages, especially related to skills shortages and mismatch by sectors and occupations, even though there are no quantitative shortfalls at EU-28. In this report they also found that there is simultaneously a large share of unfilled vacancies and a high unemployment rate, caused by qualitative inconsistencies between supply and demand. These qualitative features first and foremost refer to existing / missing skills, but may also be related to work experience, age, gender and work preferences. According to the National Employment Service of Hungary at the end of August 2015, more than half of the registered job-seekers were unqualified. Employers continue to report difficulties in finding enough workers with the appropriate skills. (Eurofound, 2017).
Looking at the details, there were 339,000 registered job seekers in Hungary at the end of August 2015, down 15.6% on the previous year. However, more than half of them were unqualified, while only 6% had a degree from higher education. At the same time, employers reported 50,100 vacancies, 53.5% less than the previous year. For example, in the ICT sector, there have been more than 10,000 positions unfilled for decades. This sector, providing 10-12% of the Hungarian GDP, has been expanding by 4.5% annually since the economic crisis, according to the Central Statistics Bureau (KSH), and the labor supply has not been able to keep up. " (Source: www.ksh.hu)
2 Directorate-General for Employment, Social Affairs and Inclusion, Directorate A — Analysis, Evaluation, External Relations, Unit A.5 — Labour Market Reforms
3 European Commission. Directorate-General for Employment, Social Affairs and Inclusion, 2015
7 Different studies deal with forecasting future competences. Systematic analysis is our main goal, so approaches using models or other methods for synthesizing knowledge sources fall into our scope.
Hence two research groups and two international institutions (OECD and CEDEFOP) specializing in this topic were selected to present their approaches. Their main characteristics are:
• Authors identify the research approach unequivocally.
• Scope presents a general forecast or focuses on a specialized area.
• Input shows which sources were used to build a model or determining predictions.
• Method is the key element of a research, because it reflects the reality in a restricted manner.
• Flexibility means that this research is capable of evaluating the small changes of factors.
These studies highlighted future competences based on the experts' actual opinions about the future or statistical analysis. The first two studies contained mostly qualitative analyzes, reducing the chance to examine the role of different influencing factors. But they give us new insights with defining new skills. The last two studies used quantitative analyzes based on past data, so the changes of influencing factors can be examined within these databases. But the current skill categories served as a basis for these analysis.
1.3 Research methodology
The aim of this research was to develop a system that is capable of predicting future trends of jobs in different industries by following different economic scenarios and investigating the need for the development of core competencies in curricula. It does not fit into the world of social science research, because it did not aim to discover rules and connections that explain interferences among people (Babbie, 2001). That's why research questions and not hypotheses determine the research directions. This research aimed to create a prototype in order to help investigate and answer these questions.
General economic rules were modeled in this prototype, hence this research required a deductive thinking method (Babbie, 2001). But the analysis of the domain was data-centric, so quantitative research was executed as well (Newman and Benz, 1998). The following steps have been taken to investigate applications of economic model focusing on employment.
1. First, an input-output economic model has been set up in order to be able to contextualize sector wise and occupational wise forecast.
2. Second, EUROSTAT and Hungarian Statistical Office data have been collected in a repeatable and automated fashion. Three coefficient tables have been made manually from the input-output table data.
3. Third, a programming script has been generated to find the result about future jobs.
4. Sector-wise competence sets extracted from ESCO have been integrated to these part of the system in order to finalize and prepare it to model future changes with the help of business
8 scenarios. The results can be analysed by a business analytics software like Tableau software. Following steps have been followed in this research work:
Figure 1 Research steps
1.4 Research questions
The research area has led to the following research questions:
1. What will be the future jobs according to technological and economic changes of a country, or more precisely, a region?
2. What is the macro-economic impact of future job trends?
Changes in demand and supply in different segments of labour market will affect the labour market position of workers with an educational background in a related field of study. Traditionally such discrepancies between supply and demand are thought to lead to unemployment in the case of excess supply and to unfilled vacancies or skill shortages in the case of excess demand (Wieling and Borghans, 2001).
The forecasting results identified the future job trends and inspired additional research questions:
1. How can geographic and sectoral employment supply and demand be balanced?
2. Is higher education developing manpower for the future?
3. Is it essential to update the academic curricula for ensuring the competencies for future jobs?
Answering the research questions we need a unified view to discover the skills needed by future jobs. Assuming the demand for manpower in large extent depends on the production / services volume and structure, first, we need to model, what is the expected production of the national or regional economy, what is the structure of the total production and how the structure is changing in time.
Input-output analysis facilitates the forecasting of number and composition of jobs in different industries. Since the goal is to develop a dynamic tool that can constantly monitor changes, then input (input-output analysis) will be used as input (government) data (such as tables on factors influencing economic growth). Based on the result of input-output analysis, the most important
Sector wise employment data collected for specific country or organization
Input-output Economic model used for generating future job
estimation
Conclusion Matching core competency with future jobs
development in curricula Generate
programming script to find result
9 sectors will be highlighted. Different classification frameworks (such as NACE, ISCO) help to connect occupational groups to sectors. ESCO contains competences required by occupations in a very structured manner.
Competences extracted from ESCO are connected to sectors through occupational groups. The system integrated these methods and data provides opportunities to run business scenarios reflecting future economic changes affected by different factors (such as economic or technological factors) in the system in order to analyze how the importance of different competences will change in the future. We are living in the era of the 4th revolution and it is not enough to hear the prophecies about future jobs, but the educational sector has to detect the important competences in the future in order to fit the students into future labor market needs. Using the output of this system as input of the SMART system (Castello et al., 2009), the compliance of educational and / or training programs with future job requirements will be analyzed and reported in a meaningful and clear form.
2 The results of the thesis
2.1 Data collection
The open government data serve as a basis to forecast future jobs and competence needs by detecting changes in the industrial structure. Just few special data sets were available on the Internet, so I had to cleanse them manually. If the governments join the Open Government Initiative and they publish their data regularly and in standard formats, moreover if APIs is developed to facilitate the data access, then these changes make this developed system more automatic. It will be capable of supporting the decision made on actual data dynamically.
My system is a proof-of-concept system, it provides opportunities to analyze future competence needs by following different business scenarios built-on past data. To use this system for making real decisions has the above-mentioned limitations.
The system uses the following data sets.
2.1.1 Central Statistical Office (CSO), Hungary
The NACE Rev. 2 (2008) classification is published by the Hungarian Central Statistical Office on its website along with other information of the national accounts. The information on persons related to the national account is important mainly for the calculation of the ratio, value added per worker in each industry of the national economy (Zbranek and Sixta, 2012).
10 2.1.2 Eurostat
EUROSTAT provides industry-by-industry symmetric input-output tables. Hungarian data in ESA 1995 format was used from their data source. The output matrix is an object as it is structured by industry. This organization presents supply and use tables and symmetric input-output tables that are a fundamental part of the European System of Accounts (ESA 1995).
2.1.3 OECD
The Organization for Economic Co-operation and Development (OECD) is involved in the preparation of Inter-Country Input-Output (ICIO) tables, which are based on a different International Standard Industrial Classification of All Economic Activities (ISIC) revised version.
The previous OECD national Input-Output tables present matrices of inter-industrial flows of goods and services (produced domestically and imported in current prices (USD million), for all OECD countries including 28 members of the European Union and G20 economies, covering the years 1995 to 2011 based on the ISIC Revision 2. The most recent version of ICIO tables is based on ISIC revision version 3. The better integration with collections of statistics accumulated according to industrial activity such as research and development expenditure, employment, foreign direct investment and energy consumption. The OECD I / OT database is a very useful experiential tool for economic research and structural analysis at international level as it highlights inter-industrial relations covering all sectors of the economy.
2.1.4 World Input-Output Database (WIOD)
The World Input-Output Database (WIOD) is the first public database that contains new information on the nature of international trade and trends and provides the opportunity to analyse the consequences of division for shifting patterns in demand for skills in labour markets. These tables have been put up in a clear conceptual framework on the basis of officially published input- output tables in concurrence with national accounts and international trade statistics. In addition, the WIOD provides data on labour and capital inputs at industry level. (Source: wiod.org)
The input-output model is to forecast changes in occupational structures due to economical growing, increasing productivity and technological innovations. The results can be derived from changes of external factors like GDP, and the distribution of labour/production or labour/sector/occupation. ESCO’s competences are connected to sectorial occupations. Hence we can detect the gap between actual and future competences based on economical changes.
11 2.2 Data Pre-processing
Input-Output table data can be collected in Microsoft Excel format from EUROSTAT data source.
In the ESA 2010, the product-by-product input-output table is the most important symmetric input-output table. However, few countries in the EU prefer to compile industry-by-industry tables. Table needs to be rearranged from the columns as follows the structure of NACE Rev. 2 Industry description (Table-1).
The above outlined method of estimation of the input-output table and the development of the labour estimate was used for the selected year 2008 on the data for the Hungarian economy. 2009 data for the final domestic demand used for the second year labour estimation. Additional yearly data can be used in the same format. The results in the research will be presented in aggregated form on the level of the sections of the classification for sake of clarity. In the result graph; all sections is being expressed using placeholders in form of letters.
2.3 Experiment Result and Analysis
2.3.1 Modelling expected changes
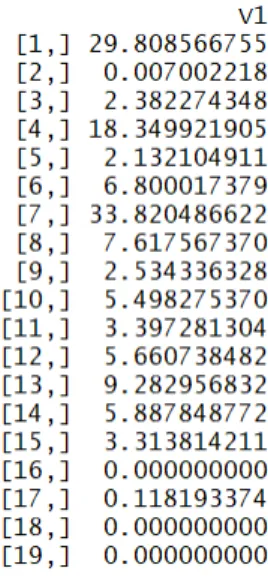
The numerical results of the total employment performance and labor requirement predictions for The numerical results of the total employment performance and labor requirement predictions for Hungary (2008) are presented in this analysis. As follows Table - 1 NACE Rev. 2 industry classification has been used in this analysis. The mentioned method of evaluation of the input- output table and the development of the labor valuation was used for a selected year 2008 on the data for the Hungarian economy. 2009 data for the final domestic demand used for the second year labor approximation. In the result graph below the sectors are expressed using alphabets (Ahmed, F, 2016).
12
Figure 2 Shows the number of workforces on production (thousand Euros) of the products broken down by the sections of the industries classification the NACE Rev. 2, in thousand persons.
The Figure 2 shows clearly that the most positive sectors for labor output in Hungary economy are the products of manufacturing industry (section C), wholesale and retail trade, repair of motor vehicles and motorcycles (section G) and real estate activities (section L). It is steady with reality in Hungary. This graph shows a clear decrease in the number of labor spent on mining and mining (section B) as well as on accommodation and food service activities (section I). In relation to the real output development it is clear that in the case of water supply, sewerage, waste management and remediation (section E) the labor output decreased. In the case of mining, both production and labor output decreased. In manufacturing production industry, labor output was significantly increased (33%).
The gradual development is also recorded for publishing, audio-visual and broadcasting activities, telecommunications and other information services (section J) and financial and insurance activities (section K). In this selected year, another two sectors are evident in legal, accounting, management, architecture, engineering, technical testing and analysis activities, scientific research and development, other professional, scientific and technical activities (section M), labor output drop electricity, gas, steam and air-conditioning supply (section D) and transport and storage (section H) workforce development are near zero.
Increase in labor output is evident in the case of agriculture, forestry and fishing (Section A) and Construction (Section F), when the number of labor output increased and current increase in
13 product was not significant. Steady in terms of labor output is clear in cases of the Education (section P) and the Human health services, Residential care and social work activities (section Q) and Arts, entertainment and recreation (section R). Public administration and defense, compulsory social security (section O) is also under minor change groups. The other services (section S) recorded the increase in total production, which is not a significant change in labor output.
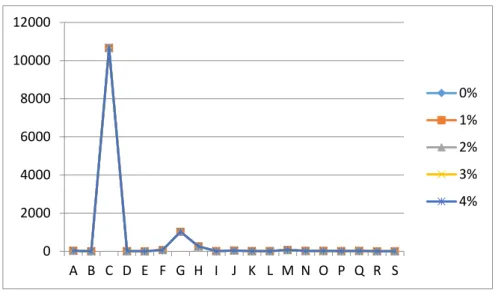
For the change in input-output coefficient we found a sensitivity analysis result. Coefficient changes in one sector affects all sectors significantly. Table-2 shows the input-output coefficient change in agriculture, forestry and fishing (section A) and it shows the significant change in labor output in different sectors4.
0% 1% 2% 3% 4%
0.378691 0.382478 0.386265 0.390052 0.393839
Table 1 Occupation coefficient changes in percentages
Figure 3 Changes in labour output
This shows that dramatically changing sectors of input-output coefficients, dramatically, are the sectors of industry (section C) and the wholesale and retail trade of motor vehicles and motorcycles (section G). Due to the decreasing of production, the percentage change of labor output shows in negative direction.
4 This result also published on my other conference paper: ECIC 2016 - 8th European Conference on Intellectual Capital.
14 The occupation input coefficient table can be found from basic input output table. The total values of input coefficients including the gross value added serving in each sector is as defined. This series of calculations is made for Basic Transaction Tables for 19 sectors in the 2008 Input-Output Tables.
Occupation = [Occupation coefficient matrix] * [Total Domestic Product]
A programming script has been generated to find the result. Occupation-wise number of labour (thousand) in each sector:
Figure 4 Sector-wise number of labour for manager
Now we change the coefficient value with some percentage. The changes in coefficient value depend on many economic parameters that are beyond the scope of this paper. Changing occupational coefficient for Sector 1 and Occupation 1 from 0.000958578 to 0.0009, 0.0005 and 0.0001 the result is as follows:
Figure 5 Coefficients
This result shows that the manager position is decreasing day by day by changing the coefficient value which comes from some economic factors.
For Coefficient 0.0001
For Coefficient
0.0009
For Coefficient 0.0005
15 Therefore, by using this framework academies who know the economic condition of a country and by following the economic trends they can predict the future occupation and can prepare their curriculum for future.
2.3.2 Analysis with Business scenarios
Business scenarios are to plan future activities depending on different – technological, economical, demographical – factors. This application (program) is capable of absorbing these thoughts by transforming them into the changes of coefficients. Our goal is to investigate future occupational and competence structure. We can distinguish five types of business scenario influencing job structure:
1. Time horizon / preference selection
2. Growing economy due to the increasing FDI
3. Changes in productivity not taking effects on sectorial structure
4. Changes in technological environment taking effects on sectorial structure 2.4 Changing the requested labour force (technology, different structure)
Figure 6 Number and distribution of managerial position by sectors
The business scenario reflecting the influence of increasing number of electric cars was used to present the working of this system, it shows the number and distribution of managerial positions by sectors. The expected changes in terms of growth of output, improving productivity and creating new (skilled) jobs will change the localization of managerial positions. The result is almost double the demand for skilled workers, and the relative growth is larger in the first economy than in the second and third.
16
Figure 7 Number and distribution of managerial position by sectors in 5 years
Nowadays, ESCO has collected the main managerial aspect, such as "plan, organize, coordinate, control and direct the work done by others." The figures show that the role of manager will increase in almost all sectors, so we can state that these competencies will be important in the future. But there are managerial competences specializing in a given sector, e.g. monitoring fields and managing agricultural staff by a crop production manager or monitoring technological trends and managing contracts by an ICT production manager. The more labor intensive sector, the more requiring its specific competences are.
Other internal and external factors that can affect the business scenario of employment are as follows: Internal and External Factors of Compensation, Internal Factors, Ability of Paying, Business Strategy, Performance Evaluation, Employee Potential, External Factors, Labor Market , Industry Norm, Productivity, Living Cost, Labor Unions, Laws and Regulations
The new technological phenomenon, is the fast growing ratio of electric cars among the vehicles.
Norway e.g. expected electric or hybrid cars make up half of new vehicle registrations in 2017 (Ecar, 2017). E-car manufacturing requires less significantly skilled jobs in the traditional machinery sectors, although less but better trained and skilled workers in the design and construction of car manufacturing. These changes will lead to the changes in the occupational structure (Hamilton, J. 2012).
On the other hand, the forecasted technology breakthrough will affect not only the manufacturing sector but also significant changes are expected in the energy sector. Electric Vehicles (EVs) promise technology for reducing the environmental burden of road transport. Other energy types such as renewable energy production provide the largest market swing over time: from 19% of
17 production in 2010, 32% is expected in 2020 and will continue to grow by 50% by 2050 (van Essen and Kaupmann, 2011).
Technology plays a vital role for changing labor market trends. In 2030, the share of electrified vehicles could range from 10 to 50 percent of new-vehicle sales. As a consequence, the technological impact on the demand side of labor market implies structural changes of required competencies. Educational institutes need time to change their educational portfolio due to the lead time of formal education. A system that is capable of predicting the future occupational structure and concluding to the required competencies can facilitate decision making processes both in the educational institutes and in the world of labor.
2.5 An application scenario for labour requirements of an industry using different coefficient changes
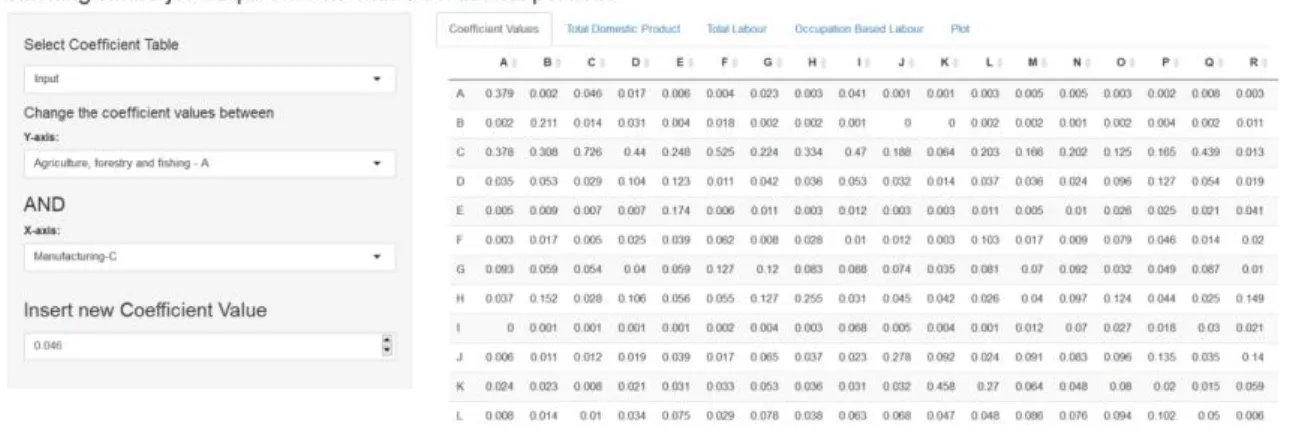
R-Shiny (shiny.rstudio.com) cloud application is used here for graphical viewing:
Figure 8 Changing coefficient values between two industries.
After changing co-efficient major changes have occurred in total domestic product affecting the quantities of labour.
18
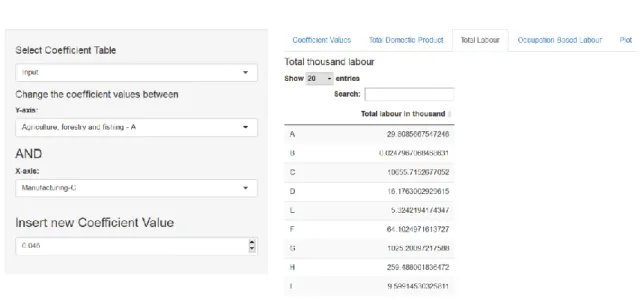
Figure 9 Total domestic product after changing coefficient.
Figure 10 Total labour in thousand
Figure 11 Occupation-based labour of manager position in a particular industry
Figure 12 Plot shows labour changes after changing coefficient.
19 2.5.1 Changes in the importance of managerial competences
Managers and supervisors are essential in the success of a change initiative. In times of change, those who lead the teams affected by change can be both a great associate and a real obstacle for change leaders. Managers are closest to employees who have to adopt new processes and behaviors associated with a project or initiative. And in many cases the same project also impacts their own work. Getting managers and supervisors on board and preparing to support their teams through change is crucial. It does not fit into a doctoral research to collect all sector-specific managerial occupations and their competences. Hence the following were selected to illustrate how we can use the output of the system for analytical purposes.
Occupations: crop production manager, Mine production manager, industrial production manager, power plant manager, water treatment plant manager, construction quality managers, sales account manager, warehouse manager, restaurant manager, telecommunications manager, insurance product manager, real estate manager, ICT research manager, social services manager, public housing manager, headteacher, elderly home manager, recreational facilities manager, quality services manager
2.5.2 General managerial competences
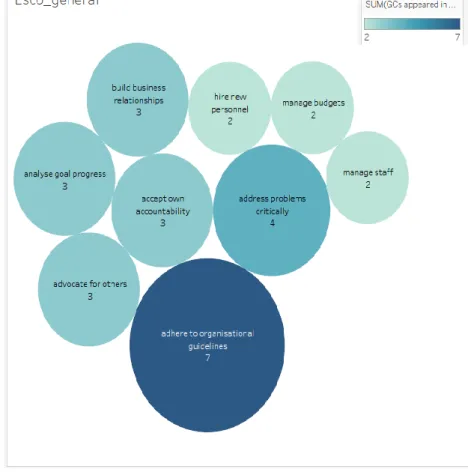
The following chart shows that there are cross-competences required by several occupations in both cases (general or sector-specific competences).
20
Figure 13 The distribution of general competences among the selected occupations
Different occupation comes with an occupational profile from ESCO portal. The profiles contain an explanation of the occupation in the form of description, scope note and definition. Additionally, they list the knowledge, skills and competences that experts considered relevant terminology for this occupation on a European scale. From many type of occupations, one common occupation as manager in different levels for individual sector is used here. Competences of different type managers are also picked up from ESCO portal. Figure 13 shows the number of matching competences from counted different sectors.
The point is that the future importance of these competences is influenced by more than one occupational change.
21 2.5.3 General competences before and after changes in coefficients
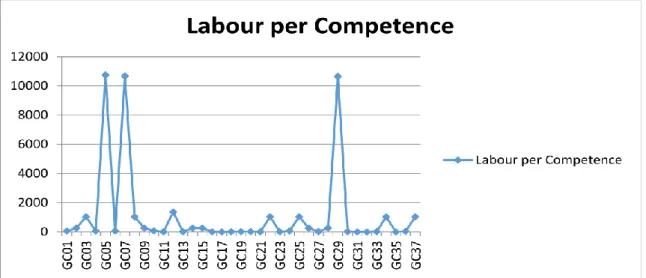
Figure 14. Difference between new situations
From Figure 14 we find that changes are not similar for all competences. Changes of labour quantities are very high for some competencies like GC01 (accept own accountability), GC04 (address problems criticially), GC06 (advocate for others). Changes almost similar for the competences GC17 (deal with pressure from unexpected circumstances), GC31 (plan medium to long term objectives), GC32 (present reports) and GC35 (supervise staff). No changes found on some competences like GC23 (establish daily priorities) or GC20 (develop organisational policies).
Therefore, it can be said that by changing the coefficient values we can calculate find the competences which are more important in employment market and from where academy can take decision regarding the importance of competence development.
Figure 15. The graph of changes labour according to general competences
22 Due to the forecasted changes on the mid-term (3-5 years), we can see occupational distribution in terms of the number of employed people in the different sectors of the economy are significant. As the weighted number of employees in managerial position will go along with changes in relative importance of individual competences. After having analyzed the volume changes in the original occupation structure, we can see, the changes would have effect on the demand for specific competences. Our analysis shows that some of the managerial competences have become much more important, but other groups still more important, but not that much. The results summarized in the table below:
GC05 adhere to organisational guidelines A
GC07 analyse goal progress A
GC12 build business relationships A
GC29 manage resources A
GC03 adapt to changing situations B
GC08 apply company policies B
GC22 ensure customer focus B
GC25 forecast account metrics B
GC34 speak different languages B
GC37 use communication techniques B
GC02 act reliably C
GC09 apply safety management C
GC14 coach employees C
GC15 comprehend financial business terminology C
GC26 have computer literacy C
GC28 manage budgets C
Table 2 Competences in three groups
High demand will be for the Competences exhibited in Group A: adhere to organizational guidelines, analyze progress, manage resources and build business relationships. The possible explanation of the increased importance of the mentioned competences may come from the long- term changes of global economy. As after the first and second economy, the third economy is getting more and more room in the production of GDP. Production and service industries are augmented in a growing extent by civil organizations, as well as spreading out of atypical work, remote offices, virtual companies or operating globally and in the virtual space demand a more
23 profound and granular understanding of what is the organization, how to create understand , decompose the strategy of the organization. The traditional business relations are also augmented by new relations, e.g. the high level of cooperating partners in the production sphere, or the outsourced service options creates new types of business relations. In general we can say that the digital transformation radically changes the organizational scope of business, and although understanding the business scope, strategy, business network are not new competence requirements, the need for terms of volume of educated employees will increase and this must have an effect on the portfolio of educational institutions.
Group B: can be divide into two subgroups (adapt to changing situations, apply company policies, ensure customer focus, forecast account metrics, speak different languages, use of communication techniques). Adaptation, adaptive company policies, customer focus may rise (in line with the Group A competences, explained above) from the fact, that digital transformation necessarily results widening global business connections. To act regionally or globally, the ability to adapt is a must, and here we can add, not only in business sense, but also in cultural sense as well. The extended interpretation explains why the subgroup 2 (speak different languages, use of communication techniques) goes with subgroup 1.
Group C (act reliably, apply safety management, coach employees, comprehend financial business terminology, have computer literacy, manage budgets) emphasizes those competences that focus more on managing better and different way of human resources. We expect more and more understanding the role of attitude (act reliably, apply safety management, coach employees) in everyday operations (cf. recent Nobel Prized Behavioural Economy theory). Reliability, paying attention to safety, spend more time on individual, customized training, like coaching – all investment in human resources. In other word, we may draw the conclusion, demand for not only responsible organisation but responsible performers will increase significantly. The rest of the competences in Group C can be considered as a consequence of those mentioned above.
Understanding budgeting or - in broader sense - locating, re-locating resources is not an isolated action on the top floor of corporate headquarter. In harmony with the Group A competences, the new types of businesses, the spread of atypical work also go hand in hand with the competence of responsible resource assignment. Understanding finance, the financial slang, vocabulary is also a must if budgeting is not entirely internal issue, but goes with high level involvement of external players. Crowdsourcing or micro-finance are good examples which already justify the presence and increasing importance of the mentioned competence group. Digital literacy is a precondition of digital transformation.
24 2.5.4 Sector-specific managerial competences
It seems to be that the competences connected to the element of supply chain like market research, sales, manufacturing, supply, financial activities and CSR activities are shared by more than one occupation.
2.6 Validation of the model
Concerning building this model, this is important to validate the model using different data set and need to find a compression analysis with this result. It will be exploited to determine that a model is a correct representation of the real system. Validation is usually accomplished through the fine tuning of the model, a repeated process of matching the model to concrete structure behavior and using the contradictions between two, and the discernments gained, to improve the model. This process is repeated until the model accuracy is judged to be satisfactory. This task is beyond my present study and I hope to work with it in my future research.
The analysis of the labor output development broken down by industry based on the input-output framework gives rational results. The result values on the people employed give quite rational information which is not at first sight inconsistent with the real evolution. Nevertheless, the final values of the labor output can be utilized by a certain simplifying assumptions.
The use of the ratio of the total demand of production input to output can be considered as a weakness, because as the initial ratios, the 2008 values for the Hungarian economy were heavily influenced by the economic crisis. However, this framework can be used for any relevant year subject to finding the available dataset. The second weakness is the absence of occupational classification in different industry sectors as the final goal of the research to find the matching of current academic curriculum with future demand of industries. The third weakness of the model is the possible inconsistency of using data from different data sources. Working with open data the danger of inconsistency is unavoidable; we need to find the appropriate methods to eliminate this type of risk.
All mentioned softness will be the object of our future research. To consider the accessible data sources, the weakness associated with the number of employed persons based on occupational classification can be solved using the data according to the catalog of occupations (HU-ISCO) which could be available for well ahead years for the Hungarian economy.
3 Conclusion and Future Works
There is significant mismatch between Academic Portfolio and market requirements suggested by the lack of skilled workforce. Moreover, the academia often fails to realize the future needs of the
25 market and prepare a better workforce for the future. The economic cost incurred due to this disparity is also enormous. This framework would be used to bridge the existing gap between academic training and market requirements. After inputting proper data from a particular market, e.g. Hungary, to this framework, can be predicted the needs of the market in the near and far future.
An appropriate academic portfolio can be developed by using the results. The portfolio derived from this framework would then be compared with the existing academic practices to determine how effective the current portfolio is in meeting the needs of the market. As the framework is based on the economic factors that shape the market, this framework is expected to create a better academic curriculum than the one existing that does not take data-driven market study into account.
Thus, a policy adjustment can be suggested to steer the academic curriculum in the right direction based on skill requirement of the future market.
As the main goal of this paper was to make a framework to predict the future occupation; by using this result educational institution can get an assumption of their future curriculum. This study extended the understanding of the impact of economic conditions that are active in assisting industries in making job creation and, on the other hand, implementing plans of action on academies to prepare their academic portfolio for long-term occupational outcomes. This finding points to the importance of extending career education efforts beyond education institutes to countries and region.
26
4 Bibliography
Babbie, Rubin, A..(2001). Research Methods for Social Workers (4th ed.). Belmont.
Borbás, L. (2012). Hungary’s competitiveness in the light of Europe 2020 strategy. In Proceedings- 10th International Conference on Mangement, Enterprise and Benchmarking (MEB
2012) (pp. 243-254). Óbuda University, Keleti Faculty of Business and Management.
Castello, V., Guerrero, J., Guspini, M., Mahajan, L., Beinhauer, R., Gabor, M. and Flores, E.
(2013). Enhancing Competences dynamic alignment between job and Education. Challenges and Evidences from the SMART project. ICERI2013 Proceedings, 1430-1437.
Ecar (2017): Half of all new cars in Norway are electric or hybrid | World Economic Forum, https://www.weforum.org/agenda/2017/03/norway-is-leading-the-charge-towards-electric- vehicles-and-just-hit-another-milestone-along-the-way-d69a8170-cbdc-4d8a-95cd-
f9bdf3c8e3ae/, last accessed 2017/08/18
Eurofound (2017). Articles | Eurofound. [online]. Available from:
https://www.eurofound.europa.eu/observatories/eurwork/articles/%20labour-market-industrial- relations/hungary-skills-shortages-a-major-challenge-for-employers, last accessed 2017/11/08 Hamilton, J. (2012). Electric Vehicle Careers: On the Road to Change. Occupational Outlook
Quarterly, 56(2), 14-21.
Newman, I. and Benz, C.R. (1998). Qualitative-quantitative research methodology: Exploring the interactive continuum. SIU Press.
van Essen, H., Kaupman, B.: Impacts of electric vehicles: summary report. (2011). DOI:
10.1787/9789264072930-10-fr
Wieling, M., and Borghans, L. (2001). Discrepancies between supply and demand and adjustment processes in the labour market. Labour, 15(1), 33-56.
Zbranek, J., and Sixta, J. (2012). Analysis of the labour inputs in the input-output framework.
In 20th IIOA conference in Bratislava.[online]. Bratislava (Vol. 25, No. 2012, pp. 29-06)
5 Publications concerning on the topic
International Journal Articles
Ahmed, F. (2017). A framework for matching future job requirements with educational portfolio. In SEFBIS Journal. NJSZT, Budapest, Hungary; 42-50; ISSN: 1788-2265
Gábor A., Szabó I., Ahmed F. (2017). Systematic analysis of future competences affected by Industry 4.0, CONFENIS 2017- International Conference on Research and Practical Issues of Enterprise Information System-Conference. (under publication in Lecture Notes in Business Information Processing)
International conference papers with proceedings
Ahmed, F. (2016). An Input Output Based Methodology to Find the Future Job Trends in Europe, ECIC2016-Proceedings of the 8th European Conference on Intellectual Capital: ECIC2016 (p. 349). Academic Conferences and publishing limited. ISBN: 978-1-910810-89-7