Appliance of Neural Networks in Basketball Scouting
Zdravko Ivanković
1, Miloš Racković
2, Branko Markoski
3, Dragica Radosav
4, Miodrag Ivković
51 University of Novi Sad, Technical Faculty "Mihajlo Pupin", Zrenjanin, Serbia, zdravko@tfzr.uns.ac.rs
2 University of Novi Sad, Faculty of Sciences, Institute of Mathematics, Novi Sad, Serbia, rackovic@dmi.uns.ac.rs
3 University of Novi Sad, Technical Faculty "Mihajlo Pupin", Zrenjanin, Serbia, markoni@uns.ac.rs
4 University of Novi Sad, Technical Faculty "Mihajlo Pupin", Zrenjanin, Serbia, dolores023@nadlanu.com
5 University of Novi Sad, Technical Faculty "Mihajlo Pupin", Zrenjanin, Serbia, misa.ivkovic@gmail.com
Abstract: These days, data mining is frequently used as a technology for analysing the huge amounts of data collected in sport. Basketball is one of most popular sports. Due to its dynamics, a large number of events happen during a single game. Basketball statisticians have the task of noting as many of these events as possible, in order to provide for their analysis. These data are collected by special software applications. In this paper, we used data from the First B basketball league for men in Serbia, for seasons 2005/06, 2006/07, 2007/08, 2008/09 and 2009/2010. During these five seasons, a total of 890 games were played. These data were analyzed using the feedforward technique in neural networks, which is the most often used technique in analyzing nonlinear sports data. As a final result, we concluded that the most important elements in basketball are two-point shots under the hoop and the defensive rebound, i.e. game "in the paint".
Keywords: neural networks; data mining; basketball
1 Introduction
Data mining in sport has seen an abrupt rise in recent years [10]. The developed tools and techniques have the aim to measure performances. These methods attract the attention of biggest sports associations because large amounts of money are involved in modern sports.
Before the occurrence of data mining and all its advantages, sports associations almost solely used the knowledge and expertise of people responsible for scouting. As the amount of data collected began increasing, the aim was to find more practical methods to extract knowledge from raw data. In the beginning, this led to hiring statisticians who could enable better performance measurements for a given organization and therefore more correct decision-making. The next step was to find even more practical methods; that is, to start using data mining techniques.
In order to apply data mining, data are needed. Depending on amount and richness of the available data, it is possible to extract the appropriate knowledge.
Basketball is a complex game between two teams trying to score more points and win. During a game, a large number of events occur and influence the game.
There are shots, offensive and defensive rebounds, turnovers, steals, blocks and assists [14], [15].
In this paper, data mining has been done using data collected in the Serbian men’s First B Basketball league. Data were collected for the games in five seasons:
2005/06, 2006/07, 2007/08, 2008/09 and 2009/2010. These are official data, collected by the statistics team of the Basketball Federation of Serbia. At the end of every game, statistician send data to the Federation, and they are accumulated in a common database.
In this paper, several types of analyses were done. In analyzing the influence of shooting from different court positions, the court was divided into eleven positions: six for two-point and five for three-point score. After that, the influence of the basic basketball parameters on winning the game was analyzed. These parameters were: one-, two- and three-point shots, defensive and offensive rebounds, steals and turnovers, blocks and assists[12]. Data mining analysis is done by neural networks [1].
The paper is divided in five sections. The first section is the introduction. In section two we give some basics about data mining. Section three deals with the application of data mining in different sports. Section four contains data analysis through all six phases of data mining CRISP-DM process on concrete basketball data from First B Basketball league of Serbia. Section five contains conclusions about the data mining results.
2 Data Mining
Data mining is the analysis of an (mostly large) observed data set in order to find positive connections and to sum up data in a new way which will be both understandable and useful to the data user [2]. It can also be said that data mining is an interdisciplinary branch that encompasses techniques such as machine learning, pattern recognition, statistics, databases and visualization, all in order to provide answers to obtaining information from large databases [3].
A special intra-industrial standard was developed for data mining, independent from industry type, tool and application. The intra-industrial standard process for data mining (CRISP-DM) was developed in 1996 by analysts representing DaimlerChrysler, SPSS and NCR. The CRISP is a non-profit standard freeware, enabling the fitting of data mining to general problem-solving strategies for business and research purposes. According to CRISP-DM, a data mining project has a life span consisting of six phases. Those phases are:
• Business/Research Understanding Phase
• Data Understanding Phase
• Data Preparation Phase
• Modeling Phase
• Evaluation Phase
• Deployment Phase
The flow of the changes; i.e. the next phase often depends on output from previous phase [4].
3 Appliance of Data Mining in Sport
Sport is full of data. These data may show the individual qualities of a certain player, the events that happened during a game, and/or how a team is functioning as a whole. It is important to determine which data should be stored and a way to maximally use them [5]. By finding the right way to extract sense from these data and to transform them into practical knowledge, sports organizations provide themselves an advantage in comparison to other teams [6].
Different sports associations have different attitudes to data. This approach may be divided into five levels [10]:
• There is no connection between sports data and their use
• The experts from a given field work on predictions using their instincts and hunches
• The experts from a given field work on predictions using data collected
• The use of statistics in the decision-making process
• The use of data mining in the decision-making process.
The first type of approach is when there is no connection between sports data and their use. These sport organizations often obtain certain data about players on their games and they ignore these. This is characteristic for amateur sports organizations, since their emphasis is on fun or on introducing the sports basics.
The next type of approach is based on an expert from a given field who is predicting based on his own experience. It used to be a widely accepted notion that these experts (coaches, managers, scouts) could efficiently use their insights and experience in order to reach the correct decisions. Decisions made from this type of approach are usually based on predictions or instincts, and not on real data and information. These decisions may include taking certain types of actions or making certain player changes because such a decision "looks right".
The third type of approach is when experts start using collected data. Decisions at this level include playing certain players, for whom is has been proven that they cooperate well and are taking actions that score points more often.
The fourth type includes statistics in the decision-making process. These statistical measurements may be simple, such as the measurements of the frequency of certain events; or complex, which divides the performance of a whole team and assigning merits to each player in given game or a league. Statistics is used as a tool, helping experts in making correct decisions.
The fifth type uses data mining techniques. They do have potential to help predictions. Statistical techniques are still at the core of data mining, but statistics is used to separate a pattern or any other behavior of interest (the tendencies of opponent players) from the background noise. Statisticians do not explain relations within data, since this is a point of data mining. This type of approach has a potential to be used in order to help experts to make appropriate decision or to be used independently in order to make decisions without experts. Most sports organizations use the third or fourth type of approach between data and their use, and only a few use data mining techniques. Although data mining was introduced in sport relatively recently, the results of teams who apply these techniques are exceptional [7].
Although the use of statistics in the decision-making process is certainly a step up from decision-making based on instinct, statistics can also lead decisions in a wrong direction if there is no deep understanding of a problem. This tendency of statistics may be a consequence of imprecise performance measurements or of insistence by the sports community on certain characteristics [8]. This we may support by the fact that a certain player may have exceptional individual statistics but may still have small influence on the team as a whole.
4 Analysis of Basketball Data
When data from a basketball game are collected, the next step is to find knowledge in this information. A number of different statistical methods may be applied to basketball, which is a sport full of action and therefore rich in data.
Data analysis and predictions have been the aim for numerous individuals and organizations for a long time. This motivation leads to a number of sport-oriented developments, such as statistic simulation and machine learning techniques [9].
Neural networks are the most dominant system in machine learning used in sports [10]. Using neural networks, data sets collected from games are analyzed in order to find patterns and tendencies due to competition and financial gain. Other techniques are genetic algorithms, ID3, C4.5 and C5.0 decision trees, and a regressive variant of the Support Vector Machine (SVM) classificator called the Support Vector Regression (SVR). Data analysis, which is a subject of this paper, was done according to the CRISP-DM standard, encompassing several phases.
4.1 Business/Research Understanding Phase
Basketball is a competition between two teams with the aim to win. A win is attained by scoring more points than the other team. Some coaches like to say that the aim is to give up less points than the opponent, i.e. that the game is won by defense. In both cases, the winner is decided by the number of points scored.
Shots may be scored in several ways, and they bring a different number of points.
The hardest to achieve are long-distance shots, so they bring the most points. On the floor, there is a line at 625 centimeters from a basket, and shots from outside this line bring three points (in some leagues this boundary is moved even further from the basket). Within this line, every score brings two points. During a game, it happens that a player is irregularly disrupted by opponent players, and this is called a foul. If the foul is done during an attempt to score, or if the team committing the foul have already exceeded the limit (four fouls committed during a period, or quarter), then a player has a chance to score from the free-throw line.
Every shot scored from this line brings one point. Depending on whether a foul was committed while a player was trying to score two or three points, he will have opportunity to try two or three free throws, respectively.
When shooting for two points, three points and when throwing free throws, a player may make the shot or miss the shot, i.e. to score or to miss. The relation between shots and scores is called shooting percentage. In basketball statistics, there are separate percents for one-point shots, two-point shots and three-point shots.
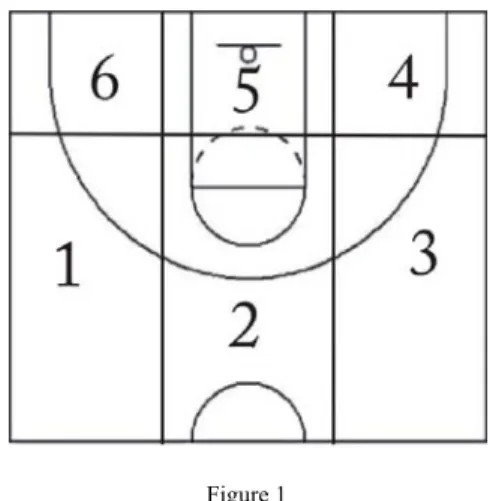
In the Serbian First B basketball league for men, the floor is divided into six zones so that measurements of shooting percentage for two points is possible from six positions, while three-point scores measurements are possible from five positions (there are no three-point shots from a position underneath the basket). When shooting for two points, it is not the same if the shot is done underneath the hoop or from some distance. In addition, when shooting for a three-point score, it is important whether shots are tried from a position in front of a basket (position 2) or from court corners (positions 4 and 6) [13]. Figure 1 shows the division of the court into zones.
Figure 1 Basketball court
4.2 Data Understanding Phase
For keeping statistics in the Serbian First B basketball league of for men, Basketball Supervisor (BSV) software is used. This program enables entering all relevant data for a basketball game. At the end of every period, statistics recorded by this program are printed and distributed to host and guest players, commissioners of the game, and to the media. After the end of the game, collected data are sent to the Basketball Federation of Serbia where they are stored for further analysis. In this paper, statistics are analyzed for all games of the Serbian First B basketball league for men in seasons 2005/06, 2006/07, 2007/08, 2008/09 and 2009/10.
The database is organized in such a way that data regarding a shot are entered into the table game_stat. This table is shown in Figure 2. Here we will discuss fields P1OK and P1ALL, representing successful free throws and the total number of shots from the free-throw line, respectively. Fields P2xOK and P2xALL (x=1,2,3,4,5,6) are successful two-point shots from six different positions on the court, and the total number of two-point shots from those positions. Finally, P3yOK and P3yALL (y=1,2,3,4,6) are data regarding three-point shots from five different positions. These positions are shown in Figure 2.
The game_stat table encompasses all data regarding shots. It does not contain the final results games, nor who won. These data are located in a table called game.
This table is also shown in Figure 2. The parameters of interest for use in this table are RESHOME and RESGUEST, representing the number of points scored by the host and the guest team, respectively.
Figure 2
Data organization in the database
4.3 Data Preparation Phase
Data within the database are connected to individual players. In the analysis that is a subject of this paper, we are interested in comparing the influence of shot precision for one-, two- and three-point shots on the wins of the team observed.
Therefore, we need to summarize the data regarding players in order to obtain data for a team as a whole.
Before summarizing the data, we will merge the tables game_stat and game. The merging will be done using the attribute ID_GAME so that in every row observed we will have shots from different positions and the result data as well.
Since we are interested in the shot percent from certain positions, we will divide the values for successful shots from a position to the values representing the total number of shots. The appearance of the SQL command that selects the appropriate data is as follows:
select
if(sum(p1all) != 0, sum(p1ok)/sum(p1all), 0) p1_percent, if(sum(p21all) != 0, sum(p21ok)/sum(p21all), 0) p21_ percent, if(sum(p22all) != 0, sum(p22ok)/sum(p22all), 0) p22_ percent, if(sum(p23all) != 0, sum(p23ok)/sum(p23all), 0) p23_ percent, if(sum(p24all) != 0, sum(p24ok)/sum(p24all), 0) p24_ percent, if(sum(p25all) != 0, sum(p25ok)/sum(p25all), 0) p25_ percent, if(sum(p26all) != 0, sum(p26ok)/sum(p26all), 0) p26_ percent, if(sum(p31all) != 0, sum(p31ok)/sum(p31all), 0) p31_ percent, if(sum(p32all) != 0, sum(p32ok)/sum(p32all), 0) p32_ percent, if(sum(p33all) != 0, sum(p33ok)/sum(p33all), 0) p33_ percent, if(sum(p34all) != 0, sum(p34ok)/sum(p34all), 0) p34_ percent, if(sum(p36all) != 0, sum(p36ok)/sum(p36all), 0) p36_ percent, if(id_club1=id_club,
if(reshome > resguest, 'win', 'loss'), if(reshome < resguest, 'win', 'loss')) result from yubadata.game g, yubadata.game_stat gs
where g.id_game = gs.id_game group by g.id_game, gs.id_club;
After executing the inquiry, we obtain the data as the shot percent for one point, the shot percent for two points at six positions, and the shot percent for three points from five positions, as well as the information on whether a team won or lost the game. The total number of rows obtained is 1780. This means that in five seasons, a total of 1780/2=890 games were played, and for each one we have data for the host and the guest team.
4.4 Modeling Phase
Modeling was done using neural networks. The input parameters for the network are p1_percent, p21_percent, p22_percent, p23_percent, p24_percent, p25_percent, p26_percent, p31_percent, p32_percent, p33_percent, p34_percent and p36_percent. The output parameter is result. Therefore, the network will have twelve input nodes and one output node. In addition to these, the network has one hidden layer. The neural network used was a feedforward neural network. Every layer within the network is fully connected to all nodes in the previous level, as well as in the next level of the network.
Network training is done by the error backward propagation method, based on the generalized delta rule. For every record brought to the network during training, information goes forward through a network in order to give a prediction in the output layer. This prediction is compared to the real output value of the
information observed, and the difference between the real and the predicted value is returned backwards through the network in order to adjust difficulty factors and improve the prediction of the next records [9], [11].
During training, the input data set was divided into 75:25 ratios, to data that will be used during network training and to data that will be used for testing. This was done in order to prevent the network from memorizing inputs and losing its robustness.
After the execution of the network training on input data, we obtain the following relation: how a certain parameter influences the final outcome of a game. Table 1 shows the influence of certain parameters on output. This relation may be shown by a histogram as in Figure 3.
Figure 3
Influence of basketball parameters on result
In the table, it is visible that the two-point shots from position five, underneath the basket, had the highest influence on winning the game. Somewhat lower influence was the one-point shots and then the three-point shots. Two-point shots from other positions had the least influence.
Table 1
Influence of basketball parameters on result Variable Influence
p1_percent 0.121 p21_percent 0.022 p22_percent 0.035 p23_percent 0.037 p24_percent 0.023 p25_percent 0.314 p26_percent 0.027 p31_percent 0.089 p32_percent 0.058 p33_percent 0.113 p34_percent 0.067 p36_percent 0.096
4.5 Model Evaluation Phase
Using the data mining model, created by a neural network, we may use the testing data set in order to establish model quality in predicting the output variable. If all results of games and all predictions are reviewed, we obtain that 1182 from 1780 outcomes were correct, which is 66.4% from the total number of input data. On the other hand, the model did not correctly predict the outcome in 598 cases, or 33.6%. These results are shown in Table 2.
Table 2 Prediction results
True 1182 66.4%
False 598 33.6%
Total 1780
From 890 wins documented (at every game there is a winner and a loser, so the number of wins and losses is identical), the algorithm correctly predicted 651, while for 239 wins it predicted losses. Regarding losses, algorithm correctly predicted 531 from 890 losses, and for 359 losses, it predicted wins. The confidence matrix is shown in Table 3.
Table 3 Confidence matrix
won lost won 651 239
lost 359 531
One of the reasons for the 64.4% exactness was that the final outcome is under the influence of other parameters as well: mostly offensive and defensive rebounds, assists, steals, turnovers and blocks. In order to include these parameters in our model, we must return to data preparation stage and gather new data for modeling.
4.6 Data Preparation Phase
In the data preparation phase, we included new data in the inquiry. These data will be modeled in order to increase the model precision. These data are offensive and defensive rebounds, assists, steals, turnovers, and blocks. In addition to introducing new data, we also summed up two- and three-point shots. This means that all two-point shot percents are now located under a single field (and the same goes for three-point shots).
select
if(sum(p1all) != 0, sum(p1ok)/sum(p1all), 0) p1_percent, (sum(p21ok)+sum(p22ok)+sum(p23ok)+
sum(p24ok)+sum(p25ok)+sum(p26ok))/
(sum(p21all)+sum(p22all)+sum(p23all)+
sum(p24all)+sum(p25all)+sum(p26all)) p2_percent, (sum(p31ok)+sum(p32ok)+sum(p33ok)+
sum(p34ok)+sum(p36ok))/
(sum(p31all)+sum(p32all)+sum(p33all)+
sum(p34all)+sum(p36all)) p3_percent, sum(def_reb) def_reb,
sum(of_reb) of_reb, sum(assist) assist, sum(steal) ukradena,
sum(lost1)+sum(lost2)+sum(lost3)+sum(lost4)+sum(lost5) lost, sum(block) block,
if(id_club1=id_club,
if(reshome > resguest, 'win', 'loss'), if(reshome < resguest, 'win', 'loss')) result from yubadata.game ut, yubadata.game_stat gs where g.id_game = gs.id_game
group by g.id_game, gs.id_club;
4.7 Modeling Phase
Modeling was done using neural networks. The input parameters are p1_percent, p2_percent i p3_percent, of_reb, def_reb, assist, steal, lost (turnover) and block.
The output parameter is result. Therefore, the network has nine input nodes and one output node. In addition to these, the network has one hidden layer.
During network training, the input data set was divided into 75:25 ratios, to data that will be used in the network training and data that will be used for testing.
After the execution of the network training on input data, we obtain the following relation: how a certain parameter influences the final outcome of a game. Table 4 shows the influence of certain parameters on output. This result may be shown by the histogram in Fig. 4.
Table 4
Influence of basketball parameters on result Variable Influence p1_percent 0.0796 p2_percent 0.1558 p3_percent 0.1535 def_reb 0.1588
of_reb 0.1214 assist 0.0223
steal 0.1253 lost 0.1239 block 0.0594
Figure 4
Influence of basketball parameters on result
From the graph it is visible that the defensive rebound has the highest influence on wining. The two-point shot has a somewhat lower influence, then the three-point shot, and the number of assists has the least influence.
4.8 Model Evaluation Phase
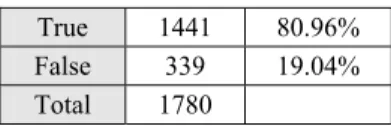
In this data mining model, created using a neural network, we may use again the same data set in order to see how good the model is in predicting the output variable. If all games results and all predictions are reviewed, we obtain that 1441 from 1780 outcomes were correct, which is 80.96% from the total number of input data. On the other hand, the model did not correctly predict the outcome in 339 cases, or 19.04%. These results are shown in Table 5.
Table 5 Prediction results
True 1441 80.96%
False 339 19.04%
Total 1780
From 890 wins documented, the algorithm correctly predicted 680, while for 210 wins it predicted losses. Regarding losses, the algorithm correctly predicted 761 from 890 losses, and for 129 losses it predicted wins. The confidence matrix is shown in Table 6.
Table 6 Confidence matrix
won lost
won 680 210 lost 129 761
The model now including most relevant basketball parameters has relatively high prediction correctness for game outcomes based on input parameters. More than eighty percent of input data would correctly predict the game outcome. After this, the next phase is to apply this model to predict game outcomes.
Conclusions
“Get to know the enemy and get to know yourself; in a hundred battles you may never be in danger. If you don't know the enemy but get to know yourself, your chances of winning or losing are equal. If you know neither the enemy nor yourself, you are undoubtedly in danger in every battle.”
Sun Tzu Wu, The Art of War, 450 BC
Data mining in sports provides serious advantages to its users. It makes it possible to apprehend all important elements of a basketball game and to extract knowledge from the data collected. In this way, teams get to know themselves, because they are able to see what they need in order to win, where they mostly make mistakes, which elements of the game call for improvements... Moreover, using basketball analysis and data mining as the highest level of analysis, teams may know their opponents and prepare tactics for the game. Basketball scouting, as well as the analysis of their own and the opponent’s team, has become the essential part of preparation for all games in professional leagues.
Using existing data from Basketball Federation of Serbia for seasons 2005/06, 2006/07, 2007/08, 2008/09 and 2009/10, we have done the analysis applying neural networks as a data mining method, which is often used in analyzing sports events.
The general conclusion of all the analyses is that the game under the hoop is crucial for winning the game. In defense, it is important to catch the ball after the opponent's shot and preventing them from next offensive attempt, while in offense it is most important to be precise under the hoop or to score "points in the paint".
The data collected are relevant for the First Basketball League of Serbia, and the model created may be applied to other leagues of similar quality. It is to be expected that some higher-quality leagues (such as the NBA) or lower-quality ones (such as municipal leagues), as well as junior leagues, would create somewhat different models.
The flaw in keeping statistics with most of the existing programs is that a large number of basketball elements remain undocumented. With those programs, we do not know which player guarded which opponent, how much players run in offense and defense, which moves they performed and how much the ball was passed before being shot. Programs such as BSV are used in real time, during a game, so there must be some selection as to which events to include and which not. In order to obtain more complete knowledge about the game and to discover some new patterns, we need a richer data set and new software solutions so that by subsequent appraisal of a game we document all relevant events.
References
[1] Jaroslava Zilková, Jaroslav Timko, Peter Girovsky, "Nonlinear System Control Using Neural Networks", Acta Polytechnica Hungarica, Vol. 3, Issue 4, 2006
[2] D. Hand, H. Mannila, P. Smyth, "Principles of Data Mining", MIT Press, Cambridge, MA, 2001
[3] P. Cabena, P. Hadjinian, R. Stadler, J. Verhees, A. Zanasi, "Discovering Data Mining: From Concept to Implementation", Prentice Hall, Upper Saddle River, NJ, 1998
[4] D. Larose, "Discovering Knowledge in Data - An Introduction to Data Mining", Wiley Interscience, 2005
[5] K. Lyons, "Data Mining and Knowledge Discovery", Australian Sports Commission Journals 2(4), 2005
[6] N. O'Reilly, P. Knight 2007. "Knowledge Management Best Practices in National Sport Organizations". International Journal of Sport Management and Marketing 2(3): 264-280, 2007
[7] R. Stefani, "A Taxonomy of Sports Rating Systems", IEEE Transactions on Systems, Man, and Cybernetics - Part A 29(1): 116-120, 1999
[8] L. Fieltz and D. Scott, "Prediction of Physical Performance Using Data Mining", Research Quarterly for Exercise and Sport 74(1): 1-25, 2003 [9] H. I. Witten, and E. Frank, "Data Mining: Practical Machine Learning
Tools and Techniques, 2nd Edition". Morgan Kaufmann, San Francisco, 2005
[10] R. Schumaker, O. Solieman and H. Chen, "Sports Data Mining", Springer, 2010
[11] Rita Lovassy, László T. Kóczy, László Gál, " Function Approximation Performance of Fuzzy Neural Networks", Acta Polytechnica Hungarica, Volume 7, Issue 4, 2010
[12] Oliver, D.: Basketball on Paper - Rules and Tools for Performance Analysis. Washington DC, 2004
[13] Markoski, B., Radosav, D., Vasiljević, P., Milošević, Z.: Košarkaška statistika. International Conference Dependability and quality management ICDQM 2009, Belgrade, Serbia, 776-781, 2009
[14] FIBA - Official Basketball Rules, 2008 [15] FIBA - Basketball Statisticians’ Manual, 2008
[16] Ivankovic Z., Rackovic M., Markoski B., Radosav D., Ivkovic M.,
"Analysis of Basketball Games Using Neural Networks", CINTI 2010, pp.
251-256, November 18-20, 2010, Budapest, Hungary