DOI: 10.1556/606.2020.15.3.7 Vol. 15, No. 3, pp. 72–78 (2020) www.akademiai.com
AI BASED DETECTION OF GAS HYDRATE FORMATION IN THE FIELD
1 Ildiko BOLKENY*, 2 Laszlo CZAP
1 Research Institute of Electronics and Information Technology, University of Miskolc H-3515 Miskolc-Egyetemváros, Hungary, e-mail: bolkeny@eiki.hu
2 Institute of Automation and Infocommunication, University of Miskolc H-3515 Miskolc-Egyetemváros, Hungary, e-mail: czap@uni-miskolc.hu
Received 27 December 2019; accepted 19 March 2020
Abstract: During the production of natural gas one of the major problems is the formation of hydrate crystals in the pipeline. The forming hydrate crystals can form hydrate plugs in the pipeline. The hydrate plugs lengthen production outages and result in financial losses for the producer, because the removal of the plugs is a time consuming procedure. One of the solutions used to prevent hydrate formation is the injection of modern compositions to the gas flow. The modern compositions help to dehydrate the gas, thus, the size of hydrate crystals does not increase. The substances, used in low concentrations, have to be locally injected, at the gas well sites. Inhibitor dosing depends on the amount of gas hydrate present. In the article a neural network based predictive detection solution is presented, which uses four factors.
Keywords: Gas hydrate, Inhibitor, Neural network, Hydrate detection
1. Introduction
Natural gas hydrates are crystalline solids composed of water and gas. The gas molecules are trapped in water cavities that are composed of hydrogen-bonded water molecules [1]. Typical natural gas composition includes methane, ethane, propane and carbon dioxide. There are three conditions for hydrate formation, which are water production of gas well; low temperature; and high pressure of pipeline [2].
* Corresponding Author
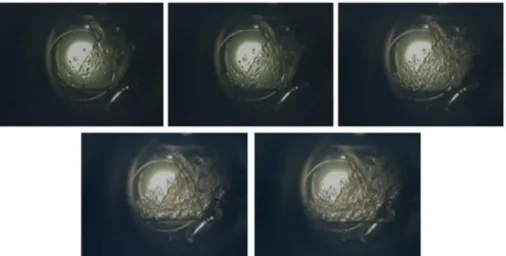
Hydrate particles can form hydrate-plugs. Process of hydrate formation under laboratory conditions can be seen in Fig. 1. In the three images, the growth of hydrates can be observed at three consecutive moments.
Fig. 1. Process of hydrate formation, (source: Research Institute of Applied Earth Sciences, University of Miskolc)
The number of hydrate molecules can increase to a level, where the molecular agglomeration process can begin, which can cause of plug formation in a given section of the pipeline. In worst cases the hydrate plugs can affect production outages [1].
In the gas industry the most popular solution to inhibit the formation of hydrates is the use of thermodynamic inhibitors, which shift the hydrate curve to a region where the conditions are not appropriate for stable hydrate formation [3]. Newer alternative technologies include the injection of low doses of hydrate inhibitors like kinetic hydrate inhibitors, which can prevent the growth of hydrate molecules [4].
To inhibit hydrate formation and to determine correct inhibitor dosage it is essential to determine the presence of hydrates in time. In this article a neural network based detection method will be presented, that predicts the hydrates’ formation using the four following parameters, pressure temperature, and the quality and quantity of the inhibitor.
2. About the data used
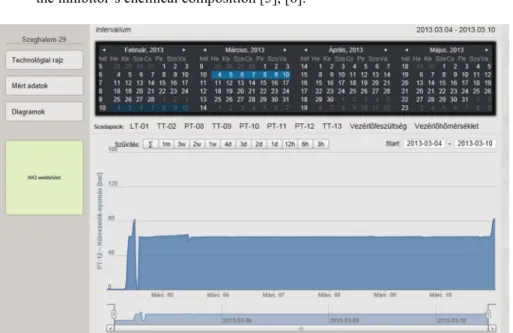
The data used in my research comes from the measurement system of a motorized chemicals-injector device, placed in the vicinity of a well. After installing and putting the device into operation a test run sequence was started. The tests had begun in October of 2012 and continued till May of 2013, up until when the hydrate inhibitor’s injection was no longer necessary. The measurement data, presented in Fig. 2, had been recorded
using computer software, developed for tests in the field, with a few custom modifications added.
The whole set of data, or just parts of it for easier processing, can be downloaded from a database, on a server. During the evaluation, the measurement data was divided into one-week long segments for easier understandability. The most important parameters amongst the gathered data are:
‒ the soil temperature;
‒ the pipeline pressure;
‒ the injection frequency;
‒ the inhibitor’s chemical composition [5], [6].
Fig. 2. Data measuring program, (source: Research Institute of Applied Earth Sciences, University of Miskolc)
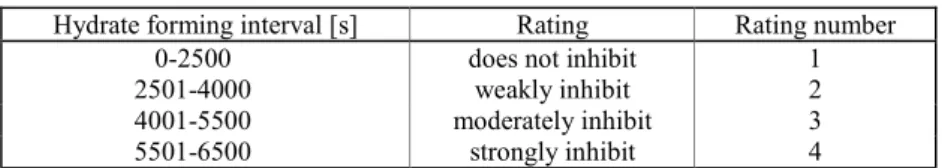
Out of all these four have higher importance. Out of the four most important parameters the three that are measured are the temperature, pipeline pressure and the injection frequency and these significantly effect hydrate development. The last one, the inhibitor’s chemical composition is noted down during filling the inhibitor tank with it and is unchanged, thus known throughout the measurement. To determine if an inhibitor composition has any effect or not, Table I is used as reference.
In this work the used data has been generated throughout 29 test weeks. After analysis of the data 45 data sets with around 4500 data points were manually selected.
Using these data sets the neural network can later be taught.
Selected raw data was scaled and normalized. From the resulting data that was suitable for the networks three main datasets were generated, which were training on a validation and a test dataset.
Table I Inhibitor efficacy
Hydrate forming interval [s] Rating Rating number
0-2500 does not inhibit 1
2501-4000 weakly inhibit 2
4001-5500 moderately inhibit 3
5501-6500 strongly inhibit 4
The training dataset is suitable to train the features of prediction and configure the weights of the network’s variables during the training process [7]. The validation dataset is used to stop the training process at the right time. This independent dataset is very important; it has to stop the training process after it has managed to reach a pre- determined progress level. If an early stop occurs, then the network does not learn the main features of the training data. In the other case, when the training process of the neural networks takes longer than the optimum, the network can be over-trained [8].
This means that the network can give a good estimation when an unknown, independent dataset is used. The test dataset is used to compare the results of different network structures. This dataset is also independent of the training and validation sets. The main parameters of datasets can be found in Table II.
Table II
Main parameters of the datasets
Dataset Number of used
measurements [pieces]
Number of data points [pieces]
Training dataset 22 2178
Validation dataset 12 1068
Test dataset 10 1080
3. AI based predictive detection
The goal was to develop an accurate, stable and neural network based structure that is an Artificial Intelligence (AI) based solution. Several network structures have been studied. In this paper one family was used, the Neural Network Auto-Regressive X (NNARX) model with exogenous input, which uses the required outputs as inputs in the regressor [9] (set of input variables). The transfer function of neural network is:
)]
( , ), 1 ( ), ( , ), 2 ( ), 1 ( [ )
( i req req ro
est t f x t x t x t n y t y t n
y = − − L − − L − , (1)
where yest(t) is the network output at the tth instant of time; x(t-1) is the used input of the network at t-1th instant of time; yreq(t-1) is the required output from the network at t-1th instant of time; ni is the size of used tapped delay line of the inputs; and nro is the size of used tapped delay line of the required outputs. One example for NNARX network can be seen in Fig. 3, with the used regressor and the mapping function.
A NNARX structured a Multiple Input, Single Output (MISO) neural network has been taught. There are, in total, four inputs, which are x, y t and r and a single hidden layer is used.
Fig. 3. NNARX structure (ni = 2, nro = 2)
To find the best network for the system the influence of various network sizes were investigated.
As outputs, artificially generated alarm patterns were created. There was an alarm where the pressure reached 75% of its maximum value. Until the actual differential pressure value was under the limit, the alarm signal was also zero. When it reaches the limit, the signal changed to 1. Using this condition, the outputs can be produced and used for teaching.
During the training process multiple neural networks were trained, where the number of hidden neurons and the tapped delay size of inputs and outputs were varied.
The Levenberg-Marquard training algorithm was used for training in Matlab environment with NNSYSID toolbox [10]. To avoid over-learning a maximum of 1000 iterations were used during a training process, and training was stopped where Mean Squared Error (MSE) of validation dataset was found to be minimal [11].
To determine the performance of a newly developed system, since the MSE value does not give adequate information about the efficiency of the networks, the use of a different index value is suggested. The characteristics of the outputs are similar to shorter or longer impulse waveforms. The Rising Edge (RE) of these impulses in outputs of the network can be investigated and used for comparison. There are several methods, which can be used to find edges in one dimension. A traditional method is where, after some filtering, the signal’s differentials are analyzed to find the step like changes in the signal [12]. A major drawback of the method is its sensitivity to the noises. The other method that was used is the Canny edge detection method, which uses the first differential of Gaussian type to approximate the optimal finite length filter [12], [13]. This method gives good result in this case.
Results from five networks were compared, using the MSE and the relative error of the found rising edges in the simulated outputs of the network and the required alarm signals. The comparison of the network can be found in Table III [14].
Graphics Processing Units (GPU) definitely can be used to speed up neural networks. GPU computing is all about leveraging the parallelism in the GPU architecture to perform computing intensive operations [15], [16].
Table III The results
Type of network structure
Regressor of network
Num. of hidden neurons [pieces]
Training dataset
Validation
dataset Test dataset Rel. error
of found RE [%]
Rel. error of found RE [%]
Rel. error of found RE [%]
NNARX ni = 1;
nro = 1
8 68.7 50.0 60.0
10 72.2 80.0 90.0
12 95.2 90.0 90.0
14 96.1 100.0 90.0
16 95.1 90.0 70.0
4. Conclusion
In this paper a method is shown, which is capable to predict hydrate growth in time.
The method is based on neural network with recurring architecture. Using the results, some experimental data sets were generated for training, validation and test purposes of neural networks. Five networks were trained and their results compared to acquire accurate, usable alarm signals in wide parameter range. For comparison, the found rising edges of the signal were investigated with success besides the well-known MSE value.
Acknowledgements
The research was carried out in the framework of the GINOP-2.3.2-15-2016-00010
‘Development of enhanced engineering methods with the aim at utilization of subterranean energy resources’ project in the framework of the Széchenyi 2020 Plan, funded by the European Union, co-financed by the European Structural and Investment Funds.
The described article/presentation/study was carried out as part of the EFOP-3.6.1- 16-2016-00011 ‘Younger and Renewing University - Innovative Knowledge City - institutional development of the University of Miskolc aiming at intelligent specialization’ project implemented in the framework of the Szechenyi 2020 program.
The realization of this project is supported by the European Union, co-financed by the European Social Fund.
Open Access statement
This is an open-access article distributed under the terms of the Creative Commons Attribution 4.0 International License (https://creativecommons.org/licenses/by/4.0/), which permits unrestricted use, distribution, and reproduction in any medium, provided the original author and source are credited, a link to the CC License is provided, and changes - if any - are indicated. (SID_1)
References
[1] Berecz E.; Balla-Achs M. Gas hydrates, (in Hungarian) Akadémiai Kiadó, Budapest, 1980.
[2] Hammerschmidt E. G. Formation of gas hydrates in natural gas transmission lines, Ind.
Eng. Chem. Vol. 26, No. 8, 1934, pp. 851‒585.
[3] Kelland M. A. History of the development of low dosage hydrate inhibitors, Energy Fuels, Vol. 20, No. 3, 2006, pp. 825–847.
[4] Boxall J., May E. Formation of gas hydrate blockages in under-inhibited conditions, Proceeding of the 7th International Conference on Gas Hydrates, Vol. 3, Edinburgh, UK, 17-21 July 2011, pp. 2243‒2248.
[5] Bölkény I., Konyha J., Jónap K., Vörös Cs. Hydration inhibiting technologies, results and future opportunities based on the measurements and projects of the last 15 years (in Hungarian), Műszaki Földtudományi Közlemények, Vol. 85, No. 1, 2015, pp. 30‒40.
[6] Vörös Cs., Füvesi V., Pintér Á.: Design of a new chemical injection pump system, Proc. of Factory Automation Conference, University of Pannon, Veszprém, Hungary, 21-22 May 2013, pp. 124–127.
[7] Neelekantan P., Reddy A. R. M. Decentralized load balancing in distributed systems, Pollack Periodica, Vol. 9, No. 2, 2014, pp. 15–28.
[8] Bakó L., Brassai S. T. Embedded neural controllers based on spiking neuron models, Pollack Periodica, Vol. 4, No. 3, 2009, pp. 143–154.
[9] Norgaard M., Ravn O, Hansen L. K., Poulsen N. K. The NNSYSID toolbox - A MATLAB toolbox for system identification with neural network, Proceedings of the 1996 IEEE International Symposium on Computer-Aided Control System Design, Dearborn, MI, 15-18 September 1996, pp. 374‒379.
[10] Norgaard M., Ravn O., Poulsen N. K., Hansen L. K. Neural networks for modeling and control of dynamic systems, Springer-Verlag, London, UK, 2000.
[11] Bölkény I., Füvesi V. AI based predictive detection system, Pollack Periodica, Vol. 13, No. 2, 2018, pp. 137–146.
[12] Füvesi V., Kovács E. Separation of faults of eletromechanical drive chain using artificial intelligence methods, 18th Building Services, Mechanical and Building Industry days Int.
Conf, Debrecen, Hungary, 11-12 October 2012, pp. 19‒27.
[13] Canny J. A computational approach to edge detection, IEEE Trans. Pattern Anal. Mach.
Intell, Vol. 8, No. 6, 1986, pp. 679‒698.
[14] Bölkény I., Füvesi V. Modeling and detection of gas hydrate appearance, Proceedings of the 17th International Carpathian Control Conference, Tatranska, Lomnica, Szlovákia, 29 May - 1 June 2016, pp. 86‒90.
[15] Konyha J., Bányai T. Approach to accelerate algorithms to solve logistic problems with GPGPU, Advanced Logistic Systems, Vol. 10, No. 2, 2016, pp. 5‒10.
[16] Konyha J., Bányai T. Sensor networks for smart manufacturing processes, Solid State Phenomena, Vol. 261, 2017, pp. 456‒462.

![Table III The results Type of network structure Regressor of network Num. of hidden neurons [pieces] Training dataset Validation](https://thumb-eu.123doks.com/thumbv2/9dokorg/775346.35090/6.892.177.655.349.523/results-network-structure-regressor-network-neurons-training-validation.webp)
