Journal Pre-proofs
Full Length Article
Sensor Surface via Inspiration from Nature: The Specific Case of Electron Trapping in TiO2/WO3(∙0.33H2O) and Reaction Center/WO3(∙0.33H2O) Sys- tems
Bíborka Boga, István Székely, Monica Focșan, Monica Baia, Tibor Szabó, László Nagy, Zsolt Pap
PII: S0169-4332(21)02195-4
DOI: https://doi.org/10.1016/j.apsusc.2021.151139
Reference: APSUSC 151139
To appear in: Applied Surface Science Received Date: 10 June 2021
Revised Date: 18 August 2021 Accepted Date: 29 August 2021
Please cite this article as: B. Boga, I. Székely, M. Focșan, M. Baia, T. Szabó, L. Nagy, Z. Pap, Sensor Surface via Inspiration from Nature: The Specific Case of Electron Trapping in TiO2/WO3(∙0.33H2O) and Reaction Center/WO3(∙0.33H2O) Systems, Applied Surface Science (2021), doi: https://doi.org/10.1016/j.apsusc.
2021.151139
This is a PDF file of an article that has undergone enhancements after acceptance, such as the addition of a cover page and metadata, and formatting for readability, but it is not yet the definitive version of record. This version will undergo additional copyediting, typesetting and review before it is published in its final form, but we are providing this version to give early visibility of the article. Please note that, during the production process, errors may be discovered which could affect the content, and all legal disclaimers that apply to the journal pertain.
© 2021 Published by Elsevier B.V.
Sensor Surface via Inspiration from Nature: The Specific Case of Electron Trapping in TiO
2/WO
3(
∙0.33H
2O) and Reaction
Center/WO
3(
∙0.33H
2O) Systems
Bíborka Bogaa, István Székelyb,c,d, Monica Focșane, Monica Baiab, Tibor Szabóf,g, László Nagyf and Zsolt Papc, d, g *
aFaculty of Chemistry and Chemical Engineering, Babeș-Bolyai University, Arany János 11, Cluj-Napoca, 400028, Romania
b Faculty of Physics, Babeș-Bolyai University, Mihail Kogălniceanu 1, Cluj-Napoca,400084, Romania
cNanostructured Materials and Bio-Nano-Interfaces Center, Institute for Interdisciplinary Research on Bio- Nano-Sciences, Treboniu Laurian 42, Cluj-Napoca, 400271, Romania
dInstitute for Research, Development and Innovation in Applied Natural Sciences, Babeș-Bolyai University, Fântânele 30, Cluj-Napoca, 400294, Romania
e Nanobiophotonics and Laser Microspectroscopy Center, Interdisciplinary Research Institute on Bio-Nano- Sciences, Babes-Bolyai University, Treboniu Laurean 42, Cluj-Napoca 400271, Romania
f University of Szeged, Department of Medical Physics and Biophysics, Rerrich Béla tér 1, Szeged, 6720, Hungary
gIsotope Climatology and Environmental Research Centre, Institute for Nuclear Research, Hungarian Academy of Sciences, Bem tér 18/c, Debrecen, 4026, Hungary
hFaculty of Science and Informatics, Department of Applied and Environmental Chemistry, University of Szeged, Rerrich Béla tér 1, HU-6720, Szeged, Hungary
*Corresponding author. Institute for Interdisciplinary Research on Bio-Nano-Sciences, Babeș-Bolyai University &
Department of Applied and Environmental Chemistry, University of Szeged E-mail address: zsolt.pap@ubbcluj.ro; pzsolt@chem.u-szeged.hu
Abstract
In this work, reaction centers (RCs) isolated from Rhodobacter sphaeroides purple bacteria was coupled with WO3(∙0.33H2O) via physical adsorption, where vectorial electron transfer (from RCs towards the inorganic carrier) was demonstrated using flash kinetics and photoluminescence measurements. The efficiency of the interaction between RCs and WO3(∙0.33H2O) was correlated to the components’ surface charge at the working pH and the structural/morphological and surface properties of the inorganic carrier (e.g., anchoring capacity assured by H-O, W=O bonds). The role of WO3(∙0.33H2O) as final electron trap and charge separator was proven not only in RCs/WO3(∙0.33H2O) biohybrid systems but also in TiO2/WO3(∙0.33H2O) composites. The charge transfer in the inorganic composites was evaluated by monitoring the reverse process of the color reaction (W5+ → W6+) via diffuse reflectance spectroscopy (DRS) after a previous UV-A (320- 400 nm) exposure. The efficiency of the charge transfer process in inorganic systems was correlated to the initial W5+ content of WO3(∙0.33H2O), followed by the photocatalytic efficiency evaluation of these inorganic composites under UV-A irradiation.
Keywords: reaction center, hydrated tungsten trioxide, titania tungsten oxide composite, biohybrid, charge transfer, flash kinetics
Abbreviations
BChl – Bacteriochlorophyll; BPheo – bacteriopheophytine; CB – conduction band; CNT – carbon nanotubes; ΔEg – band gap; FC – final complex; IEP – isoelectric point; ITO – indium tin oxide;
k - apparent rate constant; LDAO – N, N-dimethyl-dodecyl amine-sulphate; MO – methyl orange;
n- reaction order; OA – oxalic acid; P – dimer bacteriochlorophyll; P25 – commercial TiO2; RC – photosynthetic reaction center; SP – supernatant, TRIS – 2-amino-2-hydroxymethyl-propane-1,3- diol; VB – valance band; X - conversion
1. Introduction
The integration of biological components exploiting unique peculiarities and properly engineered structures has led to creating specific structures such as bio-hybrid actuators and bio- hybrid sensors, contributing significantly to a sustainable development [1-2]. Among the great variety of biological systems, photosynthetic reaction center proteins (RCs) have received considerable attention from the scientific community due to their broad applicability in nano- bionics, optoelectronics, photonics, photovoltaics given by their high sensibility, selectivity, and high quantum yield [3]. RCs are transmembrane proteins with significant pigments and cofactors situated in the photosynthetic membrane of autotroph organisms (plants, some bacteria, and algae) [4]. Even if solar cell technology is a considerable application field of RCs because of their high quantum yield [3] (thus providing a solution for exhausting energy resources), their ‘natural role’
is related to the conversion of light into chemical energy, consequently contributing to food production [5].
Bacterial RCs are characterized with significantly lower structural complexity than the corresponding redox proteins from plants; thus, integrating bacterial RCs into different devices has remained a more attractive option. The unique peculiarities of bacterial RCs are assigned to the cofactors (bacteriochlorophyll – BChl; bacteriopheophytine – BPheo; ubiquinone 10 – QA, QB, non-heme type Fe2+) within the protein. Light absorption induces vectorial electron transfer from the primary donor (P, dimer bacteriochlorophyll) to the secondary quinone (QB) through the formation of charge-separated species (e.g., P+BPheo―, P+QA―, P+QB―), followed by charge stabilization [6].
Even if these Nature’s creations manifest unique properties, their stability issues can be considered a bottleneck in their application. To overcome this limitation, RCs were coupled with several inorganic carriers, namely TiO2/WO3 [7], ITO [8], Si [6], CNT [9], either by electrostatic adsorption or covalent binding [10], thus improving the stability of the whole biohybrid system.
Among the coupling methods, adsorption is considered the simplest one [11]. However, its efficiency is doubtful since the protein structure could change its initial conformation [12]. Even if the possibility of conformation change exists, several cases were reported when the functionality of RCs remained unaffected [12] after bringing it in contact with Au [13], ITO [8]. Beyond conformation change, another vital issue in the case of adsorption is related to the surface charge
of components at the working pH, so the assessment of the isoelectric point (IEP) of components (e.g., , IEPRC-R26 =6.1 [14]) is essential. .
WO3 can be considered one of the most promising inorganic carriers for RCs due to its charge separation capacity and efficient electron acceptor in different composite systems. The conditions regarding the charge transfer from the RCs to WO3(·0.33H2O) are also fulfilled: (i) its relatively high midpoint potential ensures the spontaneity of electron transfer from the redox protein to WO3 [15-16], (ii) the energy of the generated holes on its valence band is relatively low, so there is no possibility for oxidizing the protein by the semiconductor [17]. Considering the aforementioned issues, the interaction between RCs and WO3(·0.33H2O) was investigated within this work.
Mimicking the interaction of nature’s creation (RCs) based biohybrid systems could be considered an efficient way to create certain sustainable systems. Several questions can be voiced within this topic: What would happen if an inorganic component would replace the previously described biological component of the biohybrid system? Which are the main criteria which should be fulfilled in order to have a similar operating principle? The answer lies mainly in the previously mentioned energetic criteria. Coupling of WO3 with TiO2 – in a well-determined ratio, using the corresponding method of preparation – either physical mixing [18] or pH adjustment corresponding to the surface charge of the components of the composite [19] is considered as an efficient way to prepare composites with great sensorial and photocatalytic efficiency (in certain cases, such as phenol, methyl-orange) [20-21]. According to Lee and coworkers, the excitation of TiO2/WO3 composites triggers the following steps [22]: (i) the excitation of semiconductors and the formation of charge carriers, (ii) charge-transfer (WO3 (h+, e-) / TiO2 (h+, e-) → WO3 (e-) / TiO2 (h+)), (iii) re-oxidation of W5+ to W6+ due to the involvement of molecular O2. The degradation of pollutants could be realized either by indirect mechanism (involving reactive intermediates, such as ·OH, ·O2-) or direct hole oxidation [22].
The joint key component of the previously described biohybrid (RCs-based) and inorganic systems (TiO2-based) is WO3 because of its high affinity towards electrons (expressed by the terms of positive reduction potential) [23] and efficient charge separation capacity [18]. Tungsten trioxide has four well-known crystal phases: monoclinic, tetragonal, triclinic, and orthorhombic [20]. While the most common obtained crystal phase is monoclinic, the formation of thermodynamically unfavored crystal phases can be facilitated via shaping agents (e.g., NaCl [24],
K2SO4 [25]). The synthesis of partially hydrated crystals (WO3·nH2O, where n is either 0.33 or 0.50) with enhanced gas-sensing properties has also been reported, where the adjustment of hydration level is correlated to the precursor’ concentration [26].
Although some RCs based biohybrid systems were investigated previously as described before), no relevant study focused on RCs/WO3(·0.33H2O) composites; thus, this paper will offer a significant insight into this topic. Inspired by RCs/WO3(·0.33H2O) biohybrid systems, the development of TiO2/WO3(·0.33H2O) inorganic systems with excellent sensorial properties will be presented within this paper.
2. Experimental 2.1. Materials
The synthesis of differently shaped WO3 was carried out using: sodium chloride (NaCl, NORDCHIM, 99.5%), sodium tungstate dihydrate (Na2WO4 ∙2H2O, Sigma Aldrich, 99%), HCl (hydrochloric acid, NORDCHIM, 37%, 12 M), ammonium metatungstate hydrate (AMT, (NH4)6H2W12O40·xH2O, Sigma Aldrich, 99.99%).
Evonik Aeroxide P25 (Commercial TiO2, Sigma Aldrich) was used to prepare TiO2/WO3 and TiO2/WO3·0.33H2O composites. The photocatalytic efficiency of TiO2/WO3 (·0.33H2O) composites was evaluated by the removal of oxalic acid (OA, HO2C-CO2H∙2H2O, Sigma Aldrich, 98 %) and of methyl-orange (MO, C14H14N3NaO3S, Sigma Aldrich) from aqueous solutions.
Chemicals used during isolation of the protein complex were N-dodecyl-N, N- dimethylamine oxide (LDAO, C14H31NO, Fluka), ammonium sulfate ((NH4)2SO4, Sigma), diethylaminoethyl cellulose (DEAE-Sephacell, Sigma Aldrich).
The preparation of RC/WO3(·0.33H2O) biocomposites (reagents for the dialysis and further washing steps) involved the following chemicals: 2-amino 2-hydroxymethyl propane-1,3-diol (TRIS, NH2C(CH2OH)3, Aldrich), citric acid (C6H8O7, VWR Chemicals), trisodium citrate dihydrate (C6H5O7Na3·2H2O, Chempur, analytical purity), Triton X-100 (C14H22O, Serva Feinbiochemica), polysucrose 400 (MP Biomedicals, LLC). The pH adjustment of buffer solutions (TRIS buffer at pH=8 and citrate buffer at pH=4) was realized either by the aqueous solution of NaOH (BioXtra, >98%) or HCl (hydrochloric acid, NORDCHIM, 37%, 12 M).
2.2. Synthesis of WO3 (·0.33 H2O) crystals
3.29 g Na2WO4·2H2O and 1.16 g NaCl were dissolved in 75 mL distilled water to obtain partially hydrated crystals (WO3·0.33H2O). The pH was adjusted to pH=2 by 3 M HCl under constant stirring and was followed by 24 hours of homogenization. Hydrothermal crystallization was carried out at 180 °C for 24 hours. It was followed by a washing step (centrifugal washing at 5000 rpm, 10 minutes), which facilitated the removal of undesired compounds. The obtained product was dried at 40 °C for 24 hours [20].
0.768 g (NH4)6H2W12O40·xH2O was dissolved in 12.5 mL 5 M HCl solution under continuous stirring for 15 min. The mixture was hydrothermally treated at 180 °C (4 h) and washed with water via centrifugation (3×10 min, 1600 rpm). The product was dried (80 °C, 12 hours) and thermally treated at 500 °C (30 min) in order to obtain an anhydrous crystal with a thermodynamically favored crystal phase (WO3).
2.3. Preparation of TiO2/WO3(·0.33 H2O) composites
The aqueous suspension of 760 mg TiO2 (P25) and 240 mg WO3 (WO3, respectively WO3·0.33H2O) (with a final volume of 50 mL) was stirred 4 hours at 500 rpm in order to achieve a stable pH and a homogeneous suspension, followed by drying at 80 °C, 12 hours [27].
2.4. Isolation of RC
The isolation of RC from Rhodobacter sphaeroides R26 – as described previously by P.
Maróti and C. A. Wraight [28] – was performed by a classical biochemical procedure that involves ultrasonic cell disruption, separation by (ultra)centrifugation, solubilization in LDAO, precipitation with ammonium sulfate, dialysis, fine purification by ion-exchange chromatography (DEAE Sephacell). The solubilized and purified protein complex has been stored at -20 °C.
2.5. The preparation of biocomposites
The mixture of an aqueous suspension of WO3(·0.33H2O) (350 μL, 1 g·L-1) and RC (150 μL, 62 μΜ RC solubilized in LDAO) was dialyzed in the corresponding buffer solution (either in 10 mM TRIS 100 mM NaCl buffer for pH=8 or 20 mM citric acid/citrate buffer for pH=4) during constant stirring at 4 °C, 24 h. While removing ionic detergent (LDAO) was achieved through the semipermeable membrane during successive dialysis, the unbounded RCs were removed by
washing and centrifugation steps (adding 250 µL TRIS/citrate buffer with 0.03% Triton).
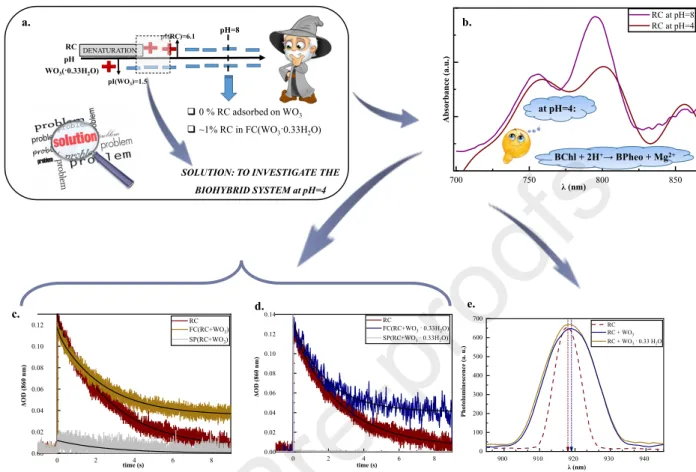
Polysucrose 400 was added to the final complexes (at pH=4) to reduce the particles' sedimentation rate. The main steps of biocomposites’ preparation are also presented in Fig. 3.a.
2.6. Apparatus
Scanning Electron Microscopy (SEM) was employed for the morphological and dimensional analysis of the studied sample. The measurements were carried out on a FEI Quanta 3D FEG microscope with 25 kV accelerating voltage.
The identification of the crystalline structure was accomplished by X-ray powder diffraction method (XRD) at a fixed wavelength (λfixed=1.5406 Å insured by Cu-Kα source) and in the range of the incident angle values between 10-50° (2θ°). The diffractometer (Rigaku Miniflex) was operated at 40 kV (tube voltage) and 30 mA (tube current) [29].
A Jasco-V650 spectrophotometer recorded the reflectance spectra (DRS) of the semiconductor oxides in the UV-Visible (250-1000 nm) region. The optical signal transformation into an electrical one was realized by an integration sphere (ILV-724). The device was applied in the determination of the band-gap values and monitorization of the W5+/ W6+ species.
FT-IR and Raman spectroscopy were employed to determine the specific vibrational bands present in the structure of semiconductor oxides. The IR spectra of the studied samples (prepared previously in the form of pellets with KBr) were recorded at room temperature, in the range of 400-4000 cm-1, by Jasco 6000 (Tokyo, Japan) spectrometer. Raman spectra of the samples were recorded with a multilaser confocal Renishaw inVia Reflex Raman spectrometer equipped with a RenCam CCD detector. The 532 nm laser was applied as an excitation source. The Raman spectra were collected using a 0.9 NA objective of 100× magnification. The integration time was 30 seconds, 1800 lines/mm grating for all spectra, and 10% of the maximum laser intensity – laser power of 20 mW. The spectral resolution was 4 cm-1.
Flash-induced absorption change measurements were performed by a locally designed single beam kinetics spectrophotometer described previously by J. Tandori [30]. The absorption change could not be measured by continuous light due to the reversibility of charge recombination, so the studied sample was exposed to successive saturation flashes. The time interval between two successive flashes was set at 60 s. The specific measurement parameters were: I0 = 100 mV, amplification: 100).
The absorption spectra of RC (in an equilibrium state and after excitation at λ excitation = 808 nm) in the range of 480-900 nm was recorded via a home-made Vis-NIR experimental setup equipped with a white light of DHL2000 light source as measuring light and CCD detector of a spectrophotometer (both from Avantes) and with a laser diode (2 W, 808 nm, Roithner). The details regarding this experimental setup were already described [31].
Fluorescence emission measurements were carried out by employing a Jasco FP-8600 High Sensitivity NIR spectrofluorometer with 1 nm spectral resolution and 10 nm excitation and emission bandwidths. The excitation source was assigned by a Xenon arc lamp as a light source, employing a fixed excitation wavelength at 850 nm, recording the spectra in the range of 860-1000 nm.
The photocatalytic reactions were carried out under UV-A irradiation (assured by 6 × 60 W fluorescence lamps with λ maxemission = 365 nm) for 2 hours, under continuous stirring. The photocatalytic efficiency of TiO2/WO3(·0.33H2O) composites (c suspension = 1 g∙L-1) was tested in oxalic acid (C0, OA = 3 mM) and methyl orange (C0, MO = 125 μM) solutions. While the Jasco V- 650 spectrophotometer has assured the qualitative analysis (at λ = 513 nm) of the MO degradation, the detection of OA was done by High-Performance Liquid Chromatography (HPLC) at λ = 206 nm. While the mobile phase was 0.06% aqueous solution of H2SO4 (with a flowrate of 0.8 mL·min-1), the stationary phase was a C16 column set up with Grom Resin ZH- type load. Merck-Hitachi D-7000 chromatograph and L-4250 UV-Vis detector are some important constitutive elements of HPLC.
3. Results and Discussion
3.1. Morphological/structural and optical characterization of WO3 crystals used for the sensor
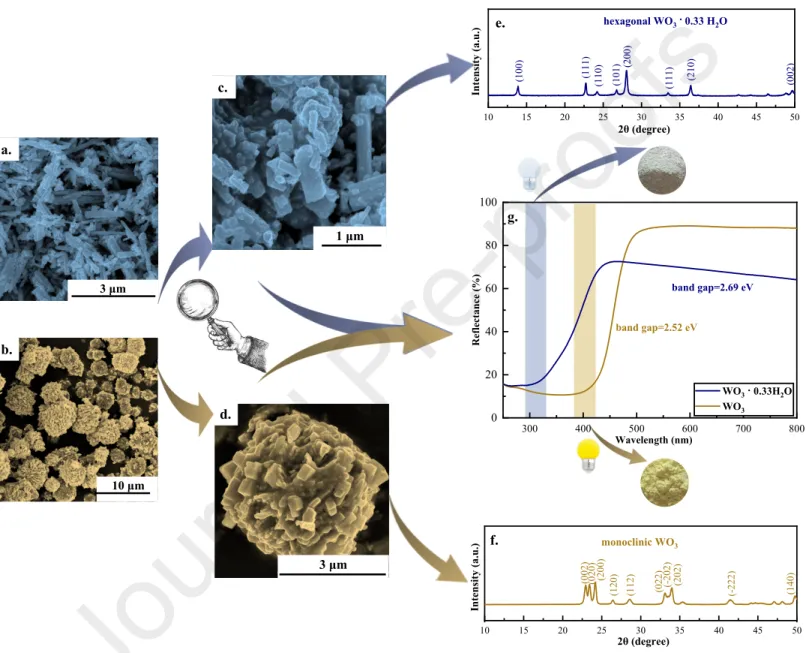
Analyzing the SEM micrographs, hierarchical structures of fiber-like (Fig. 1.a-b, WO3·0.33H2O) and star-like (Fig. 1.c-d, WO3) crystals were identified. While the diameter of hierarchical stars (WO3) was 3.5-4.0 μm, the length of microfibers (WO3·0.33H2O) varied between 2.5 and3.0 μm [20]. Taking a closer look, it can be observed that 10-15 nm thick nanowires were the building elements of the microfibers, which finally formed the microstar-like morphology. The morphology tailoring of WO3(·0.33H2O) was assured by the combined effect of the precursor structure and working pH, which induced also the chemical transformation of the precursor (W12O4110--+10H+→12WO3+5H2O) [32]. It should be also mentioned that the synthesis procedure (temperature conditions, duration) also affected the morphology. However, some of the applied steps, such as the final thermal treatment (annealing), impacted the the ratio of the structurally intercalated water molecules. In contrast to the previous case, a ‘capping agent’ was added during the synthesis, which contributed to the preferential growth of the crystals alongside specific crystallographic directions, resulting finally nanofibers (showing 40-50 nm individual diameter) which self-assembled into bundles. The protons' contribution was also important as the following reactions shows: WO42-+2H+ → H2WO4 → WO3+H2O. To sum up, even if the building blocks of these hierarchical structures were nanofibers in both cases, it can be highlighted that the diameter of nanofibers was 3-4 times larger in the case of partially hydrated crystals than in the case of star- like particles [33].
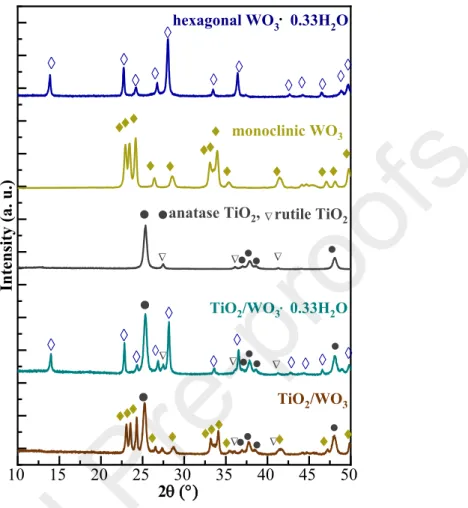
Diffractograms of the WO3 and WO3·0.33H2O samples were recorded between 10- 50°angles to identify the crystal phase composition and calculate the primary mean crystallite size values (Fig. 1. e-f). Analyzing the reflections of WO3·0.33H2O sample – the characteristic 2θ positions were attributed to the following crystallographic planes: 13.88 (100), 22.74(111), 24.26 (110), 26.76 (101), 28.06 (200), 33.46 (111), 36.42 (210), 42.70 (300) and 49.66 (002) (JCPDS No. 33-1387).
10 15 20 25 30 35 40 45 50
(002)
(210)
(111)
hexagonal WO3 . 0.33 H2O
(200)(101)
(110)(111)
(100)
Intensity (a.u.)
2θ (degree)
3 μm 10 μm
1 μm
3 μm a.
b.
c.
d.
e.
f.
g.
10 15 20 25 30 35 40 45 50
(140)
(-222)
(200)(020) (120) (112)
(002) (202)(-202)(022)
Intensity (a.u.)
2θ (degree) monoclinic WO3
300 400 500 600 700 800
0 20 40 60 80 100
band gap=2.69 eV
Reflectance (%)
Wavelength (nm)
WO3 · 0.33H2O
WO3
band gap=2.52 eV
Fig. 1. (a-d) SEM micrographs, (e-f) XRD patterns, (g) DRS spectra of WO3·0.33H2O and WO3
The primary crystallite size was ≈45 nm; however, a high aspect ratio difference (fiber-like structure) induces a significant error margin to the obtained value. The XRD pattern of TiO2/WO3·0.33H2O composite was also recorded (Appendices, Fig. A1.) and the characteristic reflections of phases (hexagonal WO3·0.33H2O, anatase and rutile TiO2: JCPDS No. 84-1286 and No. 88-1175) were identified.
In the case of star-like crystals, the characteristic reflections (2θ°) were identified (JCPDS 97-001-6080) as follows: 22.94 (002), 23.46 (020), 24.16 (200), 26.44 (120), 28.52 (-112), 33.10 (222), 33.52 (-202), 33.98 (202), 41.48 (-222) and 49.76 (140). The characteristic dimension of the building blocks of microstars (diameter of fibers) determined from XRD was ≈20 nm with the same considerations. In a similar way, the coexistence of phases (monoclinic WO3, anatase and rutile TiO2: JCPDS No. 84-1286 and No. 88-1175) was proved in TiO2/WO3 system via XRD, presented in Fig. A1. (Appendices).
While the thermodynamically favored crystal phase – monoclinic – was identified in the case of star-like crystals [32], the arrangement of atoms into hexagonal crystal lattice [34] was facilitated by the shaping agent [20] in the case of fiber-like crystals. The Kubelka-Munk function was applied in order to determine the necessary energy for the translocation of an electron from the VB to CB (WO3 2.52 eV→ λ = 550 nm, WO3·0.33H2O: 2.69 eV → λ = 461 nm) (Fig. 1.g).
The lower band gap value was observed in the case of the WO3 sample [20].
3.2. Detailed structural analysis of WO3
3.2.1. Raman spectroscopy
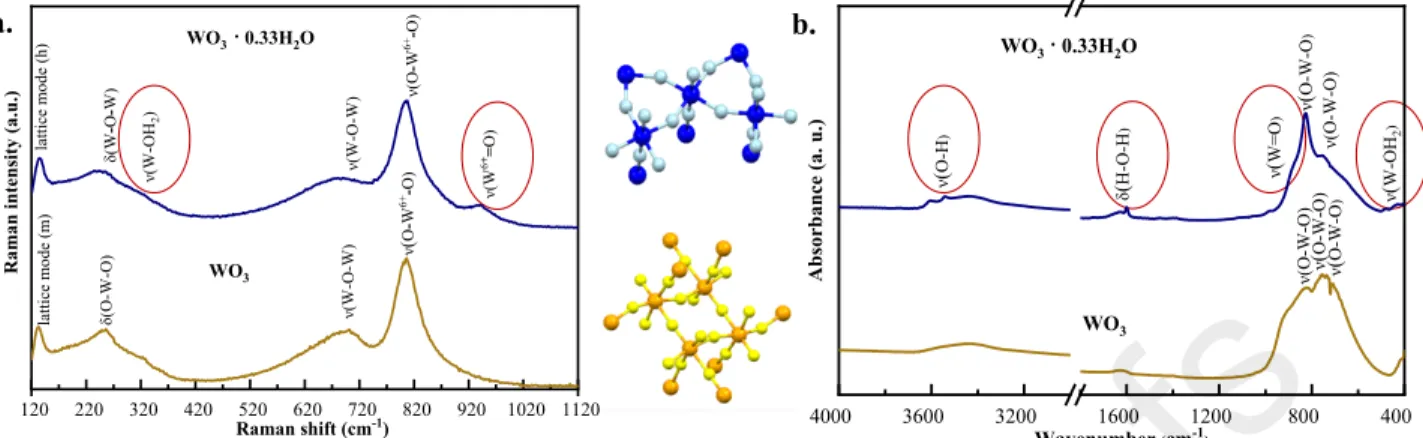
The characteristic bands were identified at 136, 244, 324, 682, 806, 941 cm-1 (WO3·0.33H2O), respectively at 132, 256, 701 and 806 cm-1 (WO3) in the recorded spectra (Fig.
2.a). While the vibrational band situated at 136 cm-1 (WO3·0.33H2O) was assigned to lattice mode vibrations of the hexagonal partially hydrated crystal, the monoclinic lattice signal was evidenced at 132 cm-1 in the case of WO3 crystals [35].
There were some well-defined differences between the two spectra. First of all, in the case of partially hydrated crystals, a relatively narrow band at 244 cm-1 corresponding to W-O-W bending vibrations of the bridging oxygen [36] and a low-intensity shoulder at 324 cm-1 could be identified as the specific band of W-OH2 stretching vibrations mode [37]. In the case of WO3, a
characteristic band identified in the neighborhood of the monoclinic lattice vibration (at 256 cm-1) was assigned to O-W-O bending vibrations [27,38].
In the case of WO3·0.33H2O, two relatively broad bands were identified at 682 cm-1 and 806 cm-1 that are characteristic signals for W-O-W and O-W-O stretching vibrations [39], the band situated at 682 cm-1 being also significant evidence for hexagonal semiconductor-oxide [40]. Two successive bands could be identified in star-like crystals: the highest intensity band (at 807 cm-1) corresponded to the O-W-O stretching vibrations [37], while the characteristic signal at 701 cm-1 was assigned to W-O-W stretching modes. The characteristic band situated at 941 cm-1 was attributed to the symmetric stretching vibration of the terminal W=O bonds [41,42], which assures the anchoring capacity of WO3·0.33H2O crystals.
Considering that the band situated at 695-700 cm-1 was also assigned to specific stretching vibrations in W2O6, and W3O8 [35,43], the presence of W2O6 and W3O8 on the surface of the studied semiconductor-oxide could be demonstrated by analyzing this band. In order to highlight the differences given by the content of WxOy (x1=2, y1=6; x2=3, y2=8) on the surface of WO3(·0.33H2O), the ratio between the intensities of the two successive bands (700, 800±20cm-1) was evaluated. While the ratio (I682/I806) was 0.47 in the case of partially hydrated crystals, this ratio showed a lower value in monoclinic crystals: I701/I806 =0.30. The significantly higher ratio in the sample WO3·0.33H2O highlights the presence of W2O6 and W3O8 on its surface [43].
3.2.2. IR spectroscopy
While active vibrations in Raman spectroscopy are related to the polarizability changes, the active vibrations are associated with the dipole moment in IR spectroscopy. Analyzing the FT- IR spectra of the semiconductor oxides (Fig. 2.b), the characteristic vibrational bands corresponding to the stretching vibration of O-W-O bonds (WO3·0.33H2O [44-45]: 755 and 826 cm-1, WO3 [27]: 823, 745 and 689 cm-1) were identified. The relatively broad band assigned to the O-H stretching vibrations (3000-3500 cm-1) [46], the H-O-H bending band (at 1600 cm-1), and the O-H bending band (at 1634 cm-1) were direct evidence for the presence of WO3·0.33H2O. The anchoring capacity of WO3·0.33H2O was highlighted by the presence of a shoulder corresponding to W=O stretching modes (at 964 cm-1) with a relatively weak intensity [47]. The band corresponding to W-OH2 stretching mode (at 429 cm-1) was also identified in the case of WO3·0.33H2O [37].
a. b.
120 220 320 420 520 620 720 820 920 1020 1120
ν(W-O-W)
ν(W-OH2) ν(W-O-W)
δ(O-W-O) ν(O-W6+-O)
lattice mode (m)lattice mode (h) δ(W-O-W) ν(O-W6+-O)
WO3
Raman intensity (a.u.)
Raman shift (cm-1) WO3· 0.33H2O
ν(W6+=O)
4000 3600 3200 1600 1200 800 400
WO3
WO3· 0.33H2O
ν(W-OH2)
ν(O-W-O)ν(O-W-O)
δ(H-O-H) ν(W=O) ν(O-W-O)ν(O-W-O)ν(O-W-O)
ν(O-H)
Absorbance (a. u.)
Wavenumber (cm-1)
Fig. 2. (a) Raman and (b) IR spectra of partially hydrated and anhydrous WO3
3.3. Inspiring from RCs coupled with WO3 (·0.33H2O)
The excitation of RC (in fact of the primary donor - P) can be realized through the absorption of photons whose energy is equal to the excitation energy of either cofactor in the visible range (BPheo: 525 and 760 nm; P and BChl: 600 nm, BChl: 800 nm, P:860 nm) because the characteristic absorption band of P is situated at 860 nm [48]. According to Fig. 3.b, the functionality of P was tested through its excitation via a monochromatic diode (λemission=808 nm).
As a result of excitation, P+ is formed, which induces the disappearance of the characteristic absorption band of P (λ=860 nm).
As mentioned in the introduction, coupling RC with different inorganic carriers is a promising way to enhance this redox protein's stability. WO3(·0.33H2O) could be considered as an efficient inorganic carrier in RC/WO3(·0.33H2O) biohybrid systems, due to:
(i) its relatively high midpoint potential, which ensures the spontaneity of electron transfer from the redox protein to WO3 (Em (WO3) = 1.25 eV [49]) > Em (QA,QB) = - 0.17 eV [50]),
(ii) the energy of the generated holes on its valence band is relatively low, so there is no possibility for oxidizing the protein complex by the holes of the semiconductor [17],
(iii) its absorption threshold is located near the visible range [20].
Hexagonal partially hydrated and monoclinic star-like WO3 semiconductors were coupled with RC (as described previously in the ‘Materials and methods’ part and presented in Fig. 3.a) to investigate the as-obtained binary systems. While the partially hydrated WO3 crystal was chosen due to its anchoring capacity (adsorption) assigned to the presence of W=O and O-H bonds on the surface of semiconductors (IR spectra, [51-52]), the star-like shaped WO3 crystal was investigated
for the reason that it has contributed to the enhancement of photocatalytic efficiency of P25 in some cases [21].
3.3.1. Flash kinetics measurements
Relevant information about the redox state of the primary electron donor is obtained from flash-induced absorption kinetics measurements performed at its specific absorption band (860 nm) in the case of different fractions prepared at pH=4 and pH=8 [53]. Because of the pH dependence of free energy difference between P+QAQB― and P+QA―QBstates (ΔGAB), the interpretation of the kinetic parameters (in terms of time constants and amplitudes) will be carried out separately at different pH values.
Furthermore, the amount of QB bounded to the RC can be influenced by varying the surfactant concentration, which is also highlighted by the value of the kinetic parameters [54].
Taking into consideration the fact that the solubility of quinone in a hydrophobic medium is favorable, it is evident that:
(1) when the concentration of the detergent has been increased, the kinetics describing the attachment/detachment it shifts to the direction of detachment; thus, the contribution of a slow component in the absorption decay after flash excitation is decreasing [55];
(2) without the corresponding concentration of LDAO, the quinone ‘is stuck’ on the binding site of QB, resulting in a high contribution and diminishing rate of recombination [55]. In addition, underneath the so-called critical micelle concentration (CMCLDAO=1 mM≈0.02% [56]), the functionality of QB remains constant [55].
The time constant (τ1) corresponding to the recombination of the primary component (P+ ) was fixed on 120 ms (=0.12 s) in both cases (at pH=4 and pH=8), which value allowed QA― → PQA
to evaluate the decay kinetics properly Because of the relatively significant differences in terms of concentrations, the supernatant fraction was diluted 10times at pH=8.
Case 1: The absorption kinetics measurements at pH=8
According to previous studies, considering the effect of relatively reduced surfactant concentration, the kinetics of charge recombination (measured at 860 nm) after a single Xe flash in the case of the reference sample at pH=8 (RC in Tris buffer solution) was described by two exponential terms representing the contribution and lifetime of fast (circa 9-10% and 120 ms) and
slow (circa 88% and 2-2.1 s) components [57].
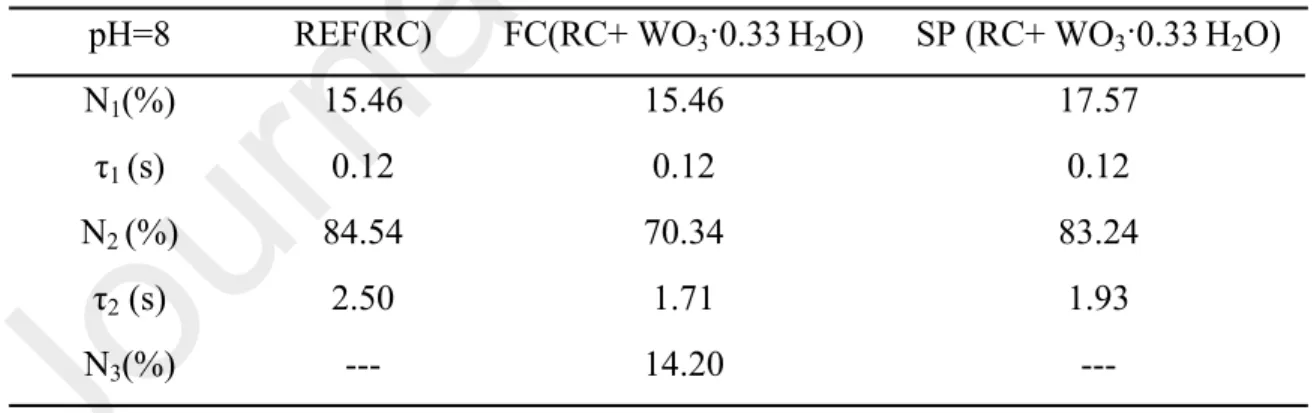
The kinetics was analyzed via three exponential terms fit in the case of final complex fractions (FC), where the third component characterizing with a relatively large time constant (between 30-50 s) indicates the electron trap of a semiconductor oxide. The time constant values were not featured in Tables 1 and 2 because of their different magnitude compared to the time constants of fast and slow components. Not only the presence of the third exponential component (N3 = 14.20% from N total) but also the faster secondary time constant (τ2=1.73 s) were significant evidence for the involvement of WO3 ·0.33 H2O (Table 1, Fig. 3.c).
Besides, taking into consideration the fact that most of the LDAO was removed during the dialysis, but also the fact that only non-ionic detergent (Triton X-100) was added during the washing steps in preparation to remove the unbounded RC, it was expected to obtain high contribution and decreasing rate of recombination.
While the amount of RC attached on the surface of star-like WO3 can be neglected at pH=8, there was a relatively reduced but detectable amount of RC (Van der Waals forces) adsorbed on the surface of partially hydrated semiconductor oxide. According to the previous morphological and structural analysis, this interaction can be attributed to the anchoring capacity of specific bonds (W=O, O-H) situated at the surface of WO3·0.33H2O [51].
Table 1. Fitting parameters of flash induced absorption change measurements at 860 nm (pH=8) pH=8 REF(RC) FC(RC+ WO3·0.33H2O) SP (RC+ WO3·0.33H2O)
N1(%) 15.46 15.46 17.57
τ1 (s) 0.12 0.12 0.12
N2 (%) 84.54 70.34 83.24
τ2 (s) 2.50 1.71 1.93
N3(%) --- 14.20 ---
0 2 4 6 8 0.0
0.2 0.4 0.6 0.8 1.0
Relative absorption change (a. u.)
Time (s) RC
FC(RC+WO3·0.33H2O) SP(RC+WO3·0.33H2O)
https://www.scienova.com/this-is-a-test-2-2/
P
P* P+BPheo-
P+BPheoQA- P+BPheoQAQB-
480 560 640 720 800 880
BPheo
BPheo
P BChl
BChl
P+
Absorbance (a. u.)
λ (nm)
P a.
I. SUCCESIVE DIALYSIS II. REPEATED WASHING STEPS
before after
SP
FC
b. c.
RC+WO3
RC+WO3·0.33H2O WO3·(0.33H2O) LDAO
RC
• FC – final complex
• LDAO – lauryldimethyl-amine oxide
• RC – reaction center
• SP - supernatant
• BChl – bacteriochlorophyll
• BPheo – bacteriopheophytin
• P/P+ - reduced/oxidized form of primary donor (dimer bacteriochlorophyll)
• QA, QB – primary/secondary quinone
Fig. 3. (a) Preparation of biocomposites, (b) Absorption spectra before and after excitation at 803 nm, (c) Flash induced absorption change measurements at 860 nm (pH=8)
Case 2: The absorption kinetics measurements at pH=4
Although the free energy difference has a relatively large absolute value at pH=4 (ΔGAB ≈ -130 meV), its value is relatively low (ΔGAB ≈ -70 meV) and constant when the pH is situated between 6 and 9 [30]. According to this, the reference sample (RCs in citrate/citric acid buffer) at pH=4 was characterized via the corresponding kinetic parameters (Table 2).
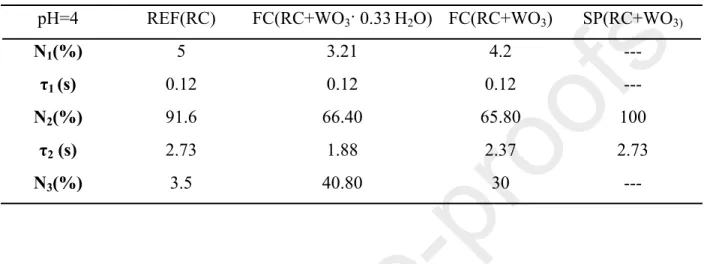
A significant amount of RC was adsorbed on the inorganic carrier at pH = 4 (98% RC in RC/WO3 and ~ 100% RC in RC/WO3·0.33H2O) based on electrostatic interaction (given by different surface charges of the components, Fig. 4.a). The final complex fractions were diluted during the measurements; thus, the concentrations presented in Fig. 4.c-d are diluted concentration
values because of highlighting the differences in kinetic parameters in the case of different fractions (Table 2). Beyond the different surface charges of the components at his pH, pheophytization of a certain amount of P could also be observed in the structure of RC (Fig. 4.b).
Table 2: Fitting parameters of flash induced absorption change measurements at 860 nm (pH = 4) pH=4 REF(RC) FC(RC+WO3· 0.33H2O) FC(RC+WO3) SP(RC+WO3)
N1(%) 5 3.21 4.2 ---
τ1 (s) 0.12 0.12 0.12 ---
N2(%) 91.6 66.40 65.80 100
τ2 (s) 2.73 1.88 2.37 2.73
N3(%) 3.5 40.80 30 ---
To sum up, the relatively short time constant values (τ2) describing the implication of secondary quinone (P+(QA―QB⇌QAQB―) and P+QA―QB⇌ P+QA― + QB) were identified in the case of final complexes (τ2, FC, hydrated, pH=4 = 1.88 s, τ2, FC, hydrated, pH=8 = 1.71 s) (Table 2). Also, in both cases, the contribution of a third component indicated the role of WO3(·0.33H2O) in the studied composites, namely the electron trap.
3.3.2. Emission fluorescence measurements
According to the previous luminescence studies of RCs, emission was observed at 918 nm given by the dimer bacteriochlorophyll (P), as a result of the excitation of RCs at λ = 532 nm [58]. Although the corresponding band of photoluminescence appeared in both cases (RC vs.
biohybrid system) after excitation at λexc = 850 nm, there were some significant differences. First, while the response appeared at 918 nm in the case of RC (Fig. 4.e dotted spectrum), this value was shifted by 1 nm in the case of RC/WO3(·0.33H2O) systems (Fig. 4.e brown spectrum). Besides, the significant broadening of the fluorescence emission band could be ample evidence for additional vibrational bands (implicitly the involvement of an additional component in the electron transfer) in the case of the RC/WO3(·0.33H2O) system.
700 750 800 850
Absorbance (a.u.)
λ (nm)
RC at pH=8 RC at pH=4
900 910 920 930 940
0 100 200 300 400 500 600 700
Photoluminescence (a. u.)
λ (nm) RC RC + WO3 RC + WO3 · 0.33 H2O
BChl + 2H+→ BPheo + Mg2+
at pH=4:
0 2 4 6 8
0.00 0.02 0.04 0.06 0.08 0.10 0.12
ΔOD (860 nm)
time (s)
RC FC(RC+WO3) SP(RC+WO3)
d.
0 2 4 6 8
0.00 0.02 0.04 0.06 0.08 0.10 0.12 0.14
ΔOD (860 nm)
time (s) RC
FC(RC+WO3 · 0.33H2O) SP(RC+WO3 · 0.33H2O)
c.
RC WO3(·0.33H2O)
DENATURATION
pI(RC)=6.1 pH
pI(WO3)=1.5
a.
0 % RC adsorbed on WO3
~1% RC in FC(WO3·0.33H2O) pH=8
SOLUTION: TO INVESTIGATE THE BIOHYBRID SYSTEM at pH=4
b.
e.
Fig. 4. (a) The surface charges of biohybrid system’s components, (b) The absorption spectra of RC at different pH values, (c)-(d) Flash kinetics measurements of biohybrid system at 860 nm (pH=4), (e) Photoluminescence of different fraction
3.4. Charge transfer in TiO2/WO3(·0.33H2O) composites
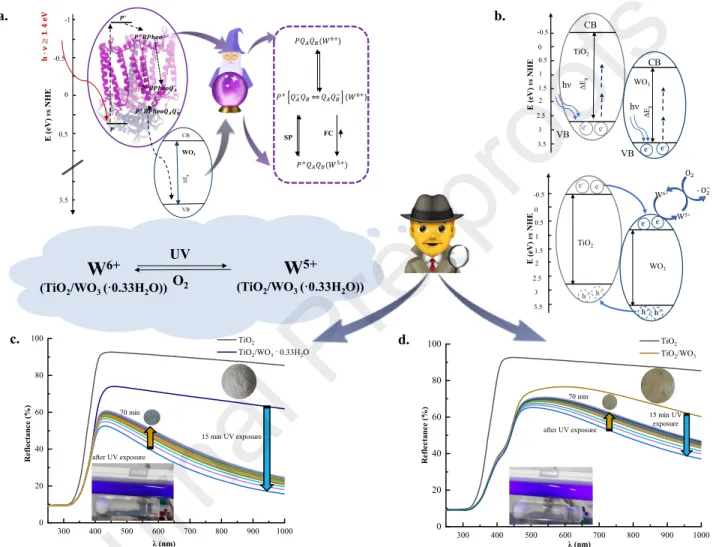
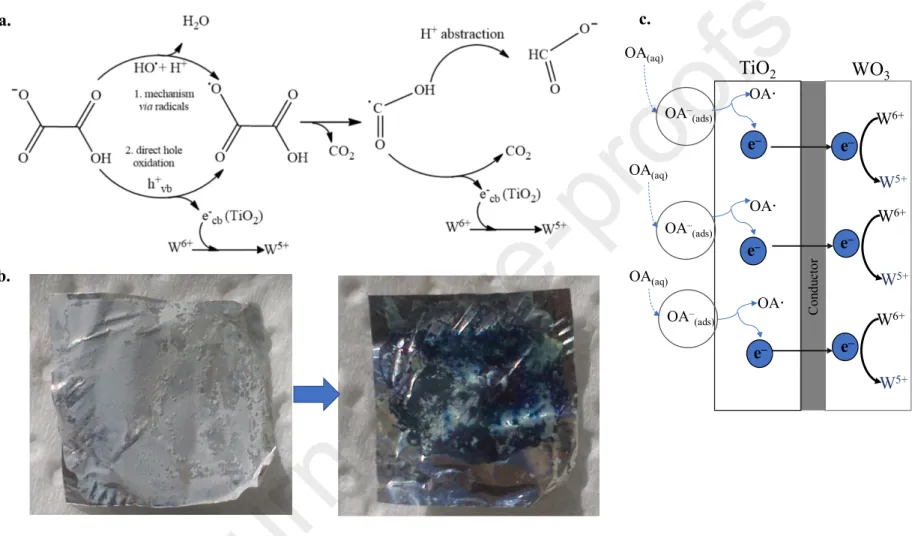
The latter mentioned properties of WO3(·0.33H2O), namely affinity towards electron, stabilization of the separated charges, assures the applicability of TiO2/WO3(·0.33H2O) composites not only as an efficient photocatalyst, but also as a qualitative sensor for some pollutants, either in the liquid phase (e. g. oxalic acid), or in the gaseous phase. As described before, the reduction of W6+ was induced by a quantum of energy, determined by the electron transfer from TiO2 to WO3(·0.33H2O). This charge transfer is reversible in the presence of species with high affinity to electrons (e.g., molecular oxygen).
300 400 500 600 700 800 900 1000 0
20 40 60 80 100
Reflectance (%)
λ (nm)
TiO2
TiO2/WO3
15 min UV exposure 70 min
after UV exposure
300 400 500 600 700 800 900 1000
0 20 40 60 80 100
Reflectance (%)
λ (nm)
TiO2
TiO2/WO3 · 0.33H2O
15 min UV exposure 70 min
after UV exposure
W6+
(TiO2/WO3 (·0.33H2O))
W5+
(TiO2/WO3 (·0.33H2O)) UV
O2 a.
c. d.
b.
-0.5 0 0.5 1 1.5 2 2.5 3 3.5
WO3
TiO2
e– e–
h+ h+
h+h+ e– e– W6+
W5+
-0.5 0 0.5 1 1.5 2 2.5
3 3.5
WO3 TiO2
e–
e– e– e–
hν
hν
ΔEg ΔEg
VB CB
CB
VB
E (eV) vsNHE E (eV) vsNHE
-0.5 0 0.5 1 1.5 2 2.5
3 3.5
WO3
TiO2 e– e–
h+ h+
h+h+ e– e– W6+
W5+
-0.5 0 0.5 1 1.5 2 2.5 3 3.5
WO3
TiO2
e–
e– e– e–
hν
hν
ΔEg ΔEg
VB CB
CB
VB
E (eV) vsNHE E (eV) vsNHE
E (eV) vsNHE
-1
-0.5
0
3.5
WO3
)
)
SP FC
CB
VB ΔEg
0.5
Fig. 5. (a) The schematic representation of charge transfer in RC/WO3(·0.33H2O), (b) The schematic representation of charge transfer in TiO2/WO3(·0.33H2O) composites, (c)-(d) The reflectance spectra of TiO2/WO3·0.33H2O and TiO2/WO3 before and after UV
irradiation
The next question would be: how can we monitor spectroscopically the charge transfer in the latter mentioned inorganic systems (in other words the formation of W5+ centers) in the most convenient way? In this work, we propose the recording of the reflectance spectra (DRS) in the UV-Vis-NIR range at certain well-defined moments, because while the absorption maximum of W6+ centers is situated at 340 nm, this value is 970 nm in the case of W5+ centers [59].
First, the DRS spectra of the composites before UV irradiation were recorded (Fig. 5.c - dark blue spectra– TiO2/WO3·0.33H2O, Fig. 5.d – golden spectra – TiO2/WO3). Although the reflectance remained constant in the 550-900 nm domain in the case of TiO2/WO3∙0.33H2O composite without any excitation, a significant decrease of reflectance in the same domain was observed after 15 min UV-A exposure (Fig. 5.c). The charge transfer from TiO2 to WO3(·0.33H2O) (implicitly the reduction of W6+ to W5+) was induced by the presence of ethanol vapors and UV- A irradiation (315 - 400 nm) during 15 min, in a specific isolated vial, followed by the immediate recording of the DRS spectra (Fig. 5.c-d) The quantification reduction or colorization process (W6+→W5+) of TiO2/WO3 (·0.33H2O) composites was carried out via the computation of the relative reflectance difference ((R0-RUV)/R0) at 970 nm considering the initial reflectance value (R0) and also after UV irradiation (RUV). While the relative reflectance difference corresponding for the direct process (W6+ →W5+) was 73.72% in the first case (TiO2/WO3·0.33H2O), this value was significantly lower (37.90%) in the second case (TiO2/WO3), which is clear evidence for the enhanced formation of W5+ centers in the first case as it can be seen in Fig. 5.c.
The reverse process (W5+→W6+) was also monitored via DRS in well-defined moments (2-14 in 2/4 minutes, 14-39 in 5 minutes, 39-59 in 10 minutes). The quantification of reverse process was interpreted via (R0-R70)/R0 considering the reflectance value after 70 min after UV irradiation (R70) and the initial reflectance value (R0). Because of the fact that the later mentioned relative reflectance difference was approximately three times higher in the case of TiO2/WO3·0.33H2O composites (61.30%) in comparison to TiO2/WO3 (22.60%), resulting that the reverse process was not completed even after 70 min in the first case (Fig. 5.c), while the decolorization was almost completed in the second case (Fig 5.d). The closer completion of W5+→W6+ process in TiO2/WO3 systems after 70 min can be explained by the weaker homogeneity of W5+ centers after 15 min UV-A exposure.
The differences in reduction and re-oxidation (W6 +hνW5 +, W5 +→W6 +) were given by the following issues: (i) the ratio of W5+/W6+ is higher in the case of WO3∙0.33H2O than in the case
![Fig. A2. The proposed pathways for MO degradation (Pathway no. 1 and 2 [66], Pathway no](https://thumb-eu.123doks.com/thumbv2/9dokorg/735890.29717/39.1188.182.990.125.572/fig-a-proposed-pathways-mo-degradation-pathway-pathway.webp)
