Journal Pre-proofs
ORIGINAL RESEARCH
Immunoprofiling of Drosophila Hemocytes by Single-cell Mass Cytometry József Á. Balog, Viktor Honti, Éva Kurucz, Beáta Kari, László G. Puskás, István Andó, Gábor J. Szebeni
PII: S1672-0229(21)00055-3
DOI: https://doi.org/10.1016/j.gpb.2020.06.022
Reference: GPB 510
To appear in: Genomics, Proteomics & Bioinformatics Received Date: 14 November 2019
Revised Date: 11 June 2020 Accepted Date: 28 June 2020
Please cite this article as: J.A. Balog, V. Honti, E. Kurucz, B. Kari, L.G. Puskás, I. Andó, G.J. Szebeni, Immunoprofiling of Drosophila Hemocytes by Single-cell Mass Cytometry, Genomics, Proteomics &
Bioinformatics (2021), doi: https://doi.org/10.1016/j.gpb.2020.06.022
This is a PDF file of an article that has undergone enhancements after acceptance, such as the addition of a cover page and metadata, and formatting for readability, but it is not yet the definitive version of record. This version will undergo additional copyediting, typesetting and review before it is published in its final form, but we are providing this version to give early visibility of the article. Please note that, during the production process, errors may be discovered which could affect the content, and all legal disclaimers that apply to the journal pertain.
© 2021 The Authors. Production and hosting by Elsevier B.V. on behalf of Beijing Institute of Genomics, Chi‐
nese Academy of Sciences and Genetics Society of China.
Immunoprofiling of Drosophila Hemocytes by Single-cell Mass Cytometry
József Á. Balog1,2,#, Viktor Honti3,#, Éva Kurucz3,#, Beáta Kari3, László G. Puskás1,István Andó3,*,§, Gábor J.
Szebeni1,4,*,§
1
Laboratory of Functional Genomics, Institute of Genetics, Biological Research Centre, Szeged H- 6726, Hungary
2University of Szeged, Ph.D. School in Biology, SzegedH-6726,Hungary
3Immunology Unit, Institute of Genetics, Biological Research Centre, Szeged H-6726, Hungary
4
Department of Physiology, Anatomy and Neuroscience, Faculty of Science and Informatics, University of Szeged, Szeged H-6726, Hungary
# Equal contribution.
* Corresponding authors.
E-mail: ando@brc.hu (Ando I), szebeni.gabor@brc.hu (Szebeni GJ)
§Current address: Institute of Genetics, Biological Research Centre, Szeged H-6726, Hungary.
Running title: Balog JA et al / Single-cell Mass Cytometry in Drosophila
Total counts of words (5685) figures (4)
tables (1)
supplementary figures (9) total references (44)
references from 2014 (18)
Abstract
Single-cell mass cytometry (SCMC) combines features of traditional flow cytometry (FACS) with mass spectrometry, making it possible to measure several parameters at the single-cell level for a complex analysis of biological regulatory mechanisms. In this study, we optimized SCMC to analyze hemocytes of the Drosophila innate immune system. We used metal-conjugated antibodies (H2, H3, H18, L1, L4, and P1 at the cell surface, intracellular 3A5 and L2) and anti-IgM (L6 at the cell surface) to detect the levels of antigens, while anti-GFP was used to detect crystal cells in the immune induced samples. We investigated the antigen expression profile of single cells and hemocyte populations in naive states, in immune induced states, in tumorous mutants bearing a driver mutation in the Drosophila homologue of Janus kinase (hopTum) and carrying deficiency of a tumor suppressor l(3)mbn1 gene, as well as in stem cell maintenance- defective hdcΔ84 mutant larvae. Multidimensional analysis enabled the discrimination of the functionally different major hemocyte subsets for lamellocytes, plasmatocytes, and crystal cells, and delineated the unique immunophenotype of Drosophila mutants. We have identified subpopulations of L2+/P1+ (l(3)mbn1), L2+/L4+/P1+ (hopTum) transitional phenotype cells in the tumorous strains and a subpopulation of L4+/P1+ cells upon immune induction. Our results demonstrated for the first time that SCMC, combined with multidimensional bioinformatic analysis, represents a versatile and powerful tool to deeply analyze the regulation of cell-mediated immunity of Drosophila.
KEYWORDS: Mass cytometry; Innate immunity; Drosophila; Single cell analysis, Hemocyte
Introduction
In the animal kingdom, insects have multi-layered innate immune defense mechanisms against invading pathogens. Investigation on insects, including the fruit fly Drosophila melanogaster that lacks an acquired immune response, plays an important role in our understanding of how innate immunity works [1,2]. The conserved signaling pathways between insects and vertebrates, combined with the powerful genetic resources of Drosophila, make Drosophila an ideal system to model biological phenomena related to human biology and medicine. In Drosophila, microbial infection induces a powerful humoral immune response, i.e., release of antimicrobial peptides, the regulation of which is now well understood [3].
Parasite infection, wounding, or tumorous development induce a cellular immune response by blood cells,
i.e., the hemocytes. Recognition, encapsulation, and killing of parasites, or phagocytosis of microorganisms [4−6] are exerted by specialized blood cells, the phagocytic plasmatocytes, the encapsulating lamellocytes, and the melanizing crystal cells. Quantitative methods are developed to identify mechanisms underlying cell-mediated immunity in Drosophila, and these mechanistic studies facilitate further investigations or manipulations of immune cells and tissues. In addition, transgenic reporter constructs and monoclonal antibodies have also been developed to define functional hemocyte subsets. These systems generally use fluorescent molecules in the form of in vivo markers or antibodies, which significantly contribute to our understanding of innate immunity [7−9].
Recently, single-cell mass cytometry (SCMC) was developed to monitor the expression of marker molecules in haematological and other pathological conditions [10,11]. Antibodies against cell type- specific antigens can be applied to monitor blood cell differentiation during ontogenesis or following immune induction. However, traditional antibody staining against only one or two of the cell type-specific antigens is not sufficient to describe individual hemocyte populations with complex antigen expression patterns. In our previous studies, we adopted and optimized SCMC for Drosophila by multiplex analysis of antibodies to transmembrane proteins or intracellular antigens of IgG and IgM types, which are routinely used for detecting and discriminating hemocyte subsets of Drosophila melanogaster [7,12−16].
The circulating hemocytes of the Drosophila larva are classified into three categories. Two cell types are present only in naive condition. These include the small round phagocytic plasmatocytes, which account for 95% of the circulating hemocytes, and the melanizing crystal cells, which are similar in size to plasmatocytes but contain prophenoloxidase crystals in their cytoplasm. The third cell type is the large flattened lamellocyte, which differentiates only in tumorous larvae and in case of immune induction, such as wounding or parasitic wasp infestation [17]. Lamellocytes, together with plasmatocytes, are capable of forming a multilayer capsule around the wasp egg, thereby killing the invader [18−20]. Plasmatocytes, crystal cells, and lamellocytes can be distinguished using cell type-specific monoclonal antibodies or in vivo transgenic reporters [7−9,12−15]. All plasmatocytes express P1 antigen (encoded by nimC1) [21], while lamellocytes show a characteristic expression of L1 (encoded by atilla), L2, L4, and L6 antigens [14].
Following immune induction, a portion of plasmatocytes transdifferentiate into lamellocytes to fight the parasitic wasp egg [22−25]. This transdifferentiation process is accompanied by a stepwise alteration of lamellocyte-specific antigen expression.
Understanding cancer remains a challenge for scientists. The conserved signal transduction pathways in Drosophila and the easy genetic manipulation make fruit fly a frequently used model organism to study
cancer [26]. Therefore, we investigated two different tumorous Drosophila strains. Onestrain bears a driver mutation (hopTum) in the hopscotch (hop) gene encoding a Janus kinase, Hopscotch (Hop), which is named as, and the other strain carries a deficiency of the tumor suppressor gene lethal (3) malignant blood neoplasm 1 (l(3)mbn), which is named as l(3)mbn1. Constitutive activation of Hop causes melanotic tumors and lymph gland hypertrophy in the larvae, as well as malignant neoplasia of blood cells in hopTum [27].
The homozygous mutation of l(3)mbn causes malignant transformation, enhanced hemocyte proliferation, and lamellocyte differentiation of blood cells in l(3)mbn1 Drosophila [28]. We also investigated the immunophenotype of a strain carrying a mutation in hdc (hdcΔ84), which encodes headcase, a Drosophila homolog of the human tumor suppressor HECA (Headcase protein homolog), and plays a role in hematopoietic stem cell maintenance [29,30]. In addition, Oregon-R (Ore-R) and white mutant w1118 were included as reference strains, since they were previously considered as wild type and used for the generation of mutants [31]. Immune activation was monitored successfully by infestation with the Leptopilina boulardi parasitoid wasp of Drosophila larvae in the lozenge>GFP strain (lz-Gal4, UAS-GFP; +;
+), in which crystal cells were monitored by metal tag labeled anti- GFP antibody [32,33].
We are the first to demonstrate that SCMC is a powerful tool for characterizing hemocytes in different Drosophila mutant strains at the protein level. Bioinformatic analysis revealed the characteristic protein expression pattern of hemocyte subsets at the single-cell resolution from different genetic variants examined. These together suggest that SCMC is a valuable tool for characterizing immune phenotypes in any model organisms, in which antibodies against immune components are available.
Results and discussion
SCMC reveals transitional phenotypes of hemocytes in the tumorous hopTum and l(3)mbn1 strains
We have built the metal tag labeled panel of discriminative antibodies recognizing Drosophila melanogaster hemocytes and hemocyte subsets for mass cytometry in this study. We have conjugated antibodies against six cell surface antigens (H2, H3, H18, L1, L4, and P1) and two intracellular antigens (3A5 and L2), as well as one anti-IgM for surface antigen L6. The list of antibodies can be found in Table 1. The 3A5 and H18 antibodies first reported herein were characterized and validated by indirect immunofluorescence and Western blot analyses (Figures S1 and S2). As shown in Figure S1, 3A5 is expressed in plasmatocytes and lamellocytes in l(3)mbn1 larvae, but not in lamellocytes of immune-
induced (L.b.) larvae (Figure S1). In contrast, H18 as a pan-hemocyte marker is expressed in all samples tested (Figure S2). To optimize antibody efficacies, we compared the fluorescence-activated cell sorting (FACS) (Figure S3A) and mass cytometry histograms (Figure S3B) for the antibodies to various antigens.
Both analyses showed similar reactivity patterns. Single live cells positive for the pan-hemocyte marker H2 were gated for mass cytometry analysis (Figure S4) and all metal tag-labeled antibodies were titrated for mass cytometry (Figure S5).
Next, we compared the expansion of hemocyte populations in the two mutant strains in relation to the two wild type strains Ore-R and w1118. The proportion of hemocytes expressing the investigated markers is comparable in Ore-R and w1118. However, we detected the emergence of hemocytes expressing L1, L2, and L4 markers in l(3)mbn1 and hopTum mutant larvae, reflecting an extensive differentiation of lamellocytes, a phenotype characteristic to the blood cell malignancy. A slight elevation in the proportion of L6-expressing hemocytes was also detected in hopTum larvae (Figure 1A and Figure S6). The moderate change may be explained by the fact that L6 is only expressed by a subset of lamellocytes in tumorous larvae [14]. All lamellocyte markers showed a higher expression level in the tumorous hopTum mutant compared to the control (Figure 1B and Figure S7). In the hdc∆84 mutant larvae, we detected a moderate elevation in the expression level of L2, and a decrease in the expression level of P1 (Figure 1B). However, the number of hemocytes expressing lamellocyte markers in the hdc∆84 strain did not increase significantly compared to the controls (Figure 1A). This is in line with the finding that in the hdc∆84 mutant larvae, lamellocytes differentiate in low numbers, while the number of plasmatocytes is reduced [30]. A reduction in the number of plasmatocytess is also evident in the hdc∆84 larvae (Figure 1A).
Multidimensional analysis by the algorithm of t-distributed stochastic neighbor embedding
(tSNE) and the visualization of stochastic neighbor embedding (viSNE) were carried out within
the H2 positive live singlets based on H3, H18, L1, L2, L4, L6, P1, and 3A5 marker expression in
order to map high parametric single-cell data on biaxial plots [34]. The viSNE patterns of hemocyte
marker expression correlated to the data shown in Figure 1 (Figure 2). The viSNE bioinformatic
analysis revealed the characteristic protein expression pattern of hemocyte subsets at single-cell
resolution from the studied genetic variants. We observed a dramatic difference in the viSNE
patterns between hemocytes isolated from the tumorous l(3)mbn
1and hop
Tumlarvae as compared
to either control Ore-R or w
1118larvae (Figure 2). Control Ore-R or w
1118hemocytes were not
discriminated on the viSNE plots showing their minimal genetic distance, but tumorous l(3)mbn
1and hop
Tumlarvae delineated viSNE maps with the expansion of lamellocytes (Figure 2). In the
hdc
∆84larvae, we detected a subset of hemocytes that express the 3A5 marker at a high level. This subset was detected neither in control, nor in the tumorous larvae, and may represent a cell type that differentiates as a precursor for lamellocytes as a consequence of the defect in the maintenance of the hematopoietic niche [30].
The Uniform Manifold Approximation and Projection (UMAP) analysis was performed by the hemocyte subset specific, discriminating markers: L1, L2, L4, L6 for lamellocytes, and P1 for plasmatocytes on the 5 studied genetic variants of Drosophila melanogaster. The UMAP analysis resulted in the same conclusion as tSNE, namely that lamellocyte expansion occurs in tumorous strains l(3)mbn1 and hopTum (Figure S8).
Both the viSNE and UMAP analysis demonstrate transitional phenotypes of certain lamellocytes and plasmatocytes by the co-expression of L2/P1 or L2/L4/P1 in l(3)mbn1 or hopTum, respectively (Figure 2 and Figure S8). Merging viSNE graphs outlined characteristic maps of each strain based on high parametric mass cytometry data (Figure 3A−C). The Ore-R and w1118 controls showed overlapping patterns on the viSNE diagram (Figure 3A−C), with a somewhat lower expression of all markers observed in case of the w1118, which may be due to uncontrollable genetic background variations. The dots representing hdc∆84 hemocytes, mutant of the hdc regulator of hematopoietic stem cell maintenance [30], were detected as a zone in between the control and the tumorous patterns (Figure 3C). The most likely explanation to this phenomenon is that hdc∆84 homozygous larvae produce lamellocytes, but in a much lower proportion than tumorous larvae, the l(3)mbn1 and hopTum [30]. Tumorous hemocytes l(3)mbn1 and hopTum were closely mapped and partially overlapping, giving a population clearly separated from the cloud of the controls due to the lamellocye-expansive malignant phenotype (Figure 3A−C).
SCMC revealed the transitional phenotypes of hemocytes upon immune induction
In order to monitor the changes in the composition of hemocyte subsets following immune
induction, we used lz>GFP larvae and complemented the experiment with anti-GFP labeling,
which enables the detection of crystal cells in that particular strain [32,33]. The tSNE analysis of
H3, H18, L1, L2, L4, L6, P1, 3A5 markers, and anti-GFP was carried out within the population of
pan-hemocyte H2 positive live singlets (Figure 4A). We observed a new subset of hemocytes
appearing 72 h after the infestation of the lz>GFP larvae with the parasitic wasp (Figure 4A and
Figure S9). This subset of cells accounts for the lamellocytes that differentiate as a result of the
immune induction since these cells fall into the high expression part of the viSNE for the L1, L2,
L4, and L6 lamellocyte markers (Figure 4A and Figure S9). This finding is in correlation with an
increase in the percentage of hemocytes expressing L1 (35.1% vs. 1.81 %), L2 (32% vs. 1.6 %), L4 (34.36% vs. 1.39 %), and L6 (13.82% vs. 0.935 %) markers (Figure 4B), and the elevated expression levels of lamellocyte markers detected in immune-induced larvae compared to the naive control (Figure 4C). Interestingly, a new subset of crystal cells (GFP
+cells) appeared in immune- induced (lz>GFP ii) larvae compared to the control (lz>GFP) (Figure 4A). The viSNE pattern of the 3A5 marker also changed significantly after the immune induction, which may be due to the newly differentiating hemocytes, similarly to that observed in the hdc
∆84larvae (Figure 4A).
Taken together, we report herein the first panel of metal-conjugated anti-Drosophila antibodies to present the applicability of mass cytometry for that canonical model organism of genetics. Recent studies identified novel subpopulations of Drosophila hemocytes based on single-cell RNA data [35−38]. These findings largely contributed to the definition of hemocyte clusters and to the characterization of intermediate cells in the transition from plasmatocyte to lamellocyte. In these experiments, clusters were defined by the gene expression patterns of individual hemocytes. The application of “cytometry by time- of-flight” (CyTOF) can complement these comprehensive transcriptomic studies and verify the existence of transitional phenotypes at the protein level. The comparative analysis of Ore-R and white1118 with l(3)mbn1, hopTum, and hdcΔ83 revealed transitional phenotypes at the protein level and the differences among reference stains: Ore-R and white1118. Both the viSNE and UMAP analysis demonstrated the transitional phenotype of certain subpopulations of lamellocytes and plasmatocytes by the co-expression of L2/P1 or L2/L4/P1 in l(3)mbn1 or hopTum, respectively. This has been verified by a functional assay of immune induction (Figure 4). Our study demonstrates transitional phenotypes (Figure 2, Figure 4A, and Figure S8) from single-cell data at the protein level, which places the innate immunity of Drosophila in a new biological insight. Additionally, we report herein two novel hemocyte markers, 3A5 with intracellular localization and H18 located on the cell surface. The simultaneous detection of several antigens provided by CyTOF could not be achieved earlier by traditional microscopy.
The main advantage of CyTOF is the multidimensionality coupled with complex computational tools;
therefore we propose the extension of the basic panel used in our study with antibodies recognizing signaling molecules (e.g., MAP kinases), enzymes (to follow metabolic pathways), and cellular structural proteins (e.g., cytoskeletal, cargo proteins) up to 42 markers in one single tube. Another advantage of the presented method is that CyTOF enables investigations at the protein level (data of transcriptomics should be verified at the protein level) with single-cell resolution. However, we may consider the limitations of the CyTOF, which are a.) the availability of antibodies against the protein of interest (which is also a limitation for other antibody-based detection approaches). Moreover, anti-tag antibodies are available
when the protein of interest is labeled with a fusion tag, or the cell of interest is labeled with the expression of a marker protein (we report herein the use of anti-GFP). Another limitations are b) the availability of the CyTOF technology (it is increasing and most of the research centers are supposed to own the technology, as there were 94 instruments already installed in Europe in 2020 January), c) the relatively high cost of the CyTOF technology (although the cost should be taken into account by the number of investigated markers at the protein level and the number of single cells).
We believe that our method serves as a rapid and cost-effective tool to monitor the alteration of hemocyte composition influenced by various agents or mutations. In those cases, it is less expensive and easier to perform than single-cell transcriptome analysis. Additionally, the CyTOF can complement transcriptomic studies verifying up to 42 simultaneous markers at the protein level with single-cell resolution.
Conclusion
The SCMC combines the features of traditional cytometry with mass spectrometry and enables the detection of several parameters at single-cell resolution, thus permitting a complex analysis of biological regulatory mechanisms. We optimized this platform to analyze the cellular elements, the hemocytes of the Drosophila innate immune system. The SCMC analysis with 9 antibodies to all hemocytes and hemocyte subsets showed good accordance of fluorescence flow cytometry results in terms of positivity on hemocytes of the tumor suppressor mutant l(3)mbn1. Further, we investigated the antigen expression profile of single cells and hemocyte populations in Ore-R and w1118 controls, and tumorous (l(3)mbn1, hopTum) strains, as well as in a stem cell maintenance defective mutant (hdcΔ84). The immunophenotype of immune activation upon infestation with a parasitoid wasp, the differentiation of lamellocytes was detected by 10 antibodies in the lz>GFP.
Multidimensional analysis (viSNE) enabled the discrimination of the major hemocytes: lamellocytes, plasmatocytes, and crystal cells and delineated the unique single-cell immunophenotype of the mutant strains under investigation. SCMC identified subpopulations of L2+/P1+ (l(3)mbn1), L2+/L4+/P1+ (hopTum) transitional phenotype cells in the tumorous strains and a subpopulation of L4+/P1+ cells upon immune induction. We demonstrated that mass cytometry, a recent single-cell technology coupled with multidimensional bioinformatic analysis at the protein level, represents a powerful tool to deeply analyze
Drosophila, a key multicellular model organism of genetic studies with a wide inventory of available mutants.
Materials and methods
Drosophila stocks
The following Drosophila lines were used in the current study: w
1118(BSC#9505, Bloomington Drosophila Stock Center, USA), Ore-R (wild type), w; hdc
Δ84/TM3, Kr>GFP [30], lz-Gal4, UAS- GFP; +; + (a gift from Bruno Lemaitre, Lausanne, Switzerland) [32], l(3)mbn
1/TM6 Tb [28], and a homozygous hop
Tum(BSC#8492) line generated by Dr. Gábor Csordás (BRC, Szeged, Hungary).
The flies were grown on a standard cornmeal-yeast substrate at 25 °C.
Production of 3A5 and H18 antibodies
Monoclonal antibodies against Drosophila hemocytes were raised as described previously [14]. Briefly, BALB/c mice were immunized by intraperitoneal i.p. injection of 106 hemocytes from late third instar larvae of the l(3)mbn1 mutant larvae in Drosophila Ringer’s solution (Sigma-Aldrich, St. Louis, MI). Booster injections were given 4, 8, and 13 weeks later. Three days after the last immunization, spleen cells were collected and fused with SP2/O myeloma cells by using polyethylene glycol (PEG1450, catalog No. P5402, Sigma-Aldrich). Hybridomas were selected in hypoxanthine-aminopterin-thymidine (HAT Supplement, 21060017 Thermo Fischer Scientific Waltham, MA, USA) medium and maintained as described by Kohler and Milstein [14,39]. Hybridoma culture supernatants were screened by indirect immunofluorescence on live or acetone fixed permeabilized hemocytes. The selected hybridomas were subcloned three times by limiting dilution.
Isolation of hemocytes
Hemocytes were isolated from late third stage larvae by dissecting the larvae in Drosophila Schneider’s solution (21720001 Thermo Fisher Scientific, Waltham, MA, USA)) supplemented with 5% fetal bovine serum albumin (FBS, F7524-500ML Sigma-Aldrich) plus 0.003% 1-phenyl-2-thiourea (P7629 Sigma-Aldrich).
Immune induction
Lz-Gal4/UAS-GFP flies (lz>GFP) laid eggs for three days in bottles containing standard Drosophila medium.
After 72 hours, larvae were infected with Leptopilina boulardi wasps for 6 hours. Larvae with visible melanotic nodules were selected 72 hours after infestation for isolation of hemocytes. Age and size- matched larvae were used as control.
Immunofluorescent staining
Immunofluorescent staining was performed as described previously [23]. Briefly, hemocytes were attached to multispot slides (SM-011, Hendley-Essex, Loughton, UK) at 21 °C for 45 min. Fixation was performed with acetone for 6 min, rehydrated, and subsequently blocked for 20 min in PBS supplemented with 0.1% BSA (PBS, phosphate-buffered saline, P4417 Sigma-Aldrich; BSA, bovine serum albumin, A2058 Sigma-Aldrich), incubated with the indicated antibodies for 1 h at 21 °C, washed three times with PBS and incubated with CF-568 conjugated anti-mouse IgG (H+L), F(ab’)2 fragment (1:1000, SAB4600082 Sigma- Aldrich) for 45 min. Nuclei were labeled with DAPI (D9542 Sigma-Aldrich). The microscopic analysis was carried out using a Zeiss Axioskope 2MOT epifluorescent microscope and Axiovision 2.4 software (Zeiss, Oberkochen, Germany).
Western blotting
Western blotting was performed in order to test the specificity of the anti-3A5 and anti-H18 antibodies, as described previously [12]. Briefly, proteins were differentiated by SDS-PAGE. Following the electrophoresis, the proteins were blotted onto a nitrocellulose membrane (Hybond-C, 10564755 Amersham Pharmacia, Buckinghamshire, UK) in the transfer buffer (25 mM Tris pH 8.3, 192 mM glycine, 20% (V/V) methanol). The nonspecific binding was blocked with PBS supplemented with 0.1% Tween 20 (PBST, P1379 Sigma-Aldrich) and 5% non-fat dry milk at 21 °C for 1 h. The blotted proteins were reacted to the indicated antibody (anti-3A5 in Figure S1, and anti-H18 in Figure S2) with rotation at 21 °C for 3 h.
Washing was performed with PBST three times for 10 min and then incubated with HRPO-conjugated anti- mouse antibody (62-6520 Thermo Fisher Scientific). After three washes with PBST for 10 min, the proteins
were detected by the ECL-Plus system (32132 Thermo Fisher Scientific) following the manufacturer’s recommendations.
Flow cytometry
Flow cytometry was executed as published previously [12]. Briefly, 20 µl of 107/ml hemocyte suspension was plated in insect Schneider’s medium (supplemented with 10% fetal calf serum (Gibco, Thermo Fisher Scientific) into each well of a 96-well U-bottom microtiter plate (3635 Corning Life Sciences, Tewksbury, MA, USA). Samples for intracellular staining were treated with 2% paraformaldehyde (158127 Sigma- Aldrich). Hybridoma supernatants (50 µl) were measured to each well and reacted at 4 °C for 45 min. The negative control monoclonal antibody was a mouse IgG1 (clone T2/48, anti-human anti-CD45) [40]. After the incubation, cells were washed three times with ice-cold Schneider’s medium. The secondary antibody, Alexa Fluor 488-labeled anti-mouse IgG (AP124JA4 Sigma-Aldrich) was added (1:1000). After 45 min incubation at 4 °C, the cells were washed (three times) with ice-cold Schneider’s medium and acquired on FACSCalibur (Beckton Dickinson, Franklin Lakes, NJ, USA).
Mass cytometry
Mass cytometry was performed as we published earlier with some modifications [10,41]. The affinity- purified monoclonal antibodies were provided by Istvan Ando’s group (BRC, Szeged, Hungary) (Table 1) or purchased: anti-IgM, (406527 Biolegend, San Diego, CA, USA [42]), anti-GFP (A11122 Thermo Fisher Scientific [43]), and anti-CD45 (3089003B Fluidigm, South San Francisco, CA, USA [44]) and conjugated in house according to the instructions of the manufacturer (Maxpar antibody labeling kit, Fluidigm). Optimal antibody concentrations were titrated prior to use (Figure S5). The following antibody concentrations were used: H2: 5 µg/ml, H3: 5 µg/ml, H18: 5 µg/ml, L1: 1 µg/ml, L2: 7.5 µg/ml, L4: 7.5 µg/ml, L6: 10 µg/ml, anti- IgM: 10 µg/ml, P1: 7.5 µg/ml, 3A5: 5 µg/ml, and anti-GFP: 10 µg/ml. The negative control monoclonal antibody was a mouse IgG1 (clone Hl30, anti-human 89Y labeled CD45) in 1:100 dilution. The isotypes of anti-Drosophila antibodies were determined by the IsoStrip™ Antibody Isotyping Kit (11493027001 Roche, Basel, Switzerland) according to the instructions of the manufacturer.
Single-cell suspensions were centrifugated at 1100 g at 6 °C for 4 min and incubated with viability marker (5 µM cisplatin, 195 Pt, 201064 Fluidigm) on ice in 40 µl PBS for 3 min. Cells were washed twice
with 200 µl Maxpar Cell Staining Buffer (MCSB, 201068 Fluidigm) and centrifugated at 1100 g at 6°C for 4 min. Cells were resuspended in 50 µl MCSB, and 50 µl surface antibody cocktail (2 ×) was added, incubated on ice for 30 min. Cells were washed with 200 µl MCSB and stained with anti-IgM antibody (volumes were the same as in the surface staining), incubated on ice for 30 min. Cells were washed with 200 µl MCSB and suspended in 100 µl 1 × Maxpar Fix I buffer (201065 Fluidigm), incubated on ice for 20 min. Cells were washed twice with 200 µl Perm-S buffer (201066 Fluidigm) then stained with the intracellular antibody cocktail (L2, 3A5, and anti-GFP in Lz>GFP samples), left on ice for 30 min. Cells were washed once with MCSB, then fixed with 200 µl 1.6% formaldehyde solution (freshly diluted from 16% Pierce formaldehyde in PBS, 28906 Thermo Fisher Scientific), incubated on ice for 10 minutes, then centrifugated at 1300 g at 6°C for 4 min. After fixation, cells were resuspended in 300 µl Maxpar Fix and Perm buffer (201067 Fluidigm) containing 125 nM Cell-ID DNA intercalator (191/193 Iridium, 201192A Fluidigm) and incubated at 4 °C overnight. Before the acquisition, samples were washed in MCSB twice and in PBS once (without Mg2+ and Ca2+, 10010015 Thermo Fisher Scientific) by centrifugation at 1300 g at 6°C for 4 min. Cells were counted using the Bürker chamber. For the measurement on Helios, the concentration of cells was set to 0.5 × 10⁶/ml in cell acquisition solution (CAS, 201240 Fluidigm) supplemented with 10% EQ Calibration Beads (201078 Fluidigm). Cells were filtered (30 µm, 04-0042-2316 Celltrics, Sysmex Partec, Görlitz, Germany) prior to acquisition. Samples were run on CyTOF Helios (Fluidigm). Bead-based normalization of CyTOF data was performed. After randomization, normalization, and FCS file generation, the files were further analyzed in Cytobank (Beckman Coulter, Brea, CA, USA). Analysis of the cells was carried out on live singlets within the pan-hemocyte marker, H2 positive population. The viSNE (visualization of stochastic neighbour embedding) analysis was carried out on 3 × 10⁴ cisplatin negative (live) singlets with the following settings: iterations = 1000, perplexity = 30, theta = 0.5).
CRediT author statement
József Á. Balog: Data curation, Formal analysis, Investigation, Methodology, Software, Validation, Visualization. Viktor Honti: Conceptualization, Data curation, Formal analysis, Investigation, Methodology, Writing - original draft, Writing-review & editing. Éva Kurucz: Data curation, Formal analysis, Investigation, Methodology, Writing - review & editing. Beáta Kari: Investigation. László G. Puskás: Conceptualization, Funding acquisition, Project administration, Resources, Supervision, Writing - review & editing. István Andó: Conceptualization, Formal analysis, Funding acquisition, Project administration, Resources, Supervision, Writing - original draft, Writing - review & editing. Gábor J. Szebeni: Conceptualization,
Formal analysis, Project administration, Supervision, Writing - original draft, Writing - review & editing.
The authors read and approved the final version of the manuscript.
Competing interests
The authors have declared no competing interests.
Acknowledgments
This work was supported by the following grants: Grant Nos. GINOP-2.3.2-15-2016-00001, GINOP-2.3.2- 15-2016-00030 (LGP), GINOP-2.3.2-15-2016-00035 (ÉK), NKFI NN118207 and NKFI K120142 (IA), NKFI 120140 (EK), and OTKA K-131484 (VH) by the National Research, Development and Innovation Office.
Gábor J. Szebeni was supported by the New National Excellence Program of the Ministry for Innovation and Technology (Grant No. UNKP-19-4-SZTE-36) and by the János Bolyai Research Scholarship of the Hungarian Academy of Sciences (Grant No. BO/00139/17/8). We are grateful to Mrs. Olga Kovalcsik for the technical help.
ORCID
0000-0001-8208-9157 (József Á. Balog) 0000-0001-7418-3653 (Viktor Honti) 0000-0002-9386-2798 (Éva Kurucz) 0000-0002-4377-6824 (Beáta Kari) 0000-0003-0271-3517 (László G. Puskás) 0000-0002-4648-9396 (István Andó) 0000-0002-6998-5632 (Gábor J. Szebeni)
References
[1] Kim-Jo C, Gatti JL, Poirie M. Drosophila cellular immunity against parasitoid wasps: a complex and time-dependent process. Front Physiol 2019;10:603.
[2] Troha K, Buchon N. Methods for the study of innate immunity in Drosophila melanogaster.
Wiley Interdiscip Rev Dev Biol 2019;8:e344.
[3] Imler JL, Bulet P. Antimicrobial peptides in Drosophila: structures, activities and gene regulation. Chem Immunol Allergy 2005;86:1−21.
[4] Williams MJ. Drosophila hemopoiesis and cellular immunity. J Immunol 2007;178:4711-6.
[5] Loch G, Zinke I, Mori T, Carrera P, Schroer J, Takeyama H, et al. Antimicrobial peptides extend lifespan in Drosophila. PLoS One 2017;12:e0176689.
[6] Kenmoku H, Hori A, Kuraishi T, Kurata S. A novel mode of induction of the humoral innate immune response in Drosophila larvae. Dis Model Mech 2017;10:271−81.
[7] Evans CJ, Liu T, Banerjee U. Drosophila hematopoiesis: markers and methods for molecular genetic analysis. Methods 2014;68:242−51.
[8] Goto A, Kadowaki T, Kitagawa Y. Drosophila hemolectin gene is expressed in embryonic and larval hemocytes and its knock down causes bleeding defects. Dev Biol 2003;264:582−91.
[9] Tokusumi T, Shoue DA, Tokusumi Y, Stoller JR, Schulz RA. New hemocyte-specific enhancer-reporter transgenes for the analysis of hematopoiesis in Drosophila. Genesis
2009;47:771−4.[10] Alfoldi R, Balog JA, Farago N, Halmai M, Kotogany E, Neuperger P, et al. Single cell mass cytometry of non-small cell lung cancer cells reveals complexity of in vivo and three-dimensional models over the Petri-dish. Cells 2019;8:1093.
[11] Bandyopadhyay S, Fowles JS, Yu L, Fisher DAC, Oh ST. Identification of functionally primitive and immunophenotypically distinct subpopulations in secondary acute myeloid leukemia by mass cytometry. Cytometry B Clin Cytom 2019;96:46−56.
[12] Kurucz E, Zettervall CJ, Sinka R, Vilmos P, Pivarcsi A, Ekengren S, et al. Hemese, a hemocyte-specific transmembrane protein, affects the cellular immune response in Drosophila.
Proc Natl Acad Sci U S A 2003;100:2622−7.
[13] Kurucz E, Markus R, Zsamboki J, Folkl-Medzihradszky K, Darula Z, Vilmos P, et al. Nimrod, a putative phagocytosis receptor with EGF repeats in Drosophila plasmatocytes. Curr Biol
2007;17:649−54.[14] Kurucz E, Vaczi B, Markus R, Laurinyecz B, Vilmos P, Zsamboki J, et al. Definition of Drosophila hemocyte subsets by cell-type specific antigens. Acta Biol Hung 2007;58
Suppl:95−111.[15] Honti V, Kurucz E, Csordas G, Laurinyecz B, Markus R, Ando I. In vivo detection of lamellocytes in Drosophila melanogaster. Immunol Lett 2009;126:83−4.
[16] Anderl I, Vesala L, Ihalainen TO, Vanha-Aho LM, Ando I, Ramet M, et al.
Transdifferentiation and proliferation in two distinct hemocyte lineages in Drosophila
melanogaster larvae after wasp infection. PLoS Pathog 2016;12:e1005746.
[17] Honti V, Csordas G, Kurucz E, Markus R, Ando I. The cell-mediated immunity of Drosophila melanogaster: hemocyte lineages, immune compartments, microanatomy and regulation. Dev Comp Immunol 2014;42:47−56.
[18] Nappi AJ, Vass E, Frey F, Carton Y. Superoxide anion generation in Drosophila during melanotic encapsulation of parasites. Eur J Cell Biol 1995;68:450−6.
[19] Russo J, Dupas S, Frey F, Carton Y, Brehelin M. Insect immunity: early events in the encapsulation process of parasitoid (Leptopilina boulardi) eggs in resistant and susceptible strains of Drosophila. Parasitology 1996;112 ( Pt 1):135−42.
[20] Lanot R, Zachary D, Holder F, Meister M. Postembryonic hematopoiesis in Drosophila. Dev Biol 2001;230:243−57.
[21] Melcarne C, Ramond E, Dudzic J, Bretscher AJ, Kurucz E, Ando I, et al. Two Nimrod receptors, NimC1 and Eater, synergistically contribute to bacterial phagocytosis in Drosophila melanogaster. FEBS J 2019;286:2670−91.
[22] Avet-Rochex A, Boyer K, Polesello C, Gobert V, Osman D, Roch F, et al. An in vivo RNA interference screen identifies gene networks controlling Drosophila melanogaster blood cell homeostasis. BMC Dev Biol 2010;10:65.
[23] Honti V, Csordas G, Markus R, Kurucz E, Jankovics F, Ando I. Cell lineage tracing reveals the plasticity of the hemocyte lineages and of the hematopoietic compartments in Drosophila melanogaster. Mol Immunol 2010;47:1997−2004.
[24] Stofanko M, Kwon SY, Badenhorst P. Lineage tracing of lamellocytes demonstrates Drosophila macrophage plasticity. PLoS One 2010;5:e14051.
[25] Kroeger PT, Jr., Tokusumi T, Schulz RA. Transcriptional regulation of eater gene expression in Drosophila blood cells. Genesis 2012;50:41−9.
[26] Mirzoyan Z, Sollazzo M, Allocca M, Valenza AM, Grifoni D, Bellosta P. Drosophila melanogaster: a model organism to study cancer. Front Genet 2019;10:51.
[27] Harrison DA, Binari R, Nahreini TS, Gilman M, Perrimon N. Activation of a Drosophila Janus kinase (JAK) causes hematopoietic neoplasia and developmental defects. EMBO J
1995;14:2857−65.[28] Konrad L, Becker G, Schmidt A, Klockner T, Kaufer-Stillger G, Dreschers S, et al. Cloning, structure, cellular localization, and possible function of the tumor suppressor gene lethal(3)malignant blood neoplasm-1 of Drosophila melanogaster. Dev Biol 1994;163:98−111.
[29] Weaver TA, White RA. Headcase, an imaginal specific gene required for adult morphogenesis in Drosophila melanogaster. Development 1995;121:4149−60.
[30] Varga GIB, Csordas G, Cinege G, Jankovics F, Sinka R, Kurucz E, et al. Headcase is a repressor of lamellocyte fate in Drosophila melanogaster. Genes (Basel) 2019;10:173.
[31] Ferreiro MJ, Perez C, Marchesano M, Ruiz S, Caputi A, Aguilera P, et al. Drosophila melanogaster white mutant w(1118) undergo retinal degeneration. Front Neurosci 2017;11:732.
[32] Binggeli O, Neyen C, Poidevin M, Lemaitre B. Prophenoloxidase activation is required for
survival to microbial infections in Drosophila. PLoS Pathog 2014;10:e1004067.
[33] Lebestky T, Chang T, Hartenstein V, Banerjee U. Specification of Drosophila hematopoietic lineage by conserved transcription factors. Science 2000;288:146−9.
[34] Amir el AD, Davis KL, Tadmor MD, Simonds EF, Levine JH, Bendall SC, et al. viSNE enables visualization of high dimensional single-cell data and reveals phenotypic heterogeneity of leukemia. Nat Biotechnol 2013;31:545−52.
[35] Cho B, Yoon S-H, Lee D, Koranteng F, Tattikota SG, Cha N, et al. Single-cell transcriptome maps of myeloid blood cell lineages in Drosophila. Nat Commun 2020;11:4483..
[36] Merkling SH, Lambrechts L. Taking insect immunity to the single-cell level. Trends Immunol
2020;41:190−9.[37] Cattenoz PB, Sakr R, Pavlidaki A, Delaporte C, Riba A, Molina N, et al. Temporal specificity and heterogeneity of Drosophila immune cells. EMBO J 2020;39:e104486.
[38] Tattikota SG, Cho B, Liu Y, Hu Y, Barrera V, Steinbaugh MJ, et al. A single-cell survey of Drosophila blood. Elife 2020;9:e54818
[39] Kohler G, Milstein C. Derivation of specific antibody-producing tissue culture and tumor lines by cell fusion. Eur J Immunol 1976;6:511−9.
[40] Oravecz T, Monostori E, Kurucz E, Takacs L, Ando I. Cd3-induced T-cell proliferation and interleukin-2 secretion is modulated by the CD45 antigen. Scand J Immunol 1991;34:531−7.
[41] Balog JA, Hackler L, Jr., Kovacs AK, Neuperger P, Alfoldi R, Nagy LI, et al. Single cell mass cytometry revealed the immunomodulatory effect of cisplatin via downregulation of splenic CD44+, IL-17A+ MDSCs and promotion of circulating IFN-gamma+ myeloid cells in the 4T1 metastatic breast cancer model. Int J Mol Sci 2019;21:170.
[42] Tertilt C, Joh J, Krause A, Chou P, Schneeweiss K, Crystal RG, et al. Expression of B-cell activating factor enhances protective immunity of a vaccine against Pseudomonas aeruginosa.
Infect Immun 2009;77:3044−55.
[43] Kallert SM, Darbre S, Bonilla WV, Kreutzfeldt M, Page N, Muller P, et al. Replicating viral vector platform exploits alarmin signals for potent CD8(+) T cell-mediated tumour immunotherapy. Nat Commun 2017;8:15327.
[44] Papo M, Corneau A, Cohen-Aubart F, Robin B, Emile JF, Miyara M, et al. Immune phenotyping of Erdheim-Chester disease through mass cytometry highlights decreased proportion of non-classical monocytes and increased proportion of Th17 cells. Ann Rheum Dis 2020;annrheumdis-2020-217316.
Figure legends
Figure 1 Single-cell mass cytometry revealed the expansion of hemocytes in hopTum and l(3)mbn1 A. The percentage of H3, H18, L1, L2, L4, L6, P1, and 3A5 cells were plotted on radar plots for Drosophila mutants on Ore-R or w1118 background. B. Comparative heatmap of mass cytometry data (arcsinh- transformed median intensity values) regarding marker density at single-cell resolution show increased
expression of H18, L1, L2, and L4 markers in the mutant hopTum and l(3)mbn1 in relation to control, the wild type Ore-R. The analysis was performed within the H2 positive live singlets.
Figure 2 Multidimensional comparative analysis by the tSNE algorithm
The tSNE algorithm dissects the cell relatedness of 5 different Drosophila strains, namely Ore-R, w1118, l(3)mbn1, hopTum, and hdcΔ84. The wild type Ore-R and white mutant w1118 (genetic backgrounds) are overlapping while both tumorous strains l(3)mbn1 and hopTum represent H18, L1, L2, and L4 expansion. The tSNE analysis of H3, H18, L1, L2, L4, L6, P1, and 3A5 markers was carried out within the population of pan- hemocyte H2 positive live singlets and visualized as viSNE plots. Subpopulations of cells with common marker expression patterns are grouped close in the multidimensional space, while cells with different marker expression are plotted separately. Coloration is proportional to the intensity of the expression of a given marker: the hotter the plot, the higher the level of expression (red plots). Red boxes mark transitional phenotypes expressing both lamellocyte (L2 or L4) and plasmatocyte (P1) markers.
Figure 3 Merging viSNE graphs outline characteristic maps of each strain
The tSNE analysis was based on H3, H18, L1, L2, L4, L6, P1, and 3A5 marker expression within the pan- hemocyte H2 positive live singlets (green: Ore-R, blue: w1118, red: l(3)mbn1, lilac: hopTum, and yellow:
hdcΔ84). A. The viSNE comparison of l(3)mbn1 and its wild-type counterpart, the Ore-R. B. The viSNE comparison of w1118, hopTum, and hdcΔ84. C. The viSNE islands of the control cells (Ore-R and w1118) localize separately from the tumorous l(3)mbn1 and hopTum hemocytes, while hdcΔ84 represents a transition phenotype.
Figure 4 Immune activation by infestation with the Leptopilina boulardi parasitoid wasp of the lozenge>GFP strain
A. viSNE analysis of naive (lz>GFP) and immune induced (lz>GFP i.i.) Drosophila larvae. The tSNE analysis of H3, H18, L1, L2, L4, L6, P1, 3A5, and A-GFP was carried out within the population of pan-hemocyte H2 positive live singlets. Red boxes mark a subpopulation, the transitional phenotype of hemocytes expressing both lamellocyte (L4+) and plasmatocyte (P1) markers upon immune induction. B. The percentage of H3, H18, L1, L2, L4, L6, P1, anti-GFP (crystal cells), and 3A5 positive cells. C. The heatmap of the (arcsinh- transformed) median values shows the expression changes of the hemocyte marker expression upon immune induction. The analysis was performed within the pan-hemocyte marker H2 positive live singlets.
A-GFP, anti-GFP marking crystal cells in this particular system.
Supplementary material
Figure S1 Expression pattern and molecular weight of 3A5
A. The expression of 3A5 in the wild type Ore-R and L. boulardi G486 immune induced Ore-R larvae and (B) in the l(3)mbn1 tumor suppressor mutant circulating hemocytes. The 3A5 molecule is expressed in plasmatocytes and lamellocytes in l(3)mbn1, but not expressed in lamellocytes of immune (L.b.) induced larvae. Fluorescence microscopy and indirect immunofluorescence analysis were carried out with a Zeiss Axioskope 2 MOT epifluorescence microscope. Images were taken with a Zeiss Axiocam digital camera.
Scale bars (black lines): 10 µm. C. Detection of the 3A5 molecule from l(3)mbn1 hemocyte extract. 3A5 is detected as a 100 kDa protein in Western blot.
Figure S2 Expression pattern and molecular weight of H18
A. The expression of H18 in the wild type Ore-R and L. boulardi G486 immune induced Ore-R larvae and (B) in the l(3)mbn1 tumor suppressor mutant circulating hemocytes. H18 molecule is expressed in plasmatocytes and lamellocytes both in naive and in immune (L.b.) induced larvae in Ore-R, and in l(3)mbn1 tumor suppressor mutant circulating hemocytes. Fluorescence microscopy and indirect immunofluorescence analysis were carried out with a Zeiss Axioskope 2 MOT epifluorescence microscope.
Images were taken with a Zeiss Axiocam digital camera. Scale bars (black lines): 10 µm. C. Detection of the H18 molecule from l(3)mbn1 hemocyte extract. H18 is detected as a 22.5 kDa protein in Western blot.
Figure S3 Mass cytometry histograms were verified by fluorescent flow cytometry in Drosophila melanogaster hemocytes
Comparison of (A) fluorescence flow cytometry (FACS) data and (B) mass cytometry (CyTOF) data obtained from the same l(3)mbn1 hemocytes and same H2, H3, H18, L1, L2, L4, L6, P1, and 3A5 anti-hemocyte antibodies (red lines in (A)). The negative control monoclonal antibody used for FACS (black lines in (A)) was of mouse origin, the T2/48 IgG1 (anti-human CD45). The negative control monoclonal antibody used for CyTOF was of mouse origin, the HI30 clone IgG1 anti-human CD45 labeled by 89Y metal tag.
Figure S4 Gating strategy to define cells, singlets, living cells, and H2+ pan-hemocytes
Drosophila hemocytes were stained with cisplatin (195 Pt), H2 antibody (147 Sm), DNA intercalators (191Ir and 193Ir) as described in the Materials and Methods section. Cells were gated in Cytobank to discriminate cells from calibration beads (DNA 191Ir+/140Ce-), to define singlets, to determine living cells (cisplatin 195Pt-) and H2+ hemocytes in l(3)mbn1strain.
Figure S5 Titration of the metal-tag labeled antibodies for mass cytometry
Antibody titration was performed in order to determine the optimal concentration of (A) anti-H2, anti-H3, anti-H18, anti-L1, anti-L2, anti-L4, anti-P1, anti-3A5, and (B) anti-L6, anti-IgM (concentrations are indicated in the figure) antibodies in l(3)mbn1strain within the living singlets. The negative control monoclonal antibody used for CyTOF was of mouse origin, the HI30 clone IgG1 anti-human CD45 labeled by 89Y metal tag. C. The anti-GFP antibody detecting crystal cells was titrated in the (lz>GFP) lozenge strain within the H2+ (living singlet) hemocytes.
Figure S6 Representative dot plots of mass cytometry measurements using metal conjugated antibodies Antibody labeling was performed in order to detect H3, H18, L1, L2, L4, L6, P1, and 3A5 markers (within H2+ living singlets) in the Ore-R, w1118, l(3)mbn1, hopTum, and hdcΔ84 strains as described in Materials and Methods section.
Figure S7 Representative histograms of mass cytometry
Antibody labeling was performed in order to detect H3, H18, L1, L2, L4, L6, P1, and 3A5 markers (within H2+ living singlets) in the Ore-R, w1118, l(3)mbn1, hopTum, and hdcΔ84 strains as described in Materials and Methods section.
Figure S8 The UMAP analysis showed the lamellocyte expansion in tumorous l(3)mbn1 and hopTum strains
The UMAP analysis was performed by the hemocyte subset specific, discriminating markers: L1, L2, L4, L6 for lamellocytes, and P1 for plasmatocytes on the 5 studied genetic variants of Drosophila melanogaster.
The metrics were as follows: Euclidean, nearest neighbors: 20; minimum distance: 0.5; 20000 cells/samples in FlowJo™ v10.6.1 (Becton Dickinson). Red boxes mark transitional phenotypes of hemocytes expressing both lamellocyte (L2 or L4) or plasmatocyte (P1) markers. UMAP, Uniform Manifold Approximation and Projection.
Figure S9 Representative histograms of mass cytometry upon immune activation in Drosophila melanogaster
Antibody labeling was performed in order to detect H3, H18, L1, L2, L4, L6, P1, crystal cells (A-GFP), and 3A5 markers in the naive (lz>GFP) and immune induced (lz>GFP i.i.) larvae as described in Materials and Methods section. A-GFP, anti-GFP.
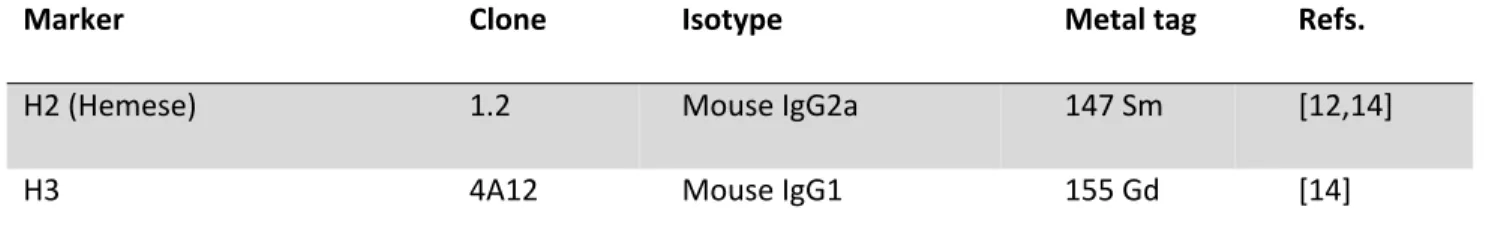
Table 1 List of the antibodies used for mass cytometry
Marker Clone Isotype Metal tag Refs.
H2 (Hemese) 1.2 Mouse IgG2a 147 Sm [12,14]
H3 4A12 Mouse IgG1 155 Gd [14]
H18 (Tetraspannin42Ed) H18 Mouse IgG1 164 Dy -
L1 (Atilla) H10 Mouse IgG1 149 Sm [14,15,23]
L2 31A4 Mouse IgG2a 158 Gd [14,23]
L4 (Integrin beta-PS) 1F12 Mouse IgG1 159 Tb [14,23]
L6 (IgM) H3 Mouse IgM – [14,23]
Anti-IgM RMM-1 Rat IgG2a 172 Yb [42]
P1 (NimC1) N47 Mouse IgG1 154 Sm [13,14,21]
3A5 3A5 Mouse IgG2b 169 Tm -
Anti-GFP – Rabbit polyclonal IgG 175 Lu [43]
Anti-CD45 HI30 Mouse IgG1 89 Y [44]
CRediT author statement
József Á. Balog: Data curation, Formal analysis, Investigation, Methodology, Software, Validation, Visualization. Viktor Honti: Conceptualization, Data curation, Formal analysis, Investigation, Methodology, Writing - original draft, Writing-review & editing. Éva Kurucz: Data curation, Formal analysis, Investigation, Methodology, Writing - review & editing. Beáta Kari: Investigation. László G. Puskás: Conceptualization, Funding acquisition, Project administration, Resources, Supervision, Writing - review & editing. István Andó: Conceptualization, Formal analysis, Funding acquisition, Project administration, Resources, Supervision, Writing - original draft, Writing - review & editing. Gábor J. Szebeni: Conceptualization, Formal analysis, Project administration, Supervision, Writing - original draft, Writing - review & editing.
The authors read and approved the final version of the manuscript.