-
Contents lists available atsciencedirect.com Journal homepage:www.elsevier.com/locate/jvalPreference-Based Assessments
Parallel Valuation of the EQ-5D-3L and EQ-5D-5L by Time Trade-Off in Hungary
Fanni Rencz, PhD,*Valentin Brodszky, PhD, László Gulácsi, DSc, Dominik Golicki, PhD, Gábor Ruzsa, MSc, A. Simon Pickard, PhD, Ernest H. Law, PharmD, PhD, Márta Péntek, PhD
A B S T R A C T
Objectives:The wording of the Hungarian EQ-5D-3L and EQ-5D-5L descriptive systems differ a great deal. This study aimed to (1) develop EQ-5D-3L and EQ-5D-5L value sets for Hungary from a common sample, and (2) compare how level wording affected valuations.
Methods:In 2018 to 2019, 1000 respondents, representative of the Hungarian general population, completed composite time trade-off tasks. Pooled heteroscedastic Tobit models were used to estimate value sets. Value set characteristics, single-level transition utilities from adjacent corner health states, and mean transition utilities for all possible health states were compared between the EQ-5D-3L and EQ-5D-5L.
Results:Health utilities ranged from -0.865 to 1 for the EQ-5D-3L and -0.848 to 1 for the EQ-5D-5L. The relative importance of the 5 EQ-5D-5L dimensions was as follows: mobility, pain/discomfort, self-care, anxiety/depression, and usual activities.
A similar preference ranking was observed for the EQ-5D-3L with self-care being more important than pain/discomfort.
The EQ-5D-5L demonstrated lower ceiling effects (range of utilities for the mildest states: 0.900-0.958 [3L] vs 0.955-0.965 [5L]) and better consistency of mean transition utilities across the range of scale. Changing “confined to bed” (3L) to
“unable to walk”(5L) had a large positive impact on utilities. Smaller changes with more negative wording in the other dimensions (eg, “very much anxious/feeling down a lot” [3L] vs “extremely anxious/depressed” [5L]) had a modest negative impact on utilities.
Conclusion:This study developed value sets of the EQ-5D-3L and EQ-5D-5L for Hungary. Ourfindings contribute to the understanding of how the wording of descriptive systems affects the estimates of utilities.
Keywords:EQ-5D, value set, composite time trade-off, QALY, Europe.
VALUE HEALTH. 2020; 23(9):1235–1245
Introduction
Health technology assessment (HTA) is increasingly used to inform resource allocation decisions and set priorities in health- care in Hungary.1–4National bodies within the Ministry of Human Capacities and the Division for Health Technology Assessment at the National Institute for Pharmacy and Nutrition publish guide- lines and recommendations on conducting economic evaluations of health interventions.5,6In economic evaluations, health benefits of an intervention are commonly expressed in quality-adjusted life years (QALYs). The QALY is a widely used metric that cap- tures both quantity (ie, survival) and quality (ie, utility) of life into a single outcome. In Hungary, as in many other European coun- tries,7 the EQ-5D descriptive system is on the list of preferred measures to generate QALYs.8Yet the absence of country-specific value sets creates a barrier to its widespread use. In the past 2
decades, over 30 countries adopted the EQ-5D and developed their own national value sets, enabling health policy decisions to be based on the preferences of the population they are serving.9,10 The EQ-5D consists of a 5-item descriptive system and a self- rating of overall health status on a 0-100 visual analog scale (EQ VAS).11,12The descriptive system has 2 versions suitable for adults, the EQ-5D-3L and EQ-5D-5L (hereafter 3L and 5L) that both measure health status on 5 dimensions: mobility (MO), self-care (SC), usual activities (UA), pain/discomfort (PD), and anxiety/
depression (AD). In the 3L, each dimension has 3 levels of severity:
no problems, some/moderate problems, and confined to bed/un- able to/extreme problems. For the 5L, the levels of severity are expanded from 3 to 5: no problems, slight problems, moderate problems, severe problems, and unable to/extreme problems.13
In most language versions, 2 important changes in wording of the labels were introduced in the 5L version, which included using
* Address correspondence to: Fanni Rencz, MD, MSc, PhD, Department of Health Economics, Corvinus University of Budapest, 8 F}ovám tér, H-1093, Budapest, Hungary. Email:fanni.rencz@uni-corvinus.hu
1098-3015 - see front matter Copyrightª2020, ISPOR–The Professional Society for Health Economics and Outcomes Research. Published by Elsevier Inc. This is an open access article under the CC BY-NC-ND license (http://creativecommons.org/licenses/by-nc-nd/4.0/).
“unable to walk” (5L) instead of “confined to bed” (3L) in the descriptor of the most severe level of MO and standardizing the middle levels to consistently use moderate (5L) in all di- mensions.13In addition to these changes, there are a number of other differences between the Hungarian 3L and 5L versions that affect both modifiers (eg,“very strong”[3L] vs“extreme”[5L]) and descriptors (eg,“anxiety/feeling down” [3L] vs“anxiety/depres- sion”[5L]) (seeAppendix 1 in Supplemental Materials found at https://doi.org/10.1016/j.jval.2020.03.019). Of the 15 matched la- bels, the 5L uses words with more negative meaning in 8 cases, whereas in 1 case a more severe problem appears in the 3L descriptive system (ie, confined to bed).
Changes in wording of the EQ-5D may affect self-reporting of health as well as health state valuations. Few parallel 3L and 5L valuations have been carried out to date, and very limited evi- dence is available on how changes in wording are reflected by health state valuations.14–17 Therefore, the primary objective of this study was to develop country-specific 3L and 5L value sets for Hungary in a parallel valuation study. Secondarily, we aimed to add to the literature in comparing the 3L and 5L value set char- acteristics and analyzing the impact on utilities of wording dif- ferences in the descriptive systems.
Methods
Study Design
The study followed the criteria on the Checklist for Reporting Valuation Studies of the EQ-5D.18 Data were collected via computer-assisted personal interviews between May 2018 and March 2019. The latest available version of EuroQol Valuation Technique (EQ-VT) was used for this study (version 2.1).19As a methodological add-on to this protocol, a 3L valuation was embedded in the design. In 2017, exactly the same valuation framework was used in the United States.15,20,21 The study received approval from the Scientific and Ethical Committee of the Medical Research Council (reference no. 12006-2/2018/EKU) prior to data collection. The target sample size was 1000 respondents complying with the EuroQol Group’s valuation protocol.22
A non-probability quota sampling was used, and quotas were set for age and sex according to the latest data reported by the Hungarian Central Statistical Office.23 Inclusion criteria to the study were (1) aged$18 years, (2) cognitive ability to read and interpret questions, and (3) signed an informed consent form.
Participation in the study was voluntary and no remuneration was provided. The interviewer team comprised 12 university students studying economics or medicine and 1 of the principal in- vestigators (seeAppendix 2in Supplemental Materials found at https://doi.org/10.1016/j.jval.2020.03.019). Over the entire data collection period, interviewer performance was monitored as a part of the quality-control procedure developed by the EuroQol Group.24 Details of the quality-control process are available in Appendix 3in Supplemental Materials found athttps://doi.org/1 0.1016/j.jval.2020.03.019.
Health State Selection
A detailed description of 3L and 5L health state selections is reported elsewhere15,25; however, it is briefly summarized here.
Two preference elicitation techniques, the composite time trade- off (cTTO) and discrete choice experiment (DCE), were used. The study design included a set of 30 (3L) health states divided into 10 cTTO blocks, 86 (5L) states divided into 10 cTTO blocks, and 196 pairs of 5L health states divided into 28 DCE blocks of 7 pairs.
Blocks as well as the order of health states within the blocks were
presented in a random order both for the cTTO and DCE. Each 3L block contained 3 health states, and the pits state (33333) appeared only in 1 of the 10 3L blocks. Each 5L block contained 10 health states including the pits state (55555) and 1 of the mildest states (21111, 12111, 11211, 11121, or 11112). The DCE data collected are not used in the present study. The interview tasks are pre- sented inAppendix 2in Supplemental Materials found athttps://
doi.org/10.1016/j.jval.2020.03.019.
Composite Time Trade-Off
The cTTO approach combines conventional 10-year TTO for health states considered better than dead (BTD) and lead-time TTO (ie, 10 years in full heath followed by 10 years in a less than healthy EQ-5D state) for health states considered worse than dead (WTD).26The cTTO utilities in this study ranged between -1 and 1 and were calculated according to the following formulas:
BTD responses: U¼t=10 WTD responses: U¼ ðt210Þ=10
where U is the utility and t is the number of years required in full health.
Data Analysis
Descriptive statistics of the sample characteristics and cTTO utilities were computed. No exclusions were made on the basis of data quality, inconsistent responses (ie, a higher utility is attached to a health state that is unambiguously more severe than another), or non-trading (ie, assigning a utility of 1 to all health states). In line with former valuation studies,27–295L cTTO responsesflagged by respondents in the feedback module were excluded. The effect of the re-inclusion of these responses was assessed through a sensitivity analysis. Data management and statistical analyses were performed using STATA 13.0 (StataCorp LP, College Station, TX) and R version 3.6.1 (The R Foundation for Statistical Computing, Vienna, Austria). For all analyses, aPvalue,.05 was taken as statistically significant.
Modeling
The cTTO utilities for health states described by the 3L and 5L were modeled separately. The dependent variable consisted of the cTTO utility elicited. Main effects models including 10 and 20 dummy-coded parameters were applied both for the 3L and 5L, respectively. A dummy was created for each level of health in respect of each dimension, whereby level 1 was considered the reference category. Both for 3L and 5L, we estimated 4 regression model ver- sions: a pooled homoscedastic linear model (model 1); a pooled heteroscedastic linear model (model 2); a pooled homoscedastic Tobit model, left-censored at -1 (model 3); and a pooled hetero- scedastic Tobit model, left-censored at -1 (model 4). All models were estimated by maximum likelihood using the R package crch.30To account for the non-zero covariances between error terms clustered within individuals (resulting from the repeated measure design), we calculated robust standard errors using the clustered covariance estimator incorporated to the R package sandwich.31
We considered multiple criteria for model selection, including theoretical considerations (eg, the censored nature of cTTO utili- ties and heteroscedasticity), the number of illogical and insignif- icant parameters, and prediction accuracy (eg, Pearson’s and Spearman’s correlations between predicted and observed utilities, mean absolute error between predicted and observed utilities, and proportion of health states with absolute prediction errors greater
than 0.05 and 0.1.) The preferred model was selected in favor of accounting for the censored nature of cTTO utilities (ie, prefer- ences of certain respondents may be even lower than -1),32ac- commodating heteroscedasticity stemming from the variation of cTTO utilities between the mild and severe health states,33and reducing the number of illogical and insignificant parameters. The intercept was interpreted as the utility decrement associated with any deviation from full health. For the final value sets, it was decided to constrain the intercept to be equal to 1 (full health) if it was insignificant.
Comparing the Characteristics of the 3L and 5L Value Sets Building on the methodology described by previous studies,14,34the 2final value sets (model 4 [3L] and model 5 [5L]) were compared across a number of characteristics. For the ana- lyses, levels 3 and 5 on the 5L were considered as matched levels for levels 2 and 3 on the 3L.14For example, 12111 (3L) and 13111 (5L) are matched health states.
Ceiling effects in the context of health state valuations were examined by directly comparing the mildest 3L and 5L health states.14For the mildest and most severe health states, differences in changes in single-level transition utilities between adjacent 3L, 5L, and matched 5L states were compared (ie, decrease in utility from 11111 or increase from the pits state).34Single-level transi- tion utilities between adjacent 3L and adjacent 5L corner health states (ie, health states described by an unhealthy level in 1 dimension, and no problems in all others) were computed. Then, differences were calculated in single-level transition utilities be- tween 3L and matched 5L health states.14,34
A Kernel density plot was created to visualize the modality of the distributions of utilities for 3L (n = 243), 5L (n = 3125) and matched 5L health states (n = 243). The 2 models were further compared with respect to parameter estimates, order of dimen- sion importance, range of utilities, and proportion of health states valued as WTD. The agreement between matched utilities of the 2 models was examined using a Bland-Altman plot.35
Overall, mean transition utilities were computed for the 3L and 5L by averaging all single-level mean transition utilities of the 243 (3L) and 3125 (5L) health states.36,37To estimate single-level mean transition utilities for a health state (referred to here as the baseline health state), all possible single-level movements to adjacent from that given state were estimated. For example, all possible single-level transitions from the baseline state of 44444 included 5 possible transitions to a better state (34444, 43444, 44344, 44434, and 44443) and 5 transitions to a worse state Table 1. Characteristics of the sample.
Variables n % General
population (%)24,51
Proportional difference (%) Sex
Female 533 53.3 53.1 0.2
Male 467 46.7 46.9 -0.2
Age (years)
18-24 100 10.0 10.0 0
25-34 152 15.2 15.2 0
35-44 194 19.4 19.5 -0.1
45-54 164 16.4 16.0 0.4
55-64 164 16.4 16.8 -0.4
65-74 130 13.0 13.0 0
751 96 9.6 9.5 0.1
Highest level of education Primary
school or less
157 15.7 23.8 -8.1
Secondary school*
502 50.2 55.0 -4.8
College/
university degree
341 34.1 21.2 12.9
Place of residence
Capital 348 34.8 17.9 16.9
Other town 454 45.4 52.6 -7.2
Village 198 19.8 29.5 -9.7
Geographical region†
Central Hungary 533 53.3 30.4 22.9
Transdanubia 177 17.7 30.2 -12.5
Great Plain and North
290 29.0 39.5 -10.5
Employment status‡
Employed 620 62.0 53.1 8.9
Unemployed 10 1.0 3.1 -2.1
Retired 250 25.0 26.1 -1.1
Disability pensioner
26 2.6 3.1 -0.5
Student 75 7.5 4.7 2.8
Homemaker/
housewife
19 1.9 1.0 0.9
Marital status
Single 239 23.9 18.5 5.4
Married 419 41.9 45.6 -3.7
Domestic partnership
137 13.7 13.4 0.3
Divorced 83 8.3 11.1 -2.8
Widowed 122 12.2 11.4 -0.8
3L EQ VAS (mean, SD)§
82.5 13.2 71.6 10.9
5L EQ VAS (mean, SD)
81.6 13.8 N/A -
Self-perceived health status
Excellent 135 13.5 N/A -
Very good 322 32.2 N/A -
Good 374 37.4 N/A -
Fair 154 15.4 N/A -
Poor 15 1.5 N/A -
Continued in the next column
Table 1.Continued
Variables n % General
population (%)24,51
Proportional difference (%) History of
chronic illness
Yes 559 55.9 45.0 10.9
No 426 42.6 55.0 -12.4
Refused to answer
15 1.5 N/A -
N/A indicates data not available; VAS, visual analog scale.
*With completedfinal exam or professional certificate.
†For the general population,figures represent the population aged 15 or over.
‡The sum of the general population is,100% owing to an other category accounting for 8.9%.
§Year of data collection was 2000.52
(54444, 45444, 44544, 44454, and 44445). The absolute differ- ences in utilities between each single-level transition utility and their baseline health state were calculated and averaged to obtain a single mean transition utility for every baseline health state. In total there were 1 620 (3L) and 25 000 (5L) single-level transitions, respectively. Four separate analyses were carried out: (1) single- level transitions for all 3L states, (2) single-level transitions for all 5L states, (3) single-level transitions for all matched 5L states, and (4) 2-level transitions for 5L states.14
The relationship between mean transition and baseline utilities was estimated by using ordinary least squares regression with standard errors adjusted for heteroscedasticity. All transition utilities were plotted against baseline 3L or 5L utilities to illustrate the
consistency of transition utilities by misery scores (ie, the sum of the levels across dimensions ranging from 5 to 15 [3L] or 25 [5L]).
Within the context of the QALY model, utilities are measured on an interval scale, where the same change in health status is expected to represent the same, irrespective of the part of the scale being considered.38Thus, in general, the more consistent the mean tran- sition utilities on the entire scale, the better the instrument is.
Results
Respondent Characteristics
A total of 1000 respondents, representative of the Hungarian general population for age and sex, were successfully interviewed.
Table 2. Parameter estimates of the Hungarian EQ-5D-3L value set.
Model 1 Pooled linear
model, homoscedastic
Model 2 Pooled linear model, heteroscedastic
Model 3 Pooled Tobit model, homoscedastic
Model 4 Pooled Tobit model,
heteroscedastic (value set)‡
b SE P
value* b SE P
value* b SE P
value* b SE P
value*
Intercept† 0.961 0.015 .012 0.979 0.008 .009 0.965 0.016 .028 0.980 0.008 .013
MO2 -0.026 0.014 .061 -0.022 0.008 .008 -0.025 0.014 .080 -0.022 0.008 .006
MO3 -0.596 0.026 ,.001 -0.619 0.028 ,.001 -0.611 0.027 ,.001 -0.648 0.031 ,.001
SC2 -0.064 0.017 ,.001 -0.051 0.009 ,.001 -0.064 0.017 ,.001 -0.051 0.009 ,.001
SC3 -0.318 0.020 ,.001 -0.347 0.020 ,.001 -0.328 0.021 ,.001 -0.355 0.022 ,.001
UA2 0.003 0.016 .852 -0.024 0.008 .004 0.003 0.016 .853 -0.025 0.008 .003
UA3 -0.229 0.019 ,.001 -0.243 0.019 ,.001 -0.234 0.019 ,.001 -0.246 0.021 ,.001
PD2 -0.093 0.014 ,.001 -0.081 0.010 ,.001 -0.093 0.015 ,.001 -0.080 0.010 ,.001
PD3 -0.322 0.019 ,.001 -0.334 0.018 ,.001 -0.328 0.020 ,.001 -0.338 0.019 ,.001
AD2 -0.069 0.018 ,.001 -0.077 0.011 ,.001 -0.070 0.018 ,.001 -0.078 0.011 ,.001
AD3 -0.249 0.019 ,.001 -0.257 0.019 ,.001 -0.253 0.020 ,.001 -0.258 0.020 ,.001
Illogical parameters 1 0 1 0
Insignificant parameters (P$.05)
2 0 2 0
MAE (predicted vs observed)
0.034 0.033 0.035 0.036
Health states .j0.05j, n (%)
7 of 30 (23.3) 4 of 30 (13.3) 4 of 30 (13.3) 5 of 30 (16.7)
Health states .j0.10j, n (%)
1 of 30 (3.3) 2 of 30 (6.7) 2 of 30 (6.7) 2 of 30 (6.7)
Pearson’s correlation (predicted vs observed)
0.995 0.994 0.995 0.994
Spearman’s correlation (predicted vs observed)
0.990 0.993 0.991 0.992
Dimension importance MO.PD.SC.AD.UA MO.SC.PD.AD.UA MO.PD.SC.AD.UA MO.SC.PD.AD.UA No. (%) of health
states WTD
53 (21.8) 58 (23.9) 54 (22.2) 63 (25.9)
U (11111) 0.961 0.979 0.965 0.980
U (22222) 0.712 0.724 0.716 0.724
U (33333) -0.753 -0.821 -0.789 -0.865
Mean utilities (SD) 0.307 (0.368) 0.294 (0.387) 0.297 (0.378) 0.280 (0.400)
Median utilities (IQR) 0.326 (0.547) 0.325 (0.578) 0.320 (0.565) 0.311 (0.601)
AD indicates anxiety/depression; IQR, interquartile range; MAE, mean absolute error; MO, mobility; SC, self-care; PD, pain/discomfort; SE, standard error; UA, usual activities; WTD, worse than dead.
*Pvalues indicate the incremental disutility from the preceding level.
†Pvalues for the intercept refer to the difference between the intercept and 1.
‡Example for using the Hungarian EQ-5D-3L value set: the predicted utility value for state 12321 is 0.980-0-0.051-0.246-0.080-0 = 0.603.
In total, 1177 potential respondents were approached (response rate 85%). Reasons for interview failure are provided inAppendix 4 in Supplemental Materials found at https://doi.org/10.1016/j.
jval.2020.03.019.
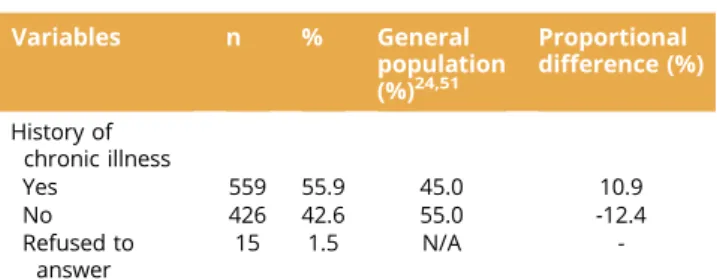
The characteristics of the sample are summarized inTable 1.
The distribution of the sample in marital status, employment status, and area of residence reasonably approximated that of the general population. Higher-educated respondents and inhabitants of Central Hungary were slightly overrepresented.
Data Characteristics
There were no missing responses for any valuation task resulting in a total of 3000 (3L) and 10 000 (5L) cTTO responses from 1000 respondents. Aflowchart presenting an overview of the results of the 5L quality-control process is provided inAppendix 3 in Supplemental Materials found athttps://doi.org/10.1016/j.jval.2 020.03.019. Before the feedback module, a total of 196 (19.6%) respondents had at least 1 inconsistent 5L response. In the feed- back module, 634 cTTO responses were removed by 481 (48.1%) respondents. The proportion of respondents with logical in- consistencies was reduced to 70 (7.0%) after the feedback module.
Thus, data analysis included 9366 (5L) cTTO observations from 1000 respondents.
For the 3L, logical inconsistencies occurred in 13 (1.3%) of the respondents. No feedback module was built into the EQ-VT for reconsideration of 3L responses, thus we included all the 3000 (3L) responses in the data analysis. Distribution and summary statistics of the observed cTTO utilities for the 3L and 5L are presented in Appendices 5, 6,and7 in Supplemental Materials found athttps://doi.org/10.1016/j.jval.2020.03.019.
EQ-5D-3L Value Set
The 3L model results are presented inTable 2. In model 1 (3L) and model 3 (3L), the estimates for UA2 were both insignificant and illogically ordered from UA1, and in addition the difference between MO1 and MO2 was insignificant. In model 2 (3L) and model 4 (3L), all coefficients were consistent with the monotonic nature of the descriptive system and statistically significant from the preceding level. In these 2 models, only 2 (6.7%) of the pre- dicted 30 health state utilities differed from observed utilities by more than 0.10. Model 4 (3L) was selected as thefinal value set on the basis of considerations outlined in the Methods section, such as handling left-censored data, accounting for heteroscedasticity and logical ordering, and statistical significance of parameters.
EQ-5D-5L Value Set
The parameter estimates and prediction accuracy of the 5L models are shown inTable 3. For all models, every coefficient was consistent; however, UA5 and PD3 in model 1 (5L), UA5 in model 2 (5L), and PD3 in models 3 (5L) and 4 (5L) were insignificant. Model 4 (5L) produced a slight improvement in prediction accuracy. In this model, utilities for 2 (2.3%) of 86 heath states differed by more than 0.10 from their observed utilities. The parameter of the intercept did not differ significantly from 1. A constrained version of model 4 (5L) was selected as thefinal value set (model 5 [5L]).
Sensitivity analysis indicated no significant impact of exclusions on parameter estimates.
Comparison of 3L and 5L Value Sets
A comparison of the matched regression parameters of the 2 value sets (model 4 [3L] vs model 5 [5L]) is presented inAppendix 8 in Supplemental Materials found at https://doi.org/10.1016/j.
jval.2020.03.019. The 3L parameter estimates were higher (less negative) for all matched levels, with the exception of the most
severe level of MO and the middle level of PD. A good concordance was observed in the preference ranking of the 5 dimensions; MO was consistently placed the most, while UA the least important (Tables 2and3). The proportion of health states valued as WTD was higher for the 3L (25.9% [3L] vs 21.7% [5L]). The 3L value set demonstrated lower minimum utility compared with 5L (-0.865 [3L] vs -0.848 [5L]). The 5L demonstrated lower ceiling effects (range of utilities for the mildest states: 0.900-0.958 [3L] vs 0.955- 0.965 [5L]) (Table 4).
Figure 1depicts the Kernel density estimates of all attainable 3L, 5L, and matched 5L utilities. Distribution of the 5L was unimodal, whereas the 3L had few clusters. A higher density of the 3L compared with 5L was demonstrated on both ends of the utility scale. Of the 243 matched health states, 160 (65.8%) showed a higher utility for the 3L, while 83 (34.2%) for the 5L. The Bland- Altman plot (Fig. 2) indicated a good level of agreement be- tween 3L and matched 5L utilities. Of the 81 matched pairs in which the most severe level of MO was affected, 77 (95.1%) indi- cated a lower utility for the 3L. Conversely, a higher 3L utility was predicted in 156 (96.3%) of the other 162 health states.
Comparison of Transitions From 11111 and the Pits State For the mildest health states, differences in single-level tran- sition utilities from 11111 between 3L and unmatched 5L ranged from 0.035 to 0.045 (seeAppendix 9in Supplemental Materials found at https://doi.org/10.1016/j.jval.2020.03.019). The largest difference between the 3L and matched 5L states was found for MO: 0.022 (3L) versus 0.089 (5L). Unmatched differences in single-level transition utilities from the pits state were consider- ably larger for the 3L (range: -0.626 to -0.180) compared with 5L (-0.192 to -0.059). Matched differences in single-level transition utilities from pits between 3L and 5L health states were of similar size for all dimensions with the exception of MO (“confined to bed”[3L]: -0.626 vs“unable to walk”[5L]: -0.366).
Comparison of Transitions for Adjacent Corner States Single-level transitions between adjacent corner states for the 2 value sets are compared inTable 4. In all dimensions, the largest differences in utilities occurred between levels 2 and 3 for the 3L and between levels 3 and 4 for the 5L with the exception of MO (5L). The transition utilities well reflected the divergence of wording between the 2 descriptive systems. The largest difference was found for the most severe level of MO (“confined to bed” [3L] vs “unable to walk” [5L]: 0.260). In all but 1 matched middle or extreme level categories where the 5L uses a more negative word (middle levels of MO, SC, UA, and AD, and the extreme levels of PD and AD), differences between levels were larger for the 5L. Changing the descriptor “feeling down” (3L) to“depressed” (5L) parallel to changing the adjec- tives “a little” (3L) and “a lot” (3L) to “moderately” (5L) and
“extremely” (5L), respectively, had a small negative impact on single-level transition utilities (matched middle level -0.015 and extreme level -0.067).
Comparison of Mean Transition Utilities
Appendix 10in Supplemental Materials found at https://doi.
org/10.1016/j.jval.2020.03.019displays the mean single-level 3L, 5L, matched 5L and 2-level transition utilities as a function of their respective baseline utilities. Mean 6 SD single-level transition utility of all possible health states was substantially higher for the 3L (0.18560.049) compared with the 5L (0.09260.021). Mean single-level transition utilities were larger by, on average, 0.097 (3L) and 0.043 (5L) for every 1-point decrease in utilities (P,.0001). Likewise, a significant negative relationship was found
Table 3. Parameter estimates of the Hungarian EQ-5D-5L value set.
Model 1
Pooled linear model, homoscedastic
Model 2
Pooled linear model, heteroscedastic
b SE Pvalue* b SE Pvalue*
Intercept† 1.002 0.014 .912 1.009 0.007 .229
MO2 -0.051 0.013 ,.001 -0.047 0.008 ,.001
MO3 -0.113 0.014 ,.001 -0.117 0.014 ,.001
MO4 -0.289 0.014 ,.001 -0.282 0.014 ,.001
MO5 -0.434 0.014 ,.001 -0.427 0.014 ,.001
SC2 -0.041 0.012 ,.001 -0.053 0.007 ,.001
SC3 -0.079 0.014 .013 -0.089 0.010 .001
SC4 -0.252 0.018 ,.001 -0.243 0.016 ,.001
SC5 -0.313 0.012 ,.001 -0.326 0.014 ,.001
UA2 -0.037 0.013 .004 -0.043 0.007 ,.001
UA3 -0.081 0.017 .005 -0.087 0.013 .001
UA4 -0.209 0.013 ,.001 -0.222 0.012 ,.001
UA5 -0.228 0.012 .212 -0.240 0.013 .315
PD2 -0.057 0.011 ,.001 -0.051 0.007 ,.001
PD3 -0.084 0.014 .117 -0.085 0.014 .028
PD4 -0.281 0.015 ,.001 -0.284 0.014 ,.001
PD5 -0.377 0.014 ,.001 -0.398 0.017 ,.001
AD2 -0.043 0.014 .002 -0.045 0.006 ,.001
AD3 -0.122 0.018 ,.001 -0.112 0.014 ,.001
AD4 -0.282 0.014 ,.001 -0.268 0.013 ,.001
AD5 -0.316 0.013 .028 -0.315 0.012 ,.001
Illogical parameters 0 0
Insignificant parameters (P$.05) 2 1
MAE (predicted vs observed) 0.033 0.032
Health states.j0.05j, n (%) 20 of 86 (23.3) 18 of 86 (20.9)
Health states.j0.10j, n (%) 4 of 86 (4.7) 3 of 86 (3.5)
Pearson’s correlation (predicted vs observed) 0.994 0.994
Spearman’s correlation (predicted vs observed) 0.990 0.991
Dimension importance MO.PD.AD.SC.UA MO.PD.SC.AD.UA
No. (%) of health states WTD 592 (18.9) 606 (19.4)
U (11111) 1.002 1.009
U (33333) 0.523 0.519
U (55555) -0.666 -0.697
Mean utilities (SD) 0.264 (0.294) 0.262 (0.296)
Median utilities (IQR) 0.275 (0.415) 0.275 (0.420)
AD indicates anxiety/depression; IQR, interquartile range; MAE, mean absolute error; MO, mobility; PD, pain/discomfort; SC, self-care; SE, standard error; UA, usual activities; WTD, worse than dead.
*Pvalues indicate the incremental disutility from the preceding level.
†Pvalues for the intercept represent the difference between the intercept and 1.
‡Example for using the Hungarian EQ-5D-5L value set: the predicted utility value for state 12345 is 1-0-0.045-0.085-0.288-0.340 = 0.242.
Table 3.Continued
Model 3
Pooled Tobit model, homoscedastic
Model 4
Pooled Tobit model, heteroscedastic
Model 5
Pooled Tobit model,
heteroscedastic, constrained (value set)‡
b SE Pvalue* b SE Pvalue* b SE Pvalue*
1.003 0.014 .827 1.005 0.007 .498 1.000 - -
-0.045 0.013 ,.001 -0.038 0.008 ,.001 -0.035 0.006 ,.001
-0.100 0.014 ,.001 -0.090 0.014 ,.001 -0.089 0.013 ,.001
-0.278 0.014 ,.001 -0.264 0.014 ,.001 -0.263 0.014 ,.001
-0.445 0.014 ,.001 -0.455 0.015 ,.001 -0.455 0.015 ,.001
-0.040 0.012 .001 -0.048 0.007 ,.001 -0.045 0.005 ,.001
-0.078 0.015 .016 -0.088 0.010 ,.001 -0.089 0.010 ,.001
-0.251 0.018 ,.001 -0.242 0.016 ,.001 -0.241 0.016 ,.001
-0.337 0.013 ,.001 -0.366 0.016 ,.001 -0.366 0.016 ,.001
-0.034 0.013 .007 -0.038 0.007 ,.001 -0.035 0.004 ,.001
-0.081 0.017 .004 -0.086 0.013 ,.001 -0.085 0.013 ,.001
-0.208 0.013 ,.001 -0.219 0.012 ,.001 -0.217 0.012 ,.001
-0.250 0.012 .008 -0.277 0.014 .002 -0.276 0.014 .001
-0.053 0.011 ,.001 -0.046 0.006 ,.001 -0.043 0.005 ,.001
-0.082 0.014 .099 -0.073 0.014 .084 -0.073 0.014 .038
-0.286 0.015 ,.001 -0.287 0.014 ,.001 -0.288 0.014 ,.001
-0.391 0.015 ,.001 -0.413 0.018 ,.001 -0.411 0.018 ,.001
-0.042 0.014 .003 -0.042 0.006 ,.001 -0.040 0.005 ,.001
-0.115 0.019 ,.001 -0.095 0.014 ,.001 -0.093 0.014 ,.001
-0.281 0.014 ,.001 -0.262 0.013 ,.001 -0.261 0.013 ,.001
-0.329 0.013 .003 -0.341 0.013 ,.001 -0.340 0.013 ,.001
0 0 0
1 1 0
0.032 0.032 0.032
16 of 86 (18.6) 17 of 86 (19.8) 17 of 86 (19.8)
3 of 86 (3.5) 2 of 86 (2.3) 2 of 86 (2.3)
0.994 0.993 0.993
0.991 0.993 0.993
MO.PD.SC.AD.UA MO.PD.SC.AD.UA MO.PD.SC.AD.UA
623 (19.9) 676 (21.6) 677 (21.7)
1.003 1.005 1.000
0.513 0.573 0.571
-0.703 -0.847 -0.848
0.256 (0.296) 0.251 (0.317) 0.251 (0.318)
0.269 (0.420) 0.266 (0.448) 0.265 (0.449)
Table 4. Comparison of adjacent corner health states for changes.
Exact wording in Hungarian translated to English
3L state
3L utility
Diff. [A] Exact wording in Hungarian translated to English
5L state
5L utility
Diff. [B] Diff. [C] More negative word
Diff.
[A]-[C]*
MO No problems in walking about
11111 1.000 No problems in
walking about
11111 1.000 Id.
Slight problems in walking about
21111 0.965 0.035 Someproblems in
walking about
21111 0.958 0.022 Moderateproblems in walking about
31111 0.911 0.054 0.089 5L -0.067
Severe problems in walking about
41111 0.737 0.174 Confined to bed 31111 0.332 0.626 Unable to walk
about
51111 0.545 0.192 0.366 3L 0.260
SC No problems with self-care
11111 1.000 No problems
washing or dressing
11111 1.000 Id.†
Slight problems washing or dressing
12111 0.955 0.045
Someproblems with washing or dressing
12111 0.929 0.051 Moderateproblems washing or dressing
13111 0.911 0.044 0.089 5L -0.038
Severe problems washing or dressing
14111 0.759 0.152
Unable to wash or dress
13111 0.625 0.304 Unable to wash or dress
15111 0.634 0.125 0.277 Id. 0.027
UA No problems performing usual activities
11111 1.000 No problems doing
usual activities
11111 1.000 Id.
Slight problems doing usual activities
11211 0.965 0.035 Someproblems with
performing usual activities
11211 0.922 0.058 Moderateproblems doing usual activities
11311 0.915 0.050 0.085 5L -0.027
Severe problems doing usual activities
11411 0.783 0.132 Unable to perform
usual activities
11311 0.734 0.188 Unable to do usual activities
11511 0.724 0.059 0.191 Id. -0.003
PD No pain or discomfort
11111 1.000 No pain or
discomfort
11111 1.000 Id.
Slight pain or discomfort
11121 0.957 0.043
Moderate pain ora littlediscomfort
11121 0.900 0.080 Moderate pain or moderate discomfort
11131 0.927 0.030 0.073 5L 0.007
Severe pain or discomfort
11141 0.712 0.215
Very strongpain or very large discomfort
11131 0.642 0.258 Extremepain or extremediscomfort
11151 0.589 0.123 0.338 5L -0.080
AD Not anxious or not feeling down
11111 1.000 Not anxious or depressed
11111 1.000 5L
Slightly anxious or depressed
11112 0.960 0.040 Moderately anxious
orfeeling down a little
11112 0.902 0.078 Moderately anxious ormoderately depressed
11113 0.907 0.053 0.093 5L -0.015
Severely anxious or depressed
11114 0.739 0.168
continued on next page
between baseline 5L utilities and single-level transitions computed for matched 5L health states and for 2-level mean transition utilities.
Discussion
In this study, we determined the utilities of the 2 adult ver- sions of the EQ-5D health status questionnaire (3L and 5L) from the perspective of the general population in Hungary. In accor- dance with national HTA recommendations,6 our sample was representative of the Hungarian general population for age and sex. Up to now, only Poland (3L and 5L) and Slovenia (3L) in the Central and Eastern European region have developed TTO-based value sets.39–42 The present study overall marks a considerable achievement in taking HTA to the next level in Hungary.
Furthermore, the study created a unique opportunity to compare the characteristics of the 2 value sets derived from a common sample and to analyze the impact of differences in wording of the descriptive systems on changes in utilities.
Both for the 3L and 5L, the Hungarian value sets are based on a main effects model, because the EQ-VT design is optimized for such models.25For the 3L, model 1 (3L) and model 3 (3L) produced inconsistent estimates for UA2 owing to heteroscedasticity being present in data. Very likely the different study design of the 3L valuation exercise, in particular, the smaller proportion of mild states among the 30 (3L) states valued, resulted in a stronger heteroscedasticity for the 3L. The 5L value set outperformed the 3L in many ways, such as ceiling effects and the consistency of mean transitions across the range of baseline utilities. Acknowledging the limitations of the 3L descriptive system43–46and the Hungary- specific differences in wording, in future studies both in and outside HTA, generally the 5L descriptive system and value set are recommended to be used in Hungary. Nevertheless, the Hungarian 3L value set will be useful in many cases including clinical trials administering the 3L, studies aiming to reanalyze previously collected local 3L data, and conditions where the 3L is a more Table 4.Continued
Exact wording in Hungarian translated to English
3L state
3L utility
Diff. [A] Exact wording in Hungarian translated to English
5L state
5L utility
Diff. [B] Diff. [C] More negative word
Diff.
[A]-[C]*
Very muchanxious orfeeling down a lot
11113 0.722 0.180 Extremelyanxious orextremely depressed
11115 0.660 0.079 0.247 5L -0.067
Note. [A] difference from less severe adjacent 3L state; [B] difference from less severe adjacent 5L state; [C] difference between 3L and matched 5L states. Bold words indicate a change in the strength of adjective. Bold and underlined words indicate a change of a descriptor (ie, noun/verb) that determines the label/dimension.
AD indicates anxiety/depression; 5L, 5-level; MO, mobility; PD, pain/discomfort; SC, self-care; 3L, 3-level; UA, usual activities.
*Negative numbers indicate that differences between levels are larger for the 5L.
†Can be considered identical.
Figure 1.Kernel density plot of 3L, 5L, and matched 5L utilities.
3L indicates 3-level; 5L, 5-level.
Figure 2.Bland-Altman plot of 3L and matched 5L utilities (n = 243). The horizontal line represents the mean of the differences (d) between 3L and 5L utilities, while the 95% limits of agreement, obtained as d61.96 * SD of d, are indicated by dashed lines.
MO3/5 indicates most severe level of mobility; 3L, 3-level; 5L, 5-level.
suitable instrument to assess quality of life (eg, where the response level“confined to bed”(3L) is actually relevant for the patient population).
This is thefirst study in Europe to derive cTTO-based value sets of the 3L and 5L from a common sample. The 3L and 5L value sets for Hungary are rather close to each other in many aspects including the range of utilities and rank ordering of the 5 di- mensions. Consistently with previous studies,14,25,34changing the wording of the most severe level of mobility was responsible for the major differences seen between the 3L and 5L value sets. For most 3L and matched 5L health state pairs in which the most severe level of mobility was affected, a lower utility was demon- strated for the 3L. Thus, the large positive impact of changing
“confined to bed” (3L) to “unable to walk” (5L) exceeded the overall impact of smaller changes with more negative wording in the other 4 dimensions. It appears that the overall impact of
“confined to bed”(3L) and whether it is attenuated by other di- mensions will depend on the disease studied.
Differences in wording of the anxiety/depression dimension slightly affected the utilities (“feeling down”[3L] vs“depressed” [5L]). There seem to be 2 major reasons underlying this observa- tion. First, only a part of a composite dimension is involved by this wording change. Prior findings suggest that in valuation the composite dimension of anxiety/depression is interpreted to mean an average of anxiety and depression, but weighted more toward anxiety.47 Secondly, anxiety/depression had a lower relative importance in the ranking of dimensions in Hungary, thus its impact on utilities was modest. It is plausible that in a country where anxiety/depression is among the most important di- mensions, the impact of such a change in wording would be re- flected more markedly. Further research is warranted to investigate how the differences in wording alter people’s ratings on their own health.
The main limitations of our study are related to the valuation of 3L health states. First, each respondent valued only 3 3L health states after the 5L, and not all respondents valued the pits state or any mild state. Secondly, respondents were not informed that the last 3 health states refer to a different descriptive system. The way the respondents interpreted the 3L states may not have been how they would have interpreted them if they had not seen 5L states beforehand. Future studies may be conducted using different study designs (eg, between-sample design or dropping levels 2 and 4 of the 5L) to further explore the differences between the 3L and 5L in the context of valuation. Thirdly, DCE data were not used in developing the 5L value set, since the cTTO data alone resulted in a fully consistent 5L model. Our choice was mainly motivated by avoiding unnecessary conceptual and statistical assumptions.
Moreover, using an identical preference elicitation method to develop 3L and 5L value sets is expected to ensure consistency across HTA reports. Finally, we acknowledge that wording changes in the 3L compared to other language versions detract from the aim of methodological standardization of the EQ-5D at a supranational level. In the past 2 decades, the 3L has been administered to over 25 000 people in nearly 50 clinical and population studies in Hungary.8,48–50Being aware of the substantial collection of Hun- garian studies, we believe that a revision of the translation before this valuation study would have caused more harm than good.
Conclusion
This study developed Hungarian value sets of the EQ-5D 3L and 5L questionnaires based on cTTO valuations from the general population in Hungary. More similarities were noted between the 2 value sets than in any previous study.
Consistent with a similar study in the United States, the most severe level of mobility appeared to be responsible for the major differences seen between the 3L and 5L value sets. It is hoped that the value sets will facilitate the uptake in the use of EQ-5D in economic evaluations and the advancement of HTA in Hungary. These findings contribute to the under- standing of how the wording of descriptive systems affects the estimates of utilities.
Supplemental Material
Supplementary data associated with this article can be found in the online version athttps://doi.org/10.1016/j.jval.2020.03.019.
Article and Author Information
Accepted for Publication:March 25, 2020 Published Online:August 6, 2020
doi:https://doi.org/10.1016/j.jval.2020.03.019
Author Affiliations:Department of Health Economics, Corvinus University of Budapest, Budapest, Hungary (Rencz, Brodsky, Péntek); Hungarian Academy of Sciences, Premium Postdoctoral Research Programme, Budapest, Hungary (Rencz); Department of Experimental and Clinical Pharmacology, Medical University of Warsaw, Warsaw, Poland (Golicki);
Institute of Psychology, Doctoral School of Psychology, Eötvös Loránd University of Sciences, Budapest, Hungary (Ruzsa); Department of Statis- tics, Corvinus University of Budapest, Budapest, Hungary (Ruzsa); Depart- ment of Pharmacy Systems, Outcomes and Policy, College of Pharmacy, University of Illinois at Chicago, Chicago, IL, USA (Pickard); Patient & Health Impact, Pfizer Inc, New York, NY, USA (Law)
Author Contributions: Concept and design: Rencz, Brodszky, Gulácsi, Golicki, Pickard, Péntek
Acquisition of data:Rencz, Gulácsi, Péntek
Analysis and interpretation of data:Rencz, Brodszky, Golicki, Ruzsa, Law, Péntek
Drafting of the manuscript:Rencz, Pickard, Law, Péntek
Critical revision of the paper for important intellectual content: Rencz, Brodszky, Gulácsi, Golicki, Ruzsa, Pickard, Law
Statistical analysis:Rencz, Ruzsa, Law Provision of study materials or patients:Rencz Obtaining funding:Rencz, Péntek
Administrative, technical, or logistic support:Rencz, Gulácsi Supervision:Rencz, Péntek
Conflict of Interest Disclosures:Drs Golicki, Pickard and Law are mem- bers of the EuroQol Group, a not-for-profit organization that develops and distributes instruments that assess and value health. Dr Law is an employee and a minor shareholder of Pfizer. No other disclosures were reported.
The views expressed in the paper are the authors’and do not necessarily represent those of the EuroQol Research Foundation.
Funding/Support:Dr Rencz’s work was supported by the Premium Post- doctoral Research Programme of the Hungarian Academy of Sciences (MTA-BCE PPD 462025). This study received a grant from the EuroQol Research Foundation (EQ Project 20170500).
Role of the Funder/Sponsor:The funding agreement ensured the au- thors’independence in designing the study, interpreting the data, and preparing and publishing the manuscript.
Acknowledgment:The authors thank the EuroQol support team for the help provided throughout the project: Elly Stolk, Kristina Ludwig, Mark Oppe, Bram Roudijk, Juan M. Ramos-Goñi, Arnd J. Prause and Gerben Bakker. We thank Aki Tsuchiya (University of Sheffield) for her useful comments on an earlier draft of this manuscript. The authors are grateful for the excellent work of the interviewer team: Zita Bagdi, Péter Balázs, Alex Bató, Andrij Donilas, Szimonetta Dropsa, Dávid Fehér, Bence Horák, Balázs Jenei, Péter M. Juhász, Anna Nikl, Laura Rádi and Viktória Vig. Finally, we thank the study respondents for making this possible.
REFERENCES
1. Gulacsi L, Brodszky V, Pentek M, et al. History of health technology assess- ment in Hungary.Int J Technol Assess Health Care. 2009;25(suppl 1):120–126.
2. Gulacsi L, Rotar AM, Niewada M, et al. Health technology assessment in Poland, the Czech Republic, Hungary, Romania and Bulgaria.Eur J Health Econ. 2014;15(suppl 1):S13–S25.
3. Gulacsi L. The time for cost-effectiveness in the new European Union member states: the development and role of health economics and tech- nology assessment in the mirror of the Hungarian experience.Eur J Health Econ. 2007;8:83–88.
4. Boncz I, Sebestyen A. Financial deficits in the health services of the UK and Hungary.Lancet. 2006;368:917–918.
5. National Institute of Pharmacy and Nutrition (OGYÉI).https://www.ogyei.
gov.hu/ajanlasok. Accessed April 28, 2019.
6. Az Emberi Er}oforrások Minisztériuma szakmai irányelve az egészségügyi technológia értékelés módszertanáról és ennek keretében költséghatékony- sági elemzések készítésér}ol.Egészségügyi Közlöny. 2017;3(10):821–842.
7. Rowen D, Azzabi Zouraq I, Chevrou-Severac H, van Hout B. International regulations and recommendations for utility data for health technology assessment.Pharmacoeconomics. 2017;35:11–19.
8. Rencz F, Gulacsi L, Drummond M, et al. EQ-5D in Central and Eastern Europe:
2000-2015.Qual Life Res. 2016;25:2693–2710.
9. Devlin NJ, Brooks R. EQ-5D and the EuroQol Group: past, present and future.
Appl Health Econ Health Policy. 2017;15:127–137.
10. Roudijk B, Donders ART, Stalmeier PFM. Cultural values: can they explain differences in health utilities between countries? Med Decis Making.
2019;39(5):605–616.
11. EuroQol Group. EuroQol–a new facility for the measurement of health- related quality of life.Health Policy. 1990;16:199–208.
12. Brooks R. EuroQol: the current state of play.Health Policy. 1996;37:53–72.
13. Herdman M, Gudex C, Lloyd A, et al. Development and preliminary testing of the newfive-level version of EQ-5D (EQ-5D-5L).Qual Life Res. 2011;20:1727–1736.
14. Mulhern B, Feng Y, Shah K, et al. Comparing the UK EQ-5D-3L and English EQ-5D-5L value sets.Pharmacoeconomics. 2018;36:699–713.
15. Law EH, Pickard AS, Xie F, et al. Parallel valuation: a direct comparison of EQ- 5D-3L and EQ-5D-5L societal value sets.Med Decis Making. 2018;38:968–982.
16. Selivanova A, Buskens E, Krabbe PFM. Head-to-head comparison of EQ-5D-3L and EQ-5D-5L health values.Pharmacoeconomics. 2018;36:715–725.
17. Craig BM, Pickard AS, Rand-Hendriksen K. Do health preferences contradict ordering of EQ-5D labels?Qual Life Res. 2015;24:1759–1765.
18. Kreimeier S, Oppe M, Ramos-Goni JM, et al. Valuation of EuroQol Five- Dimensional Questionnaire, Youth Version (EQ-5D-Y) and EuroQol Five- Dimensional Questionnaire, Three-Level Version (EQ-5D-3L) health states:
the impact of wording and perspective.Value Health. 2018;21:1291–1298.
19. Xie F, Gaebel K, Perampaladas K, Doble B, Pullenayegum E. Comparing EQ-5D valuation studies: a systematic review and methodological reporting checklist.Med Decis Making. 2014;34:8–20.
20. Stolk E, Ludwig K, Rand K, van Hout B, Ramos-Goni JM. Overview, up- date, and lessons learned from the international EQ-5D-5L Valuation Work: version 2 of the EQ-5D-5L Valuation Protocol. Value Health.
2019;22:23–30.
21. Pickard AS, Law EH, Jiang R, et al. United States valuation of EQ-5D- 5L Health States using an international protocol.Value Health. 2019;22:931–941.
22. Cha AS, Law EH, Shaw JW, Pickard AS. A comparison of self-rated health using EQ-5D VAS in the United States in 2002 and 2017. Qual Life Res.
2019;28:3065–3069.
23. Oppe M, Devlin NJ, van Hout B, Krabbe PF, de Charro F. A program of methodological research to arrive at the new international EQ-5D-5L valu- ation protocol.Value Health. 2014;17:445–453.
24. Hungarian Central Statistical Office. Microcensus 2016.http://www.ksh.hu/
docs/eng/xftp/idoszaki/microcensus2016/microcensus_2016_3.pdf. Accessed February 24, 2019.
25. Ramos-Goni JM, Oppe M, Slaap B, Busschbach JJ, Stolk E. Quality control process for EQ-5D-5L valuation studies.Value Health. 2017;20:466–473.
26. Oppe M, van Hout B. The“power”of eliciting EQ-5D-5L values: the experi- mental design of the EQ-VT. EuroQol Group.http://euroqol.org/wp-content/
uploads/2016/10/EuroQol-Working-Paper-Series-Manuscript-17003-Mark- Oppe.pdf. Accessed August 19, 2019.
27. Janssen BM, Oppe M, Versteegh MM, Stolk EA. Introducing the composite time trade-off: a test of feasibility and face validity.Eur J Health Econ.
2013;14(suppl 1):S5–S13.
28. Ludwig K, Graf von der Schulenburg JM, Greiner W. German value set for the EQ-5D-5L.Pharmacoeconomics. 2018;36:663–674.
29. Hobbins A, Barry L, Kelleher D, et al. Utility values for health states in Ireland:
a value set for the EQ-5D-5L.Pharmacoeconomics. 2018;36:1345–1353.
30. Purba FD, Hunfeld JAM, Iskandarsyah A, et al. The Indonesian EQ-5D-5L value set.Pharmacoeconomics. 2017;35:1153–1165.
31. Messner JW, Mayr GJ, Zeileis A. Heteroscedastic censored and truncated regression with crch.R J. 2016;8:173–181.
32. Berger S, Graham N, Zeileis A. Various versatile variances: an object-oriented implementation of clustered covariances in R.http://EconPapers.RePEc.org/
RePEc:inn:wpaper:2017-12. Accessed January 6, 2020.
33. Versteegh MM, Vermeulen KM, Evers SMAA, et al. Dutch tariff for thefive- level version of EQ-5D.Value Health. 2016;19:343–352.
34. Feng Y, Devlin NJ, Shah KK, Mulhern B, van Hout B. New methods for modelling EQ-5D-5L value sets: an application to English data.Health Econ.
2018;27:23–38.
35. Bland JM, Altman DG. Statistical methods for assessing agreement between two methods of clinical measurement.Lancet. 1986;1:307–310.
36. Luo N, Johnson J, Coons SJ. Using instrument-defined health state transitions to estimate minimally important differences for four preference-based health-related quality of life instruments.Med Care. 2010;48:365–371.
37. McClure NS, Sayah FA, Xie F, Luo N, Johnson JA. Instrument-defined estimates of the minimally important difference for EQ-5D-5L Index scores.Value Health. 2017;20:644–650.
38. Whitehead SJ, Ali S. Health outcomes in economic evaluation: the QALY and utilities.Br Med Bull. 2010;96:5–21.
39. Golicki D, Jakubczyk M, Niewada M, Wrona W, Busschbach JJ. Valuation of EQ-5D health states in Poland:first TTO-based social value set in Central and Eastern Europe.Value Health. 2010;13:289–297.
40. Golicki D, Niewada M, Hout BV, Janssen MF, Pickard AS. Interim EQ-5D-5L value set for Poland:first crosswalk value set in Central and Eastern Europe.Value Health Reg Issues. 2014;4:19–23.
41. Golicki D, Jakubczyk M, Graczyk K, Niewada M. Valuation of EQ-5D-5L health states in Poland: thefirst EQ-VT-based study in Central and Eastern Europe.
Pharmacoeconomics. 2019;37:1165–1176.
42. Prevolnik Rupel V, Srakar A, Rand K. Valuation of EQ-5D-3L health states in Slovenia: VAS based and TTO based value sets.Slovenian J Public Health.
2019;59:8–17.
43. Buchholz I, Janssen MF, Kohlmann T, Feng YS. A systematic review of studies comparing the measurement properties of the three-level andfive-level versions of the EQ-5D.Pharmacoeconomics. 2018;36:645–661.
44. Janssen MF, Pickard AS, Golicki D, et al. Measurement properties of the EQ- 5D-5L compared to the EQ-5D-3L across eight patient groups: a multi- country study.Qual Life Res. 2013;22:1717–1727.
45. Janssen MF, Bonsel GJ, Luo N. Is EQ-5D-5L better than EQ-5D-3L? A head-to- head comparison of descriptive systems and value sets from seven countries.
Pharmacoeconomics. 2018;36:675–697.
46. Devlin N, Brazier J, Pickard AS, Stolk E3L. 5L, what the L? A NICE conundrum.
Pharmacoeconomics. 2018;36:637–640.
47. Mullett TL, McDonald R, Tsuchiya A. Understanding the composite di- mensions of the EQ-5D: an experimental approach. Presented at: EuroQol 35th Plenary Meeting; September 19-21, 2018; Lisbon, Portugal.
48. Zrubka Z, Rencz F, Zavada J, et al. EQ-5D studies in musculoskeletal and connective tissue diseases in eight Central and Eastern European countries: a systematic literature review and meta-analysis.Rheumatol Int. 2017;37:1957–
1977.
49. Zrubka Z, Beretzky Z, Hermann Z, et al. A comparison of European, Polish, Slovenian and British EQ-5D-3L value sets using a Hungarian sample of 18 chronic diseases.Eur J Health Econ. 2019;20:119–132.
50. Batog P, Rencz F, Pentek M, et al. EQ-5D studies in cardiovascular diseases in eight Central and Eastern European countries: a systematic review of the literature.Kardiol Pol. 2018;76:860–870.
51. KSH A.2014-ben végrehajtott Európai lakossági egészségfelmérés (ELEF) ered- ményei; 2018.
52. Szende A, Nemeth R. Health-related quality of life of the Hungarian popu- lation.Orv Hetil. 2003;144:1667–1674.