https://doi.org/10.1007/s10198-021-01424-8 ORIGINAL PAPER
Measuring the acceptability of EQ‑5D‑3L health states for different ages: a new adaptive survey methodology
Zoltán Hermann1,2 · Márta Péntek3 · László Gulácsi3,4 · Irén Anna Kopcsóné Németh5 · Zsombor Zrubka3,4
Received: 1 February 2021 / Accepted: 21 December 2021
© The Author(s) 2022
Abstract
Background Acceptable health and sufficientarianism are emerging concepts in health resource allocation. We defined acceptability as the proportion of the general population who consider a health state acceptable for a given age. Previous studies surveyed the acceptability of health problems separately per EQ-5D-3L domain, while the acceptability of health states with co-occurring problems was barely explored.
Objective To quantify the acceptability of 243 EQ-5D-3L health states for six ages from 30 to 80 years: 1458 health state–age combinations (HAcs), denoted as the acceptability set of EQ-5D-3L.
Methods In 2019, an online representative survey was conducted in the Hungarian general population. We developed a novel adaptive survey algorithm and a matching statistical measurement model. The acceptability of problems was evalu- ated separately per EQ-5D-3L domain, followed by joint evaluation of up to 15 HAcs. The selection of HAcs depended on respondents’ previous responses. We used an empirical Bayes measurement model to estimate the full acceptability set.
Results 1375 respondents (female: 50.7%) were included with mean (SD) age of 46.7 (14.6) years. We demonstrated that single problems that were acceptable separately for a given age were less acceptable when co-occurring jointly (p < 0.001).
For 30 years of age, EQ-5D-3L health states of ‘11112’ (11.9%) and ‘33333’ (1%), while for 80 years of age ‘21111’ (93.3%) and ‘33333’ (7.4%) had highest and lowest acceptability (% of population), respectively.
Conclusion The acceptability set of EQ-5D-3L quantifies societal preferences concerning age and disease severity. Its measurement profiles and potential role in health resource allocation needs further exploration.
Keywords Acceptability · EQ-5D · Societal preferences · Priority setting · Sufficientarianism JEL I10
Background and aims
The quality-adjusted life-year (QALY), by combining both the quality and length of life in a single figure became a key measure of health gains in health economic analyses [1].
For the measurement of the quality-of-life component of QALYs, the EQ-5D instrument is preferred in many coun- tries [2]. EQ-5D describes distinct health states, to which societal preferences (utility scores) are attached to quantify quality-of-life [3, 4]. Utility scores are elicited in valuation studies via methods that are rooted in multi-attribute util- ity theory, such as time-trade-off or discrete choice, which involve choices between different durations spent in full health or various disease states [2–5].
A salient feature of QALYs is their measurement invari- ance concerning the severity of disease and age, described
* Márta Péntek
pentek.marta@uni-obuda.hu
1 Institute of Economics, Centre for Economic and Regional Studies, Tóth Kálmán u 4., Budapest 1097, Hungary
2 Institute of Economics, Corvinus University of Budapest, Fővám tér 8., Budapest 1093, Hungary
3 Health Economics Research Center, Óbuda University, Bécsi út 96/b, Budapest 1034, Hungary
4 Corvinus Institute for Advanced Studies, Corvinus University of Budapest, Fővám tér 8., Budapest 1093, Hungary
5 Department of Infection Control, Medical Centre, Hungarian Defence Forces, Róbert Károly körút 44., Budapeset 1134, Hungary
by the catchy phrase “a QALY is a QALY is a QALY” [6].
However, in case of similar QALY gains, in scarce-resource settings, people prefer to treat more severe patients over less severe ones and young adults over older ones [7, 8]. Despite their simplicity and widespread use [9], QALYs do not reflect adequately these and several other preferences that matter in decision-making [9, 10]. To overcome these limita- tions, numerous improvements and alternative frameworks have been proposed [11, 12].
The normative background for using acceptable health in resource allocation has been explored by Wouters et al. [13], building on the sufficientarian theory of distributive justice [14]. The concept of acceptable health is based on the find- ing that people consider certain health problems increasingly acceptable for older ages as a normal consequence of aging [15–17]. The main idea is that the treatment of individuals in not acceptable health would enjoy priority over treating those who are in acceptable health states, while the goal would be to ensure acceptable (but not necessarily perfect) health for all [13, 18].
Acceptability and utility scores are both theoretically and quantitatively different measures of health. Although not based on standard economic theory, acceptability has been used as a measurable rating for a complex set of sub- jective judgements [19], such as the overall “goodness” of a health state. Measuring acceptability via binary yes/no questions carries as much information about a population’s judgements as continuous measures [20]. As opposed to valuation studies [4], the evaluation of acceptability does not involve choices concerning risk, no trade-off as well as no imaginations about death or different time perspectives are involved. However, instead of attaching a single util- ity value to a health state, acceptability of a health state is measured in different ages. Throughout this paper, the term
“acceptable health” will refer to the general concept, while
“acceptability” will denote a measure: the proportion of the general population, who consider a certain health state or problem acceptable for (people in) a given age. We also note that acceptability of a health state is conceptually different from the acceptability of a health intervention [21].
Acceptable health has been measured via the EQ-5D-3L instrument in several studies [15–17, 22]. EQ-5D-3L describes three levels of problems in five health domains [3]. Although EQ-5D-3L has gradually been replaced by the five-level (EQ-5D-5L) version due to its more favour- able psychometric properties [23], immense experience has been gained with EQ-5D-3L in general population surveys and clinical studies [24, 25] and its 243 health states are bet- ter suited for the evaluation of acceptability than the 3125 health states described by EQ-5D-5L.
Using traditional survey methods, the direct measure- ment of the acceptability of all EQ-5D-3L health states for several ages would require prohibitively large samples
or long questionnaires. Therefore, initial studies assessed the acceptability of problems separately in each of the five health domains. Via this method, the acceptability of all EQ-5D-3L health states could only be deduced if assuming that either (1) joint problems in multiple health domains were not acceptable at all or (2) separately acceptable problems were also acceptable when co-occurring jointly.
However, these two assumptions led to rather divergent results, so the acceptability for all EQ-5D-3L health states could not be estimated accurately so far [15–17].
The primary aim of this paper is to measure the accept- ability of all 243 EQ-5D-3L health states at 30, 40, 50, 60, 70 and 80 years of age in the Hungarian general popula- tion and develop an acceptability set for EQ-5D-3L. To estimate the acceptability of health states with problems in multiple health domains, we have developed an adaptive survey methodology and a matching statistical measure- ment model and tested whether this method delivers more accurate acceptability estimates compared to the assump- tion that separately acceptable problems are also accept- able when co-occurring jointly.
Methods
DataWe performed a cross-sectional online survey in May 2020 using quotas proportional to the ≥ 18-year-old general population in terms of age, gender, education and geo- graphical region. We planned to recruit 1200 respondents.
Participation was voluntary and anonymous, and partici- pants gave their written informed consent prior completing the questionnaire. Our study was approved by the Ethical Committee of the Medical Research Council of Hungary (ETT TUKEB; 3857-5-2019/EKU). Data were collected by a market survey company, no compensation was given for participating in the study.
Measuring acceptability
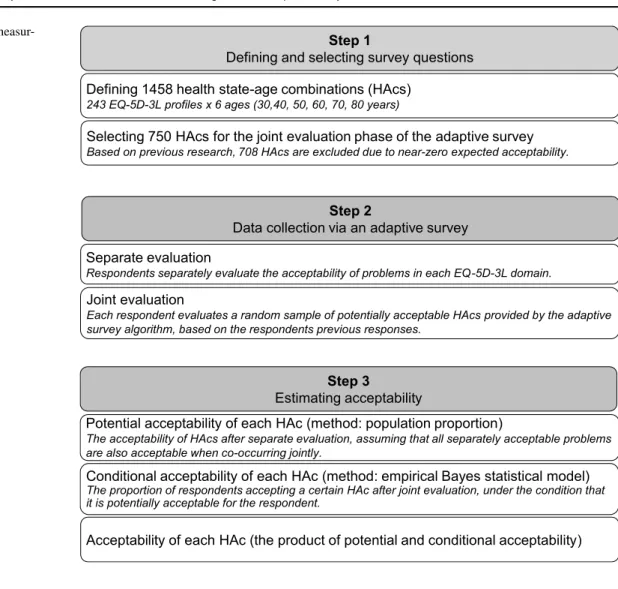
Measuring the acceptability of health states with prob- lems in multiple health domains is a stepwise process that involves (1) the selection of potential survey questions and (2) conducting an adaptive survey to boost the information content of collected data and then (3) estimating accept- ability via a statistical measurement model that mitigates the bias resulting from the adaptive survey design. The key steps of this method are summarized in Fig. 1.
Selecting potential survey questions
We evaluated acceptability using the EQ-5D-3L instrument [3]. The descriptive system of EQ-5D-3L assesses self- reported health in five domains: mobility, self-care, usual activities, pain/discomfort and anxiety/depression. In each dimension, respondents can describe their health as hav- ing: no problems (1), some problems (2) or severe problems (3), providing 243 (35) distinct health states [3]. EQ-5D-3L health states are denoted with 5-digit numbers indicating the problem levels in the five domains (e.g., 21,131 represents moderate problems with mobility and severe pain/discom- fort). The EQ-5D-3L index is a utility value attached to a health state that reflects average preferences of the general population so that 1 denotes perfect health, 0 denotes death and negative values denote worse-than-dead health states. A value set comprises the index values of all 243 health states.
To compare our results with previous studies, we applied the Dutch value set [16, 26].
To measure acceptability, we estimated the proportion of respondents who considered an EQ-5D-3L health state acceptable for ages 30, 40, 50, 60, 70 and 80 years. We will
denote a health state – age combination (HAc) with a sub- script of age attached to the EQ-5D-3L health state (e.g., 1211350). Altogether, we used 1458 HAcs (243 EQ-5D-3L health states × 6 ages) and denoted the full set of accept- ability estimates attached to them as the EQ-5D-3L accept- ability set. While we defined the acceptability of a HAc as a proportion, in case of a given respondent, acceptability of a HAc will refer to the result of a binary yes / no evaluation.
From the 1458 HAcs, we preselected 750 items with mul- tiple health problems for joint evaluation. We will denote these HAcs as the JE frame. By narrowing the question pool to the JE frame, we aimed to increase the precision of acceptability estimates. Also, respondents were allocated to predefined random question sequences of the JE frame, which allowed the mitigation of bias that resulted from the adaptive survey design (see below). The JE frame excluded 642 HAcs, that were almost universally rated as not accepta- ble in previous research [17], 60 HAcs that contain problems in only one domain and 6 HAcs denoting full health (see Online Resource 1). Although not all HAcs were included in the JE frame, the acceptability was estimated for all 1458 HAcs.
Fig. 1 The process of measur-
ing acceptability Step 1
Defining and selecting survey questions
Step 2
Data collection via an adaptive survey
Step 3
Estimating acceptability Defining 1458 health state-age combinations (HAcs)
243 EQ-5D-3L profiles x 6 ages (30,40, 50, 60, 70, 80 years)
Selecting 750 HAcs for the joint evaluation phase of the adaptive survey
Based on previous research, 708 HAcs are excluded due to near-zero expected acceptability.
Separate evaluation
Respondents separately evaluate the acceptability of problems in each EQ-5D-3L domain.
Potential acceptability of each HAc (method: population proportion)
The acceptability of HAcs after separate evaluation, assuming that all separately acceptable problems are also acceptable when co-occurring jointly.
Joint evaluation
Each respondent evaluates a random sample of potentially acceptable HAcs provided by the adaptive survey algorithm, based on the respondents previous responses.
Acceptability of each HAc (the product of potential and conditional acceptability) Conditional acceptability of each HAc (method: empirical Bayes statistical model)
The proportion of respondents accepting a certain HAc after joint evaluation, under the condition that it is potentially acceptable for the respondent.
Acceptability survey questions and the adaptive survey algorithm
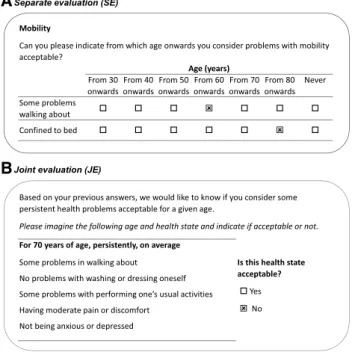
The acceptability survey comprised two stages. First, respondents were asked from what age onwards they consid- ered moderate or severe problems acceptable in each EQ-5D domain. The response options were 30, 40, 50, 60, 70 and 80 years of age or never. The sample question is depicted in Fig. 2A. Previous studies evaluated acceptability using the same question format, albeit the age range varied [15, 16, 22, 27]. As the acceptability of health problems was evaluated separately per EQ-5D-3L domain, we will refer to this part of the survey as separate evaluation (SE).
In the second stage of the survey, respondents evaluated HAcs with multiple problems as either acceptable or not acceptable (Fig. 2B). Depending on the answers in SE, up to 15 semi-random questions were selected by an adaptive sur- vey algorithm. Since the acceptability of co-occurring health problems in HAcs was evaluated jointly by respondents, this part of the survey is denoted as joint evaluation (JE).
The idea of the adaptive survey algorithm is that due to the ordinal structure of EQ-5D-3L response levels, by know- ing the acceptability of a HAc, the acceptability of numerous other HAcs can be deduced for a given respondent, narrow- ing the set of questions that can contain additional informa- tion for the elicitation of his or her preferences.
This deduction builds on two main assumptions. The first assumption is consistency: as EQ-5D-3L dimensions are ordinal measures or health, if a health state is acceptable, then all health states that contain only the same or lower
levels of health problems (denoted as better health states) are also assumed to be acceptable for a given age. If a health state is not acceptable, then all health states that contain only the same or greater levels of problems (worse health states) are not acceptable either for a given age. However, no inferences can be made about two health states that con- tain both higher and lower problem levels in any domains of the EQ-5D-3L. The second assumption is monotonicity in age: if a health state is acceptable for a certain age, then we consider the same or better health states acceptable for older ages as well. At the same time, if a health state is not acceptable for a certain age, inferences can be made about the non-acceptability of the same or worse health states for younger ages.
After the SE stage of the survey, 60 HAcs with a single health problem (e.g., 2111160) could be classified as accept- able or unacceptable for each respondent. The remaining HAcs with multiple health problems could be labelled as either unacceptable or potentially acceptable using the assumptions above. Those HAcs, which contained unac- ceptable problem levels in any domain could be categorised as not acceptable. However, the joint acceptability of co- occurring problems remained unknown for those HAcs (e.g., 2112260, 2112160, 2111260 or 1112260), which included com- binations of problems that were acceptable one by one dur- ing SE (e.g., 2111160, 1112160, 1111260). We denoted these HAcs as potentially acceptable. Only potentially acceptable HAcs were subject to joint evaluation.
The set of potentially acceptable HAcs varies depending on respondents’ preferences, but it is generally too large for an all-encompassing evaluation in a survey situation. The adaptive survey algorithm aims to maximise the obtained information about the unique preference profile of respond- ents using no more than 15 JE questions per respondent, while maintaining a structure that allows unbiased accept- ability estimation for each HAc. The following paragraphs introduce the main steps of the JE procedure. Details are provided in the Online Resource 2.
First, one of the 50 predefined HAc sequences of the JE frame was allocated to the respondent. The actual JE ques- tions of the respondent were selected from the potentially acceptable HAcs of the JE frame. Starting with the first potentially acceptable HAc in the sequence, the respondent was asked to evaluate it. Then the algorithm moved to the next potentially acceptable HAc, and its acceptability was either deduced from prior responses (indirect evaluation) or the respondent was subsequently asked to evaluate it directly.
The algorithm stopped when the respondent had answered 15 questions or all potentially acceptable HAcs had been evaluated via less than 15 questions.
Altogether, by moving along the predefined sequence, each respondent directly or indirectly evaluated a subset of k HAcs, which we denote as the JE response set. The JE A
B
Fig. 2 Sample questions of the adaptive survey
response set is a random sample of potentially acceptable HAcs evaluated as acceptable or not acceptable, with a sam- ple size varying by each respondent.
Statistical measurement model
As the number of jointly evaluated HAcs depends on respondents’ preferences, the sheer proportion of respond- ents who accept a HAc would lead to biased acceptability estimates (see Online Resource 3). Therefore, we estimate acceptability using a statistical measurement model, which mitigates bias and provides acceptability estimates for HAcs that were not included in the JE frame.
First, we decompose the acceptability (Aj) of a given HAc (denoted as HAcj, such as 1212350) into the product of its potential acceptability (PAj) and conditional acceptability (CAj) as shown in Eq. (1). PAj refers to the proportion of the population who consider each health problem of HAcj separately acceptable for the given age. CAj denotes the esti- mated proportion of respondents who jointly evaluate HAcj as acceptable, given that HAcj is potentially acceptable for them. CAj is estimated from the JE response set, since HAcj is evaluated by a given respondent only if it is potentially acceptable after SE.
The two terms are estimated using two different meth- ods. From the complete dataset after SE (1458 HAcs for all respondents), the first term, PA is estimated directly as the proportion of respondents potentially accepting the given HAc. Estimates are adjusted by post-stratification weights to correct for sampling error (see below).
CA is estimated from an incomplete dataset, since not all potentially acceptable HAcs can be evaluated via 15 ques- tions by all respondents in JE. Moreover, JE responses are unevenly distributed across HAcs. Those HAcs, which are potentially acceptable for many respondents (e.g., mild prob- lems in older ages), have plenty observations, while other HAcs with low potential acceptability (e.g., severe problems in younger ages) receive only few or even zero JE responses.
To minimize prediction error in this unbalanced data struc- ture, CAj is estimated using an empirical Bayes strategy by combining the direct acceptability estimates and regression model-based parametric estimates. To reduce the mean square error of prediction, the empirical Bayes or shrinkage approach optimally balances the measurement error of direct estimates of CAj from the JE response set of each respond- ent and model error of parametric estimates of CAj from the combined JE response of all respondents [28, 29]. For technical details see Online Resource 3.
CAj is estimated by weighted ordinary least squares (OLS) regression, where weights are the products of two (1) Aj=PAj×CAj
components: (1) a population weight (post-stratification weights to correct for sampling error) and (2) an information weight to correct for the bias arising from the unbalanced data structure of JE responses. We compare two models and select the one with better fit based on Akaike’s information criteria (AIC) [30], Schwarz’s Bayesian information criteria BIC [31] and likelihood ratio test results. Model 1 (M1) is specified as the one used for estimating UK time-trade-off utility values in the MVH study: the predictors include mod- erate and severe problem levels in each EQ-5D-3L domain and an N3 term for the presence of any severe problems [7].
In addition, the predictors of Model 2 (M2) include dummy variables denoting different levels of PA. For technical details, see Online Resource 4.
As a final step, we calculate acceptability (Aj) for each HAc according to Eq. (1). The exceptions are 60 HAcs with a single health problem (e.g., 2111130, 2111140…1111380).
These HAcs are not evaluated jointly, and their acceptability is estimated from SE responses as a population proportion like PA. Furthermore, by definition, the acceptability of full health (1111130–80) is 1 for any age.
Auxiliary analyses
In addition to quantifying an acceptability set for EQ-5D-3L, we also performed auxiliary analyses.
Descriptive statistics
We applied unweighted descriptive methods to summarize sample characteristics and components of the statistical measurement model. The association between acceptability and PA as well as acceptability profiles of selected HAcs over age were shown graphically.
Assessment of data quality
As a signal of respondent effort, we measured response time during the JE task and excluded respondents whose mean response time per question was too short (≤ 8 s) to com- prehensively read questions before answering. Details are provided in the Online Resource 5.
Since the JE frame was established using PA estimates of external research [17], to verify its applicability, we cal- culated the absolute agreement between HAcs included and excluded from the JE frame and those 750 HAcs with multi- ple problems, which had greatest and 708 HAcs with lowest PA measured in our study.
In EQ-5D-3L valuation studies, logically inconsistent responses (i.e., valuation results that contradict the logical order of health states) were explored and included in the esti- mation samples in varying proportions [32–36]. However, indirect evaluation in JE automatically provides all possible
logically consistent answers, so responses to direct questions cannot be inconsistent, not even from a “random” responder.
Therefore, to assess the “truthfulness” of answers, respond- ents directly evaluated 5 fixed HAcs after JE as control ques- tions and we calculated the absolute agreement between responses to JE questions (direct and indirect evaluations) and the control questions.
Comparing results with previous research
JE was applied first in this study, but given the similar sam- pling strategies, we compared our SE results with those of the Netherlands [16] as follows. Prior studies summarised SE results by assuming that separately acceptable problems were also acceptable when co-occurring jointly. For each respondent, the highest levels of acceptable problems for the six ages were aggregated as acceptable HAcs. The sam- ple mean of the EQ-5D-3L index scores of these HAcs in each age was denoted as the aggregate acceptable health curve (AHCaggregate) [15–17]. We graphically compare the AHCaggregate of our sample with that of the Netherlands using Dutch EQ-5D-3L index values [26].
Finally, we formally tested the hypothesis whether adding CA estimates in the statistical measurement model (and con- ducting JE) improves the accuracy of acceptability estimates compared to using PA estimates (and conducting SE) alone.
According to Eq. (1), if separately acceptable problems are also acceptable when co-occurring jointly, then CAj = 1 for all j. We tested the assumption that CAj = 1 via Wald test
and tested whether CAj is a constant across all HAcs via the overall likelihood ratio test of the parametric estimation model of CAj (see above). All analyses were performed in Stata 16 statistical software package [37].
Results
Sample characteristics
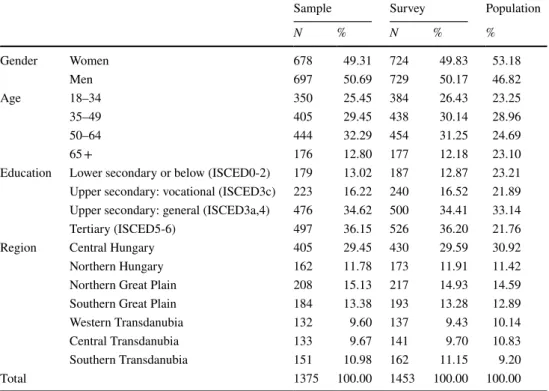
Recruitment was extended to achieve low education quotas, so 1453 individuals provided answers in the survey. Mean (SD) response time per question in JE was 41 (189) seconds, median response time was 21 s. Based on adequate response times, we included 1375 (94.6%) respondents in the analy- sis sample (hereinafter: sample). Mean (SD) age was 46.7 (14.6) years. The sample was similar to the general popula- tion in terms of gender and region, while the 65 + age group and lower education group was under- and the 50–64 age group and the higher education group was overrepresented (Table 1).
The components of acceptability
Acceptability of problems in separate evaluation
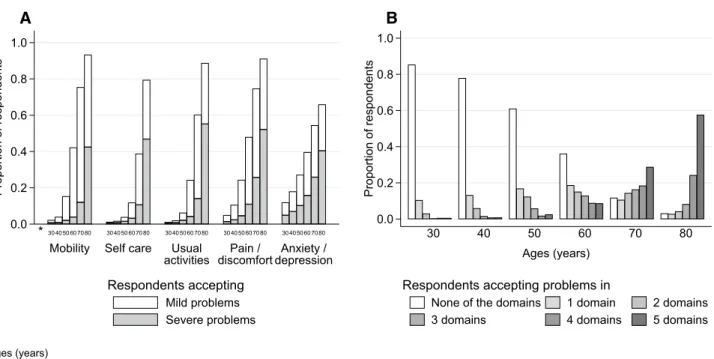
The acceptability of problems increased steeply beyond 50 years of age in all EQ-5D-3L domains. The accept- ability of problems in the anxiety / depression domain was
Table 1 Sample demographic characteristics
Source of population data: Micro-census 2016 [46]
Sample Survey Population
N % N % %
Gender Women 678 49.31 724 49.83 53.18
Men 697 50.69 729 50.17 46.82
Age 18–34 350 25.45 384 26.43 23.25
35–49 405 29.45 438 30.14 28.96
50–64 444 32.29 454 31.25 24.69
65 + 176 12.80 177 12.18 23.10
Education Lower secondary or below (ISCED0-2) 179 13.02 187 12.87 23.21 Upper secondary: vocational (ISCED3c) 223 16.22 240 16.52 21.89 Upper secondary: general (ISCED3a,4) 476 34.62 500 34.41 33.14
Tertiary (ISCED5-6) 497 36.15 526 36.20 21.76
Region Central Hungary 405 29.45 430 29.59 30.92
Northern Hungary 162 11.78 173 11.91 11.42
Northern Great Plain 208 15.13 217 14.93 14.59
Southern Great Plain 184 13.38 193 13.28 12.89
Western Transdanubia 132 9.60 137 9.43 10.14
Central Transdanubia 133 9.67 141 9.70 10.83
Southern Transdanubia 151 10.98 162 11.15 9.20
Total 1375 100.00 1453 100.00 100.00
slightly less age dependent, and self-care problems were less acceptable for 60 and 70 years of age than problems in other domains (Fig. 3A).
The number of domains with acceptable problems increased with age. For age 30, 85.3% (1173/1375), 10.4% (143/1375) and 0.5% (7/1375), while for age 80, 3.1% (42/1375), 2.4% (38/1375) and 57.6% (792/1375) of respondents considered problems in none, only one and all five EQ-5D-3L domains acceptable, respectively (Fig. 3B).
The preferences of respondents were rather heterogenous in SE. Among 1375 respondents we identified 1029 differ- ent patterns of acceptable health problems.
Verifying the JE frame
Online Resource 6 provides the distribution of potential acceptability for two subsets of HAcs. Fig. S5A depicts the distribution for those 642 HAcs that contained mul- tiple problems but were excluded from the JE frame.
Their median (range) potential acceptability was 0.006 (0.003–0.035). Fig. S5B depicts the distribution of poten- tial acceptability for the 750 HAcs included in the JE frame. Their median (range) potential acceptability was 0.100 (0.009–0.880). According to potential acceptabil- ity, 96.3% of HAcs with multiple problems (1340/1392) were allocated correctly into or out of the JE frame. The threshold separating the top 750 HAcs in terms of PA was > 0.019 in our sample.
Results of joint evaluation
Those 1295 respondents participated in JE, who considered multiple problems acceptable for a given age during SE.
Out of 189,346 potentially acceptable HAcs, 38,174 (20.2%) were evaluated during JE, including 14,585 (38.2%) direct evaluations and 23,589 (61.8%) indirect evaluations. The average JE response set contained 11.3 direct evaluations (median: 15, range: 1–15) and 18.2 indirect evaluations (median: 11, range: 0–458). Altogether 694/1375 (50.4%) respondents performed 15 direct evaluations. On average, from each respondent, 29.5 (direct and indirect) evaluations (median: 25, range: 0–468) were included in the JE response set. From the 750 HAcs of the JE frame, 695 (92.7%) were evaluated in JE.
Estimates of conditional acceptability
The empirical Bayes estimates of CAj included both the direct- and parametric estimate components for those 329 HAcs of the JE frame, which received 15 or more (direct or indirect) joint evaluations and altogether 95.1%
(36,292/38,174) of JE responses. The CAj for those 421 HAcs, which had < 15 joint evaluations were estimated only via parametric methods.
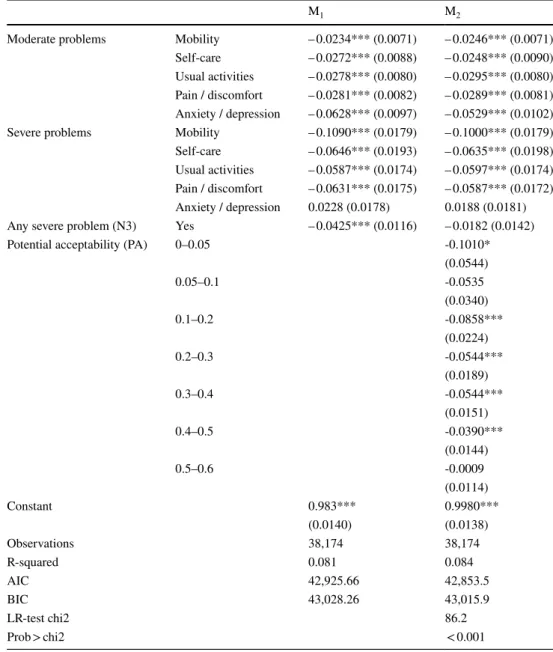
Table 2 presents the weighted OLS models that provide the parametric component of empirical Bayes estimates of CAj. Due to superior fit, M2 was chosen for estimating the acceptability set. The significant overall likelihood ratio test
0.0 * 0.2 0.4 0.6 0.8 1.0
Proportion of respondents
Mobility Self care Usual
activities Pain /
discomfort Anxiety / depression
304050607080 304050607080 304050607080 304050607080 304050607080
A
Mild problems Severe problems Respondents accepting
0.0 0.2 0.4 0.6 0.8 1.0
Proportion of respondents
30 40 50 60 70 80
Ages (years)
None of the domains 1 domain 2 domains
3 domains 4 domains 5 domains
Respondents accepting problems in
B
* Ages (years)
Fig. 3 The proportion of respondents in separate evaluation (SE) who accept problems A by EQ-5D domain and age B by the number domains and age
confirmed that CAj is not constant across all HAcs. The coef- ficients of M2 are interpreted as follows. Like the results of SE (Fig. 3A), problems in the anxiety / depression domain affected conditional acceptability differently than problems in other domains. While the coefficients for both moderate and severe problems were significant in other domains, the presence of anxiety / depression had marked effect on con- ditional acceptability without significant difference between severe and moderate problem levels. The presence of any severe problems (N3 term) was not significant, while lower levels of potential acceptability were associated with lower conditional acceptability.
Evaluating the consistency of responses
Due to the varying size of JE response sets, out of the 5 control questions, 5, 4, 3, 2, 1 and 0 could be evaluated by 1009 (73.4%), 204 (14.8%), 108 (7.9%), 40 (2.9%), 10 (0.7%) and 4 (0.3%) individuals from the 1375 respondents, respectively. From the 1371 respondents who answered 1–5 control questions, only 304 (22.2%) provided fully consistent answers, while no more than one inconsistent answer was provided by 636 (46.4%). Altogether, 91.3% of the control questions were answered and 61.0% of the responses to con- trol questions matched JE responses. JE response time was
Table 2 Regression model of conditional acceptability
Notes: Lineal probability model estimates. Dependent variable: HAc is acceptable in JE. Observations:
respondent-HAc. Robust standard errors clustered at the individual level in parentheses. Base level for potential acceptability: Range: 0.6–1
***p < 0.01, **p < 0.05, *p < 0.1
M1 M2
Moderate problems Mobility – 0.0234*** (0.0071) – 0.0246*** (0.0071) Self-care – 0.0272*** (0.0088) – 0.0248*** (0.0090) Usual activities – 0.0278*** (0.0080) – 0.0295*** (0.0080) Pain / discomfort – 0.0281*** (0.0082) – 0.0289*** (0.0081) Anxiety / depression – 0.0628*** (0.0097) – 0.0529*** (0.0102)
Severe problems Mobility – 0.1090*** (0.0179) – 0.1000*** (0.0179)
Self-care – 0.0646*** (0.0193) – 0.0635*** (0.0198) Usual activities – 0.0587*** (0.0174) – 0.0597*** (0.0174) Pain / discomfort – 0.0631*** (0.0175) – 0.0587*** (0.0172) Anxiety / depression 0.0228 (0.0178) 0.0188 (0.0181) Any severe problem (N3) Yes – 0.0425*** (0.0116) – 0.0182 (0.0142)
Potential acceptability (PA) 0–0.05 -0.1010*
(0.0544)
0.05–0.1 -0.0535
(0.0340)
0.1–0.2 -0.0858***
(0.0224)
0.2–0.3 -0.0544***
(0.0189)
0.3–0.4 -0.0544***
(0.0151)
0.4–0.5 -0.0390***
(0.0144)
0.5–0.6 -0.0009
(0.0114)
Constant 0.983*** 0.9980***
(0.0140) (0.0138)
Observations 38,174 38,174
R-squared 0.081 0.084
AIC 42,925.66 42,853.5
BIC 43,028.26 43,015.9
LR-test chi2 86.2
Prob > chi2 < 0.001
not an indicator of inconsistent answers. The proportion of consistent answers did not differ between the analysis sam- ple and those respondents, who were excluded due to short JE answer times (OR 0.994, p = 0.947).
The EQ‑5D‑3L acceptability set
The estimated EQ-5D-3L acceptability set for the 1458 HAcs is presented in Table S2 of Online Resource 7. For 30, 40, 50, 60, 70 and 80 years of age the most accept- able HAcs and their acceptability were 1111230 (0.119), 1111240 (0.179), 1111250 (0.272), 1112160 (0.479), 2111170 (0.754) and 2111180 (0.933), respectively. The accept- ability of 3333330, 3333340, 3333350, 3333360, 3333370 and 3333380 was 0.001, 0.001, 0.002, 0.006, 0.021 and 0.074, respectively.
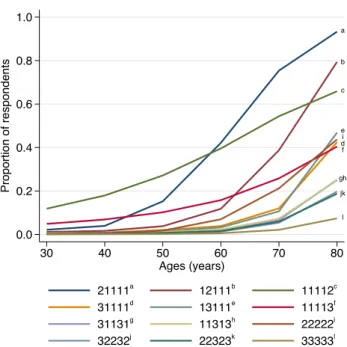
Figure 4 displays the acceptability profiles of 12 selected health states over age. The acceptability profiles of single- problem health states were shaped by the EQ-5D-3L domain and problem severity. However, the acceptability profiles of health states with multiple problems seemed to depend mainly on the number and severity of problems, and not on the affected domain.
Comparing results with previous research Comparing Hungarian and Dutch results of separate evaluation
Figure 5 depicts the AHCaggregate of our sample with that of the Netherlands. Despite the similar shape of both curves, the Dutch AHCaggregate is shifted to the right suggesting that similar levels of health problems are considered accept- able for 5–10 years older ages in the Netherlands than in Hungary. The EQ-5D-3L index differences between the two curves ranged between 0.04 and 0.14 with the greatest dif- ference at 70 years of age. Higher AHCaggregate values denote higher EQ-5D-3L index values (less problems) acceptable for a given age.
Comparing the accuracy of the adaptive algorithm versus separate evaluation
The overall weighted proportion of positive JE responses in our sample was 0.732 (SE: 0.012). We rejected the hypoth- esis that this proportion (CA) is equal to 1 (F1, 1294 = 481.33, p < 0.001), confirming that separately acceptable problems are not universally acceptable when co-occurring jointly.
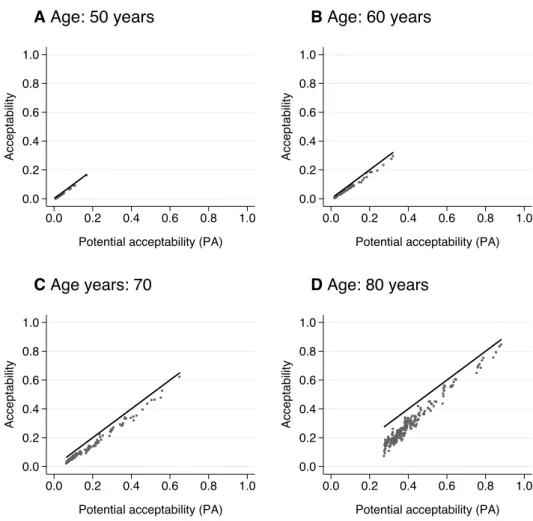
Figure 6 illustrates the resulting differences between acceptability and potential acceptability in case of 1392 HAcs with multiple problems. Although most respond- ents accepted co-occurring health problems jointly as well, acceptability was lower than PA for most HAcs, especially at ages over 50 years. The difference increased with the num- ber and severity of health problems (represented by lower levels of PA).
a b c
ei df
gh jk
l
0.0 0.2 0.4 0.6 0.8 1.0
Proportion of respondents
30 40 50 60 70 80
Ages (years)
21111a 12111b 11112c
31111d 13111e 11113f
31131g 11313h 22222i
32232j 22323k 33333l
Fig. 4 Acceptability profiles of selected health states-age combina- tions (HAcs)
0.94 0.91
0.84 0.72
0.50
0.18
0.95 0.93
0.85 0.64
0.30
0.06 0.0
0.2 0.4 0.6 0.8 1.0
Mean ED−5D−3L index (Dutch value set)
30 40 50 60 70 80 90
Ages (years)
Hungary Netherlands (Wouters et al., 2015)
Fig. 5 Aggregate acceptable health curves (AHCaggregate) of Hungary and the Netherlands
Discussion
Main findingsIn this cross-sectional survey, for 1458 HAcs (243 EQ- 5D-3L health states in six ages from 30 to 80 years), we quantified the proportion of the general population who con- sider them acceptable: an acceptability set for EQ-5D-3L.
We estimated acceptability via a novel adaptive survey involving joint evaluation of co-occurring problems, fol- lowed by a matching statistical measurement model. Using this method, we have shown that from those potentially acceptable HAcs that contained multiple problems, less than ¾ were acceptable in joint evaluation, depending on the age as well as the number and severity of jointly occur- ring health problems of HAcs.
Elaboration of results
Acceptability has previously been measured via SE both in the general population [15–17] and chronic patients [27].
Compared to that of the Hungarian population, higher
AHCaggregate values of the Netherlands may signal higher health standards corresponding with higher life expectancy and generally healthier lifestyle [38, 39]. AHCaggregate val- ues are also available from a non-representative sample of the Hungarian general population [17] and a preliminary version of the adaptive survey was tested in a small pilot study on a convenience sample [18]. Since the perception of acceptable health depends on individual characteristics of respondents, such as age, socio-economic and health status [40], more nationally representative surveys are needed to demonstrate that acceptability is a stable and reliable meas- ure of population-level health preferences.
The strength of our study is that we determined the com- plete acceptability set for EQ-5D-3L in 6 ages from 30 to 80 years, which, unlike EQ-5D-3L value sets, quantifies soci- etal preferences regarding age and the severity of disease in a structured and transparent way. The questions were designed to elicit respondents’ judgements about HAcs “concerning peo- ple in general” for the six ages and not concerning themselves, reflecting the oft preferred perspective for reimbursement decisions [41]. By the secondary use of previously collected EQ-5D-3L data, the acceptability set allows the exploration
Fig. 6 Association of accepta- bility and potential acceptability of HAcs with multiple problems over different ages
0.0 0.2 0.4 0.6 0.8 1.0
Acceptability
0.0 0.2 0.4 0.6 0.8 1.0
Potential acceptability (PA)
A Age: 50 years
0.0 0.2 0.4 0.6 0.8 1.0
Acceptability
0.0 0.2 0.4 0.6 0.8 1.0
Potential acceptability (PA)
B Age: 60 years
0.0 0.2 0.4 0.6 0.8 1.0
Acceptability
0.0 0.2 0.4 0.6 0.8 1.0
Potential acceptability (PA)
C Age years: 70
0.0 0.2 0.4 0.6 0.8 1.0
Acceptability
0.0 0.2 0.4 0.6 0.8 1.0
Potential acceptability (PA)
D Age: 80 years
Black lines: acceptability=potential acceptability
of new health outcome measures motivated by sufficientarian theory of distributive justice. Sufficientarians assert that once individuals have secured enough, the reason to further benefit them changes. Acceptability offers a natural threshold which allows the application of different weights to acceptable ver- sus not acceptable health states (e.g., acceptable life years, or QALY gains in unacceptable health states), which may provide a plausible equity weighting scheme that reflects societal pref- erences concerning age and severity of disease. The accept- ability set allows the estimation of acceptability of health states as a function of utility and age, leading to a straightforward implementation in usual decision-model structures [11, 13, 42, 43]. However, the role of acceptable health in healthcare resource allocation, its link to positive and negative utilities as well as the state of death requires further exploration.
Limitations
A limitation of our study is that despite our efforts to verify main steps of the estimation process and assess data quality, many aspects of the measurement properties of the accept- ability set and its sensitivity to alternative methodological choices remained unexplored and require future research.
We designed a statistical measurement model to mitigate bias arising from the dependence of survey questions on respondents’ preferences, yet its statistical properties need to be explored in greater depth. Although the rate of incon- sistent answers to control questions was similar to the rate of logically inconsistent answers in EQ-5D-3L valuation studies [33, 34], the exclusion criteria due to low quality of responses have not yet been established for acceptability.
Based on our preliminary exploration, neither the answer times, not the control questions provided a fully reliable basis for the exclusion of potentially inconsistent respond- ents. For example, providing purely “yes” or “no” answers in JE may both signal strategic responses or a respondent’s true preferences. Both may result in fast response times and con- gruent answers to control questions. Therefore, we chose to exclude respondents sparingly, only due to too brief response times to read and comprehend HAc vignettes in JE. Also, in some countries, the EQ-5D-3L population norms report flat or decreasing prevalence of problems in the anxiety / depres- sion domain, where the assumption of monotonicity in age may have to be relaxed [24]. However, the steep increase of anxiety / depression problems with age in Hungary suggests that the assumptions of the adaptive algorithm represented adequately the experiences of the general population [24].
Another limitation was that our survey was conducted in an online population, which typically under-represents indi- viduals with lower education or older age groups [44]. How- ever, the Canadian EQ-5D-3L valuation study is an exam- ple that online surveys may be adequate means for health
preference research [4] and the adaptive algorithm can be applied in computer-aided personal interviews [18, 45].
Conclusion
In conclusion, we quantified an acceptability set for EQ- 5D-3L using a novel adaptive survey algorithm and a match- ing statistical measurement model, which provided more accurate estimates than prior methods. However, in-depth understanding of the statistical and psychometric properties of the new method requires further research, and the poten- tial role of acceptability in health decision-making needs to be explored.
Supplementary Information The online version contains supplemen- tary material available at https:// doi. org/ 10. 1007/ s10198- 021- 01424-8.
Author contributions All authors contributed to the study conception and design. Material preparation, data collection and analysis were performed by ZH, MP, LG and ZZ. Formal analysis was performed by ZH and ZZ. The first draft of the manuscript was written by ZZ and ZH and all authors commented on previous versions of the manuscript. All authors read and approved the final manuscript.
Funding Open access funding provided by Óbuda University. This research has been implemented under project no. TKP2020-NKA-02 with the support provided from the National Research, Development and Innovation Fund of Hungary, financed under the Tématerületi Kiválósági Program funding scheme.
Availability of data and material Data are available upon reasonable request from the authors.
Code availability The code of statistical analyses is available upon reasonable request from the authors.
Declarations
Conflicts of interest Financial interests: In connection with writing the manuscript, ZH, LG and ZZ have received financial support from project no. TKP2020-NKA-02 of the National Research, Development and Innovation Fund of Hungary, financed under the Tématerületi Kiválósági Program funding scheme at Corvinus University of Buda- pest. During writing this article, ZZ has received funding from the European Research Council (ERC) under the European Union's Ho- rizon 2020 research and innovation programme (grant agreement No 679681). MP has received funding from Project no. 2019–1.3.1-KK- 2019–00007 implemented with the support provided from the National Research, Development and Innovation Fund of Hungary, financed un- der the 2019–1.3.1-KK funding scheme. Non-financial interests: MP is member of the EuroQol Group, a not-for-profit organisation that devel- ops and distributes instruments that assess and value health. KNIA has no relevant financial or non-financial interests to disclose.
Ethics approval This study was approved by the Ethical Committee of the Medical Research Council of Hungary (ETT TUKEB; 3857–5- 2019/EKU).
Consent to participate All participants were informed and provided their consent prior completing the survey.
Consent for publication All authors have approved the final manuscript and consent for publication.
Open Access This article is licensed under a Creative Commons Attri- bution 4.0 International License, which permits use, sharing, adapta- tion, distribution and reproduction in any medium or format, as long as you give appropriate credit to the original author(s) and the source, provide a link to the Creative Commons licence, and indicate if changes were made. The images or other third party material in this article are included in the article's Creative Commons licence, unless indicated otherwise in a credit line to the material. If material is not included in the article's Creative Commons licence and your intended use is not permitted by statutory regulation or exceeds the permitted use, you will need to obtain permission directly from the copyright holder. To view a copy of this licence, visit http:// creat iveco mmons. org/ licen ses/ by/4. 0/.
References
1. Rios-Diaz, A.J., Lam, J., Ramos, M.S., Moscoso, A.V., Vaughn, P., Zogg, C.K., Caterson, E.J.: Global patterns of QALY and DALY use in surgical cost-utility analyses: a systematic review.
PLoS ONE 11(2), e0148304 (2016). https:// doi. org/ 10. 1371/
journ al. pone. 01483 04
2. Kennedy-Martin, M., Slaap, B., Herdman, M., van Reenen, M., Kennedy-Martin, T., Greiner, W., Busschbach, J., Boye, K.S.:
Which multi-attribute utility instruments are recommended for use in cost-utility analysis? A review of national health technol- ogy assessment (HTA) guidelines. Eur. J. Health Econ. 21(8), 1245–1257 (2020). https:// doi. org/ 10. 1007/ s10198- 020- 01195-8 3. EuroQoL Group: EuroQol–a new facility for the measurement
of health-related quality of life. Health Policy 16(3), 199–208 (1990)
4. Xie, F., Gaebel, K., Perampaladas, K., Doble, B., Pullenayegum, E.: Comparing EQ-5D valuation studies: a systematic review and methodological reporting checklist. Med. Decis. Making 34(1), 8–20 (2014). https:// doi. org/ 10. 1177/ 02729 89X13 480852 5. Bahrampour, M., Byrnes, J., Norman, R., Scuffham, P.A.,
Downes, M.: Discrete choice experiments to generate utility val- ues for multi-attribute utility instruments: a systematic review of methods. Eur. J. Health Econ. 21(7), 983–992 (2020). https:// doi.
org/ 10. 1007/ s10198- 020- 01189-6
6. Weinstein, M.C.: A QALY is a QALY is a QALY — Or is it? J.
Health Econ. 7(3), 289–290 (1988). https:// doi. org/ 10. 1016/ 0167- 6296(88) 90030-6
7. Dolan, P.: Modeling valuations for EuroQol health states. Med.
Care 35(11), 1095–1108 (1997)
8. Gu, Y., Lancsar, E., Ghijben, P., Butler, J.R., Donaldson, C.:
Attributes and weights in health care priority setting: A system- atic review of what counts and to what extent. Soc. Sci. Med. 146, 41–52 (2015). https:// doi. org/ 10. 1016/j. socsc imed. 2015. 10. 005 9. Brazier, J.E., Rowen, D., Lloyd, A., Karimi, M.: Future direc-
tions in valuing benefits for estimating QALYs: is time up for the EQ-5D? Value Health 22(1), 62–68 (2019). https:// doi. org/
10. 1016/j. jval. 2018. 12. 001
10. Da, P., S, R.: The limitations of QALY: a literature review. J. Stem Cell Res. Ther. (2016). Doi:https:// doi. org/ 10. 4172/ 2157- 7633.
10003 34
11. Carlson, J.J., Brouwer, E.D., Kim, E., Wright, P., McQueen, R.B.:
Alternative approaches to quality-adjusted life-year estimation
within standard cost-effectiveness models: literature review, fea- sibility assessment, and impact evaluation. Value Health 23(12), 1523–1533 (2020). https:// doi. org/ 10. 1016/j. jval. 2020. 08. 2092 12. Baltussen, R., Niessen, L.: Priority setting of health interventions:
the need for multi-criteria decision analysis. Cost Eff. Resour.
Alloc. 4, 14 (2006). https:// doi. org/ 10. 1186/ 1478- 7547-4- 14 13. Wouters, S., van Exel, N.J.A., Rohde, K.I.M., Vromen, J.J., Brou-
wer, W.B.F.: Acceptable health and priority weighting: Discussing a reference-level approach using sufficientarian reasoning. Soc.
Sci. Med. 181, 158–167 (2017). https:// doi. org/ 10. 1016/j. socsc imed. 2017. 03. 051
14. Shields, L.: Sufficientarianism. Philosophy. Compass 15(11), 1–10 (2020). https:// doi. org/ 10. 1111/ phc3. 12704
15. Brouwer, W.B., van Exel, N.J., Stolk, E.A.: Acceptability of less than perfect health states. Soc. Sci. Med. 60(2), 237–246 (2005).
https:// doi. org/ 10. 1016/j. socsc imed. 2004. 04. 032
16. Wouters, S., van Exel, N.J., Rohde, K.I., Brouwer, W.B.: Are all health gains equally important? An exploration of acceptable health as a reference point in health care priority setting. Health Qual. Life Outcomes 13, 79 (2015). https:// doi. org/ 10. 1186/
s12955- 015- 0277-6
17. Pentek, M., van Exel, J., Gulacsi, L., Brodszky, V., Zrubka, Z., Baji, P., Rencz, F., Brouwer, W.B.F.: Acceptable health and ageing: results of a cross-sectional study from Hungary. Health Qual. Life Outcomes 18(1), 346 (2020). https:// doi. org/ 10. 1186/
s12955- 020- 01568-w
18. Zrubka, Z.: Az elfogadható egészségi állapotok mérésének új módszere PhD, Corvinus University of Budapest (2019) 19. Bross, F.: Acceptability Ratings in Linguistics: A Practical
Guide to Grammaticality Judgments, Data Collection, and Sta- tistical Analysis Version 1.02. . In. Mimeo, Online (2019) 20. Weskott, T., Fanselow, G.: On the informativity of different
measures of linguistic acceptability. Language 87(2), 249–273 (2011). https:// doi. org/ 10. 1353/ lan. 2011. 0041
21. Sekhon, M., Cartwright, M., Francis, J.J.: Acceptability of healthcare interventions: an overview of reviews and develop- ment of a theoretical framework. BMC Health Serv. Res. 17(1), 88 (2017). https:// doi. org/ 10. 1186/ s12913- 017- 2031-8 22. Pentek, M., Brodszky, V., Gulacsi, A.L., Hajdu, O., van Exel,
J., Brouwer, W., Gulacsi, L.: Subjective expectations regard- ing length and health-related quality of life in Hungary: results from an empirical investigation. Health Expect 17(5), 696–709 (2014). https:// doi. org/ 10. 1111/j. 1369- 7625. 2012. 00797.x 23. Buchholz, I., Janssen, M.F., Kohlmann, T., Feng, Y.S.: A sys-
tematic review of studies comparing the measurement proper- ties of the three-level and five-level versions of the EQ-5D.
Pharmacoeconomics 36(6), 645–661 (2018). https:// doi. org/ 10.
1007/ s40273- 018- 0642-5
24. Janssen, B., Szende, A., Cabases, J.: Self-reported population health: an international perspective based on EQ-5D. Self- reported population health: An international perspective based on EQ-5D. Springer, Dordrecht (NL) (2014)
25. Group, E.: Where is EQ-5D used? https:// euroq ol. org/ eq- 5d- instr uments/ how- can- eq- 5d- be- used/ where- is- eq- 5d- used/
(2018). Accessed August 11, 2021
26. Lamers, L.M., McDonnell, J., Stalmeier, P.F., Krabbe, P.F., Busschbach, J.J.: The Dutch tariff: results and arguments for an effective design for national EQ-5D valuation studies. Health Econ. 15(10), 1121–1132 (2006). https:// doi. org/ 10. 1002/ hec.
27. Pentek, M., Rojkovich, B., Czirjak, L., Geher, P., Keszthelyi, 1124 P., Kovacs, A., Kovacs, L., Szabo, Z., Szekanecz, Z., Tamasi, L., Toth, A.E., Ujfalussy, I., Hever, N.V., Strbak, B., Baji, P., Brodszky, V., Gulacsi, L.: Acceptability of less than perfect health states in rheumatoid arthritis: the patients’ perspective.
Eur. J. Health Econ. 15(Suppl 1), S73-82 (2014). https:// doi. org/
10. 1007/ s10198- 014- 0596-2
28. Morris, C.N.: Parametric empirical bayes inference: theory and applications. J. Am. Stat. Assoc. 78(381), 47–55 (1983). https://
doi. org/ 10. 1080/ 01621 459. 1983. 10477 920
29. Fisher, R.: Methods used for small area poverty and income estimation. In. Washington, (1997)
30. Akaike, H.: A new look at the statistical model identification.
IEEE Trans. Autom. Control 19(6), 716–723 (1974). https:// doi.
org/ 10. 1109/ tac. 1974. 11007 05
31. Schwarz, G.: Estimating the dimension of a model. Ann. Statis- tics (1978). https:// doi. org/ 10. 1214/ aos/ 11763 44136
32. Badia, X., Roset, M., Herdman, M.: Inconsistent responses in three preference-elicitation methods for health states. Soc. Sci.
Med. 49(7), 943–950 (1999). https:// doi. org/ 10. 1016/ s0277- 9536(99) 00182-3
33. Lamers, L.M., Stalmeier, P.F., Krabbe, P.F., Busschbach, J.J.:
Inconsistencies in TTO and VAS values for EQ-5D health states. Med. Decis. Making 26(2), 173–181 (2006). https:// doi.
org/ 10. 1177/ 02729 89X06 286480
34. Ohinmaa, A., Sintonen, H.: Inconsistencies and modelling of the Finnish EuroQoL (EQ-5D) preference values. In: Hannover EuroQoL Proceedings 1998. EuroQoL, Rotterdam
35. Tongsiri, S., Cairns, J.: Estimating population-based values for EQ-5D health states in Thailand. Value Health 14(8), 1142–
1145 (2011). https:// doi. org/ 10. 1016/j. jval. 2011. 06. 005 36. Yang, Z., van Busschbach, J., Timman, R., Janssen, M.F.,
Luo, N.: Logical inconsistencies in time trade-off valuation of EQ-5D-5L health states: Whose fault is it? PLoS ONE 12(9), e0184883 (2017). https:// doi. org/ 10. 1371/ journ al. pone. 01848 37. StataCorp: Stata Statistical Software: Release 16. StataCorp LLC, 83
College Station, TX (2019)
38. OECD, Systems, E.O.o.H., Policies: Hungary: Country Health Profile 2019. (2019)
39. OECD, Systems, E.O.o.H., Policies: Netherlands: Country Health Profile 2019. (2019)
40. Zrubka, Z., Hermann, Z., Gulácsi, L., Brodszky, V., Rencz, F., Péntek, M.: Determinants of the acceptability of health prob- lems in different ages: exploring a new application of the EQ VAS. Eur. J. Health Econ. (2019). https:// doi. org/ 10. 1007/
s10198- 10019- 01060- 10193
41. Rowen, D., Azzabi Zouraq, I., Chevrou-Severac, H., van Hout, B.:
International regulations and recommendations for utility data for health technology assessment. Pharmacoeconomics 35(Suppl 1), 11–19 (2017). https:// doi. org/ 10. 1007/ s40273- 017- 0544-y 42. Zrubka, Z., Brodszky, V., Péntek, M., Rencz, F., Gulácsi, L.: Pms3
- Infliximab for disease-modifying anti-rheumatic drug-naive rheumatoid arthritis patients: systematic review and descriptive analysis of publications of randomized controlled trials. Value Health 21, S288 (2018). https:// doi. org/ 10. 1016/j. jval. 2018. 09.
43. Shields, L.: The prospects for sufficientarianism. Utilitas 24(1), 1717 101–117 (2012). https:// doi. org/ 10. 1017/ s0953 82081 10003 92 44. Eysenbach, G., Wyatt, J.: Using the Internet for surveys and health
research. J. Med. Internet. Res. 4(2), E13 (2002). https:// doi. org/
10. 2196/ jmir.4. 2. e13
45. Zrubka, Z., Gulácsi, L., Rencz, F., Brodszky, V., Péntek, M.: A new approach to assess the acceptability of health problems at different ages: an experimental study using the EQ-5D-3L instru- ment. Paper presented at the 35th EuroQoL Plenary Meeting, Lisbon, Portugal, 19–22nd September, 2018
46. KSH, H.C.S.O.: Microcensus 2016. https:// www. ksh. hu/ mikro cenzu s2016/ (2017). Accessed Nov 29, 2020
Publisher's Note Springer Nature remains neutral with regard to jurisdictional claims in published maps and institutional affiliations.