https://doi.org/10.1007/s10198-019-01060-3 ORIGINAL PAPER
Determinants of the acceptability of health problems in different ages:
exploring a new application of the EQ VAS
Zsombor Zrubka1,2 · Zoltán Hermann3,4 · László Gulácsi1 · Valentin Brodszky1 · Fanni Rencz1,5 · Márta Péntek1
Received: 2 March 2019 / Accepted: 15 April 2019
© The Author(s) 2019
Abstract
Background We aimed to determine the acceptability of non-perfect health states with age using the EQ VAS and analyse the influencing factors.
Methods We conducted a cross-sectional survey on a convenience sample from the general population (N = 200). Respondents were asked to indicate on the EQ VAS the health states that are still acceptable for ages between 30 and 80 years in 10-year intervals (VAS acceptable health curve, AHCvas). We recorded respondents’ current health, health-related lifestyle, demographic background and explored the reference person they imagined when evaluating acceptable health states. We evaluated the AHCvas by estimating linear multilevel models including a random intercept (estimated at age 30) and a random slope for age.
Results AHCvas scores were available for 194 respondents (mean age = 42.8 years, range 19–93, 58% female). For ages of 30, 40, 50, 60, 70 and 80 years, mean AHCvas scores were 93, 87, 80, 73, 65 and 57, respectively. The decline of AHCvas was linear with age. Respondents’ age, health status, lifestyle and health-related experiences, as well as their reference point taken (e.g.
imagining themselves, others or both during the valuation task) influenced significantly the acceptability of health problems.
Conclusions When measured with the EQ VAS, health problems were increasingly acceptable with age. Capturing well the individual variability in the assessment of acceptable health states at different ages, the EQ VAS is a useful addition to EQ-5D-3L descriptive system-based measures of acceptable health.
Keywords Acceptable health states · EQ-5D-3L · EQ VAS · Priority setting JEL Classification I10
Introduction
Fiscal sustainability of healthcare has become a key chal- lenge of developed economies, resulting in an increasing focus on the efficiency of public spending on healthcare [1]. To tackle this challenge, among several policy options, decision-makers may need to be increasingly selective when defining the benefit basket covered by public reimbursement systems [1].
Can this challenge be met by considering the preferences of the general population as a beacon for decision-making?
Standard economic analysis uses perfect health as a ref- erence point for health gains and applies the same weights to QALYs across the full range of disease severity or age of the target population. However, when making decisions about the public funding of various treatment options in scarcity of healthcare resources, alternative approaches may
Electronic supplementary material The online version of this article (https ://doi.org/10.1007/s1019 8-019-01060 -3) contains supplementary material, which is available to authorized users.
* Zsombor Zrubka
zsombor.zrubka@uni-corvinus.hu
1 Department of Health Economics, Corvinus University of Budapest, Fővám tér 8, 1093 Budapest, Hungary
2 Doctoral School of Management, Corvinus University of Budapest, Fővám tér 8, 1093 Budapest, Hungary
3 Centre for Economic and Regional Studies, Hungarian Academy of Sciences, Tóth Kálmán u. 4, 1097 Budapest, Hungary
4 Centre for Labour Economics, Corvinus University of Budapest, Fővám tér 8, 1093 Budapest, Hungary
5 Premium Postdoctoral Research Program, Hungarian Academy of Sciences, Nádor u. 7, 1051 Budapest, Hungary
be considered, which differentiate QALY gains on the basis of various theories of distributional justice [2]. The ‘fair innings’ principle argues on the grounds of egalitarian ide- ology about placing greater weights on QALYs in younger individuals, who have not yet had a fair share of lifespan as compared to older individuals [3]. The ‘worse off’ princi- ple on the grounds of prioritarian ideology favours QALY gains in more severe disease states over less severe ones [4], while other principles may favour the maximisation of lifetime QALYs or interventions with the greatest benefit [5]. Using sufficientarian reasoning, Wouters et al. recently explored the principle of differentiating QALY gains based on the acceptability of health states. Instead of being con- cerned with inequalities, sufficientarianists propose that it is morally important for everyone to have just enough [6].
It has been shown in empirical studies on the Dutch general population [7, 8] and a sample of Hungarian patients with rheumatoid arthritis (RA) [9] that people have internal refer- ence points, against which they compare the acceptability of certain health states via a simple acceptable—not acceptable judgement. The reference points depend on age, suggest- ing that more health problems are acceptable in older ages [7–9]. According to sufficientarian reasoning, it is desirable to live above the acceptability threshold. Therefore, highest utility could be attached to health gains, that move patients from unacceptable to acceptable health states (AHSs), while depending on the application other sufficientarian criteria, zero or lower utility level could be attached to those health gains below or above the acceptability threshold, that do not cross the reference line [2].
The relative simplicity of the cognitive evaluation task makes the measurement of AHSs a compelling approach.
The EQ-5D-3L descriptive system [10] provides a standard- ised framework for measuring AHSs, which is an important feature for public decision-making [11]. However, rendering a binary acceptable/not acceptable status to all 243 discrete health states across several age-groups poses a feasibility challenge for the comprehensive evaluation of AHSs. To overcome these challenges, previous studies investigated AHSs in different ages separately by each dimension of the EQ-5D-3L [7–9]. These studies left uncertainty about the acceptability of simultaneous health problems in more than one dimension. The acceptability of combined health prob- lems was jointly evaluated using only a few health profiles by Wouters et al. [7]. Although acceptable health may serve as a reference point for priority setting, it requires further methodological exploration. Wouters et al. pointed out that despite the appealing concept, the challenge of finding a morally acceptable and practically feasible acceptability threshold hampers its application in real practice [2, 7].
Building on the results and unanswered questions of previous empirical research using the descriptive system of EQ-5D-3L instrument [7, 8], we explored AHSs using
the EQ VAS. The EQ VAS is a feasible and reliable instru- ment for the evaluation of health states [12]. We assumed that although the EQ VAS does not inform about the details of subjective criteria when evaluating the acceptability of health states, it may provide meaningful point estimates about where the internal reference health states fall rela- tive to the extremes of best and worst imaginable health.
Furthermore, the EQ VAS provides a single score about the individuals’ global evaluation of health, not affected by the properties of the EQ-5D-3L descriptive system and index values, which reflect the average societal preferences attached to discrete health profiles [12].
Our primary goal was to explore AHSs using the EQ VAS instrument and to analyse the differences compared to the assessment based on the descriptive system of the EQ-5D-3L. Moreover, we aimed to explore how AHSs are influenced by the health status and socio-demographic characteristics of respondents. Another novelty of our study is that we investigated how the reference person imagined by respondents during the evaluation exercise affected the acceptability of health states.
Methods
Study sample and design
Between January and March 2018, we conducted a cross- sectional survey on a convenience sample of 200 subjects from the Hungarian general population. We obtained the approval of the Medical Research Council of Hungary (ID:
5111-2/2018/EKU). Respondents were informed, and pro- vided written consent. Data were collected anonymously.
The acceptability of health problems was assessed via com- puter-aided personal interviews separately by EQ-5D-3L dimensions as well as by joint evaluation of EQ-5D-3L profiles using an adaptive testing algorithm. We recorded socio-demographic and health-related data using a paper- and-pencil questionnaire including the EQ-5D-3L, as well as the evaluation of AHSs by an adapted version of EQ VAS.
The electronic and paper questionnaires were joined by a common code, retaining the anonymity of respondents.
Socio‑demographic and health‑related data
Respondents’ age and gender were recorded, and three main age groups (18–43, 35–64 and 65+ years old) were formed for the analysis. The three education categories (low: pri- mary, middle: secondary, high: tertiary) were based on the highest completed level of education. We recorded the lifes- pan of close relatives as well as respondents’ informal car- egiver experience. We assigned informal caregiver status to individuals who provided at least 6 weeks of informal care
over the past 10 years. We also asked health-related lifestyle questions: weight and height for body mass index (BMI), smoking, alcohol intake and physical activity. We consid- ered the following lifestyle parameters as risky: BMI ≥ 25 [13], smoking at any quantity [14], ≥ 7 drinks per week or
≥ 3 drinks per any single day for women and ≥ 14 drinks per week or ≥ 4 drinks per any single day for men [15], and moderate physical activity < 150 min/week [16].
The EQ‑5D‑3L instrument
We recorded respondents’ current health status using the paper-based validated Hungarian version of the EQ-5D-3L instrument [10]. EQ-5D-3L is a generic quality-of-life instrument, which consists of two parts [10]. The descrip- tive system assesses self-reported health in five dimensions:
mobility, self-care, usual activities, pain/discomfort and anxiety/depression. Respondents are asked to describe their current health in each dimension with one of the following three categories: no problems, some problems and severe problems. The descriptive system defines 243 (35) distinct health states, denoted by a five-digit profile comprised of the problem levels in each dimension. (e.g. 21,113 indicates moderate problems with mobility and severe problems with anxiety/depression with no problems in other dimensions.) The EQ-5D-3L index scores (utility values) attached to each health state reflect the preferences of the general population.
The EQ-5D-3L index score of 1 represents perfect health, 0 represents death, and negative values represent “worse than dead” health states [17]. Due to the lack of a Hungarian EQ- 5D-3L value set, we used the time trade-off (TTO)-based value set from the UK, which is the most frequently applied EQ-5D-3L value set in the Central and Eastern European (CEE) region [17, 18].
The second part of the instrument is a 20-cm visual ana- logue scale (EQ VAS) ranging from 0 (worst imaginable health) to 100 (best imaginable health). While the EQ-5D-3L descriptive system measures core dimensions of health- related quality of life to provide a single index that reflects preferences of the general population, the EQ VAS reflects the self-rating of the respondents’ overall health including aspects without limiting to the five EQ-5D-3L dimensions [19]. We assigned respondents with one standard deviation (SD) below the mean EQ VAS of the sample to the “poor health” group, respondents within ± 1 SD around the mean to the “average health” group, and respondents with one SD above the sample mean to the “good health” group.
Measuring acceptable health states
We performed computer-assisted personal interviews to assess the acceptability of health states in different ages between 30 and 80 years in 10-year intervals. To allow a
clear separation of these ages from respondents’ own age, we will use “ageAHS” notation when referring to the hypothetical ages used to assess AHSs. In addition to separate evaluation of AHSs by the dimensions of EQ-5D-3L, we applied two novel evaluation methods: (1) joint evaluation of the accept- ability of EQ-5D-3L health profiles using an adaptive testing algorithm, and (2) assessing AHSs by the EQ VAS. Report- ing the results of the adaptive testing and joint evaluation is beyond the scope of this paper.
We assessed AHSs via separate evaluation of problems by dimensions of the EQ-5D-3L descriptive system according to the methods applied in previous studies on the Dutch gen- eral population [7, 8] as well as in Hungarian patients with rheumatoid arthritis [9]. In short, respondents were asked to indicate beyond what age they consider different levels of problems acceptable in each dimension of the EQ-5D-3L.
The sample question for the mobility dimension is depicted in the Online Resource (Supplementary Fig. S1). For each respondent, we constructed acceptable health curves (AHCs) by the methods described by Wouters et al. [7]. First, we assumed that all health problems, that were considered acceptable in a certain ageAHS separately, would also be acceptable in combination. Therefore, we aggregated the individual responses on each EQ-5D-3L domain into a sin- gle EQ-5D-3L health profile for each ageAHS, and attached the EQ-5D-3L index value for these aggregated health pro- files. We will refer to this method using the term “aggregate acceptable health curve (AHCaggregate)” [7–9]. Alternatively, we assumed that respondents would only consider health problems acceptable in each domain with perfect health in mind for the remaining four domains. Therefore, for each ageAHS, we also constructed AHCs using the lowest EQ- 5D-3L index value among the possible EQ-5D-3L profiles having acceptable problems in a single dimension. We will refer to this method using the term “worst acceptable health curve (AHCworst)”. For example, if a respondent indicated moderate mobility problems and severe anxiety/depression acceptable from ageAHS 60 during separate evaluation, then the 0.345 EQ-5D-3L index of the aggregate profile 21,113 would be used in AHCaggregate; while from the profiles 21,111 and 11,113 with EQ-5D-3L index values of 0.85 and 0.414, respectively, lower index would be chosen to con- struct AHCworst. In previous studies, the difference between the AHCaggregate and AHCworst was substantial in ages above 60 years suggesting that these AHCs deviate from the true acceptability threshold [7, 8].
To determine the location of the acceptability threshold, we adapted the EQ VAS instrument. In health valuation studies, multiple health states were recorded on a single EQ VAS [20]; therefore, we asked respondents to indicate the health state that is still acceptable in different ages on the same EQ VAS. To avoid suggesting a ranking on the vertical EQ VAS, we placed ages on a horizontal line at the midpoint
of the EQ VAS and asked respondents to link each age and the VAS with a line. The adapted EQ VAS is shown in the Online Resource (Supplementary Fig. S2). We constructed AHCs from the acceptable EQ VAS scores at each ageAHS, for which we use the term “VAS acceptable health curve (AHCvas)”.
At the end of the evaluation task, we asked respondents about whom they imagined when evaluating the acceptabil- ity of health states. Based on the reference person imagined, respondents were assigned to three categories: those who thought about themselves (“reference: oneself”), those who answered with reference to others (“reference: others”), and those who had both themselves and others in their mind (“reference: mixed”). The joint evaluation of the acceptabil- ity of EQ-5D-3L profiles using the adaptive testing algo- rithm will be described elsewhere.
Statistical analysis
We summarised the key sample characteristics using descriptive methods. Then, we estimated the AHCvas age profiles using a multilevel regression model. In the base- line model (Model 1, Eq. 1), AHCvas was described by an intercept and a slope parameter, which were allowed to vary across individuals according the following equation:
where ageAHSik denotes age when acceptable health is evalu- ated by respondent i for the kth age. We centred ageAHS on 30 years; so, the intercept denoted by represents the popula- tion average level of acceptable health at age 30 (AHCvas30) and μ represents the individual-specific shifts in AHCvas30. The slope denoted by β represents the average acceptable deterioration rate of health with age (ADR) and τ stands for the individual-specific component of ADR. In the model, μ and τ were not estimated directly, but they were modelled as random effects, with only the variance of these parameters estimated.
To evaluate the effect of individual characteristics on acceptable health, the model was augmented by level-2 vari- ables as follows:
where Xi is the vector of individual characteristics of respondent i, the vectors of coefficients are γ and δ repre- senting the effects of Xi, respectively, on the intercept and the slope. While holding X constant at the reference values, α and β represent the intercept and slope parameters, respec- tively. The individual-specific intercept and slope compo- nents that are not explained by X are represented by μ and τ, respectively.
(1) AHCvasik =𝛼 + 𝛽ageAHSik+𝜇i+𝜏i × ageAHSik+𝜀ik,
AHCvasik=𝛼 + 𝛽ageAHSik+𝛾Xi+𝛿ageAHSik (2)
× Xi+𝜇i+𝜏i × ageAHSik+𝜀ik,
We explored the effect of four sets of individual charac- teristics on the AHCvas. The model contained basic demo- graphic characteristics, such as gender, age and education (Model 2). Respondents’ EQ VAS score and health-related lifestyle variables were included as a proxy for “experience with own health” (Model 3). We also included dummy vari- ables to indicate respondents’ reference person when evalu- ating AHSs (Model 4). Finally, we explored the effect of the lifespan of close relatives and caregiver status as indicators for the “experience with others health” (Model 5).
In addition to the linear multilevel model, we also tested alternative AHCvas models. We evaluated model fit by com- paring residual variance ( 𝜎𝜀2 ) and Akaike’s information crite- rion (AIC). First, we compared Model 1 to a restricted speci- fication including only a random intercept, but no random slope term, and a simple linear regression model containing no random terms. Model fit was substantially inferior for these restricted specifications ( 𝜎𝜀2 = 58.2, AIC = 8438 with random intercept only and 𝜎𝜀2 = 199.7, AIC = 9320 with no random term, while 𝜎𝜀2 = 17.2, AIC = 7657 for Model 1).
Second, we also compared Model 1 to a more general specification, allowing for nonlinear effects of ageAHS:
Although the likelihood ratio test was significant ( 𝜒(df2 =4)=187.1, p < 0.0001) indicating better fit for the quadratic model vs the linear one (Model 1), the difference between predicted values were negligible, and the gain in fit was modest ( 𝜎2𝜀 = 10.9, AIC = 7478). Therefore, we favoured the linear model for more straightforward interpretation of the parameters.
Results
Sample characteristics
Altogether, 200 respondents participated in the study; how- ever, only the 194 respondents were included in the analy- ses for whom any AHCvas scores were available. Table 1 summarises the sample descriptive statistics. Mean age was 43.3 years (SD = 17.3), the youngest respondent was 19, and the eldest was 93 years old. Compared to the general popu- lation of Hungary, younger respondents, women, individu- als with high education were slightly over-represented [21], over- and underweight status and high-risk alcohol intake were similar, while smoking and lack of exercise were some- what less prevalent in our sample [22]. Respondents’ own health measured by the EQ-5D-3L index and EQ VAS scores are displayed in Fig. 1a. Full AHCvas across all six ageAHS were available for 188 respondents (94%).
AHCvasik=𝛼 + 𝛽ageAHSik+𝜃age2AHSik+𝜇i+𝜏i (3)
× ageAHSik+𝜗i × age2AHSik+𝜀ik.
Acceptability of health states
Acceptable health curves measured by EQ VAS score (AHCvas) and EQ-5D-3L index (AHCaggregate, AHCworst)
are shown in Fig. 1b. For ages of 30, 40, 50, 60, 70 and 80 years, mean AHCvas scores were 93, 87, 80, 73, 65 and 57, respectively. Both AHCvas and the EQ-5D-3L index- based measures, AHCaggregate and AHCworst indicated that respondents considered health problems increasingly acceptable in older ages. However, the age profiles were markedly different. While AHCaggregate indicated a rapid and nonlinear decline of acceptable health, AHCworst and AHCvas showed a modest nonlinear decline in simi- lar range to respondents’ own EQ-5D-3L index scores, and own EQ VAS scores, respectively. We also observed differences between the EQ VAS-based and EQ-5D-3L index-based curves in their dispersion characteristics (Fig. 2a and b). The mean interquartile range (IQR) of EQ VAS by age group was 17 points (range 10–25); the mean IQR of AHCvas by ageAHS group was rather similar: 19 points (range 10–28). However, the average IQR by age or ageAHS group was 0.19 (range 0.152–0.344), 0.22 (range 0–0.532), 0.33 (range 0–0.874) for EQ-5D-3L index, AHCworst and AHCaggregate, respectively. The dispersion for all measures was greatest in older ageAHS groups.
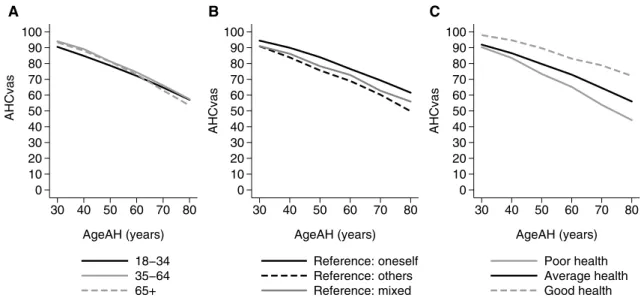
Next, we explored the differences of AHCvas between subgroups of the sample. Figure 2a shows the AHCvas by respondents’ age groups. The AHCvas profiles were simi- lar for the three age groups. Both the youngest and oldest respondents considered somewhat lower levels of health acceptable for their own ageAHS groups. Figure 2b com- pares AHCvas for the three types of respondents based on the reference person they imagined during the evaluation task. Those who imagined themselves when evaluating AHSs (“reference: oneself” group) considered the least health problems acceptable. Moreover, AHCvas declined more rapidly in the “reference: others” group compared to the “reference: oneself” or “reference: mixed” groups.
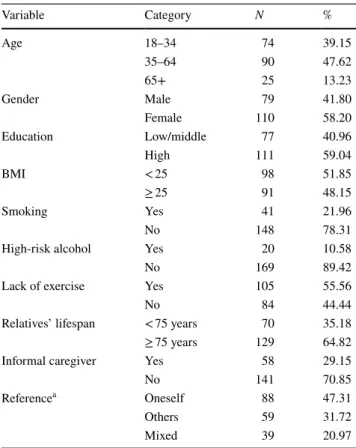
Table 1 Descriptive statistics of demographic characteristics and ref- erence person when evaluating acceptable health
a The person the respondent had in mind when considered the accept- ability of health states for different ages
Variable Category N %
Age 18–34 74 39.15
35–64 90 47.62
65+ 25 13.23
Gender Male 79 41.80
Female 110 58.20
Education Low/middle 77 40.96
High 111 59.04
BMI < 25 98 51.85
≥ 25 91 48.15
Smoking Yes 41 21.96
No 148 78.31
High-risk alcohol Yes 20 10.58
No 169 89.42
Lack of exercise Yes 105 55.56
No 84 44.44
Relatives’ lifespan < 75 years 70 35.18
≥ 75 years 129 64.82
Informal caregiver Yes 58 29.15
No 141 70.85
Referencea Oneself 88 47.31
Others 59 31.72
Mixed 39 20.97
0 .1 .2 .3 .4 .5 .6 .7 .8 .9 1
EQ−5D−3L index score
0 10 20 30 40 50 60 70 80 90 100
EQ VAS
18−24 25−34 35−44 45−54 55−64 65−74 75+
Respondents’ age (years) EQ VAS EQ−5D Index
A
0 .1 .2 .3 .4 .5 .6 .7 .8 .9 1
AHCaggregate, AHCworst
0 10 20 30 40 50 60 70 80 90 100
AHCvas
30 40 50 60 70 80
AgeAHS (years)
AHCvas AHCworst
AHCaggregate
B
Fig. 1 Respondents’ own health status and acceptable health curves.
a own health measured by the EQ-5D-3L and EQ VAS; b acceptable health curves: AHCvas (VAS acceptable health curve), AHCaggregate (aggregate acceptable health curve), AHCworst (worst acceptable
health curve). Line graphs, diamonds and vertical lines indicate mean values, medians and interquartile ranges (IQR), respectively. The 25th percentile of AHCaggregate at ageAHS 80 years was − 0.358 (truncated at 0 on the graph)
We also explored how respondents’ health affected their AHCvas (Fig. 2c). The data suggest that respond- ents who were healthier compared to the sample aver- age (higher EQ VAS scores), accepted less health prob- lems (higher AHCvas) than the ones who indicated more subjective health problems on the EQ VAS.
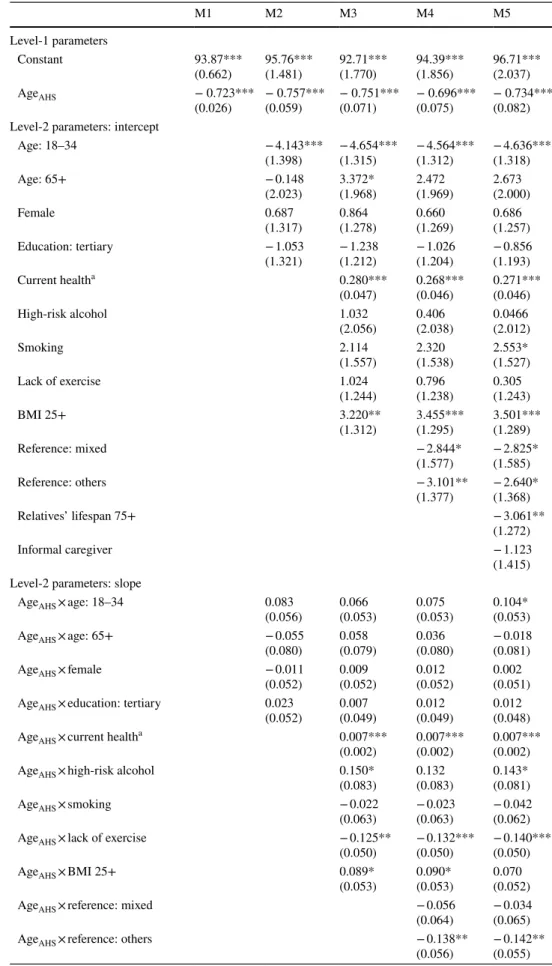
Factors affecting the acceptability of health states Table 2 presents the results of multilevel regression esti- mates. The baseline model (M1) confirmed that there were significant differences in both the level of AHCvas and the slope of ageAHS among respondents. The estimated level of AHCvas at ageAHS 30 years had a mean of 93.4, with a sig- nificant variance over respondents indicated by the random effect (SD 8.7 points, p < 0.001). AHCvas decreased by 7.2 points with a 10-year increase in ageAHS on average, while the SD of ADR per 10 years was 3.4 points (p < 0.001).
When interpreting the regression results, lower intercept (lower AHCvas at ageAHS 30) and smaller slope coefficients (greater ADR) indicate more acceptable health problems.
We estimated the effect of individual characteristics on AHCvas by adding four groups of explanatory variables to the base model in a stepwise manner. Altogether, individual characteristics accounted for a moderate share of the vari- ation in the slope and level of AHCvas. Compared with the baseline model, in the full specification (M5), 2/3 of the variance of the intercept and ¾ of the variance of the slope parameter remained unexplained.
Compared to the reference group (35–64), young respondents reported a lower level of acceptable health.
Education and gender had no detectable effect. ADR was only minimally affected by demographic variables. Cur- rent health status, measured on the EQ VAS, was asso- ciated with both the level and the slope of the age pro- files. Healthier respondents tended to accept a less rapid deterioration of health with age, and also considered a higher level of health acceptable at the ageAHS of 30. A one SD difference in current health implied 4 points higher AHCvas at the ageAHS of 30, and 1.1 points smaller ADR per 10 years. Lifestyle variables had a weak effect. Lack of exercise and high BMI were associated with, respectively, greater ADR and higher level of AHCvas, in line with the expectation of more health problems.
In Model 4, the reference person when evaluating acceptability was also added. The results confirm the pat- tern of Fig. 3b. Respondents who evaluated health states with respect to themselves set the level of AHCvas higher at the ageAHS of 30 and were willing to accept only a less rapid decline with age than respondents evaluating accept- ability with reference to others. Those with a mixed refer- ence were in between these two types.
Finally, relative’s longer lifespan was associated with a lower level of AHCvas, while respondents with a caregiver experience reported a smaller ADR.
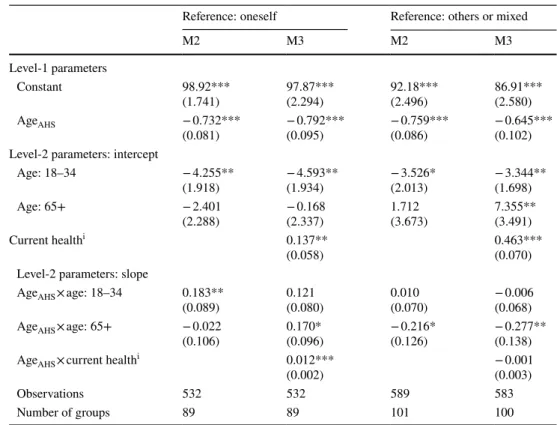
Next, we explored the effect of the reference person when evaluating acceptability, current health and age in more detail. We re-estimated the models M2 and M3 for two sub- groups: respondents, who thought only about themselves
0 10 20 30 40 50 60 70 80 90 100
AHCvas
30 40 50 60 70 80 AgeAH (years)
18−34 35−64 65+
A
0 10 20 30 40 50 60 70 80 90 100
AHCvas
30 40 50 60 70 80 AgeAH (years)
Reference: oneself Reference: others Reference: mixed
B
0 10 20 30 40 50 60 70 80 90 100
AHCvas
30 40 50 60 70 80 AgeAH (years)
Poor health Average health Good health
C
Fig. 2 Acceptable health curves measured on EQ VAS (AHCVAS) by respondents’ subgroups. a By respondents’ age group; b by respond- ents’ reference person during the evaluation task; c by respondents’
own health; “reference: oneself“: respondents thinking of themselves during the evaluation task; “reference: other”: respondents thinking
of others during the evaluation task; “reference: mixed”: respondents thinking of themselves and others during the evaluation task; “poor health”: ≤ sample mean EQ VAS − 1SD; “average health”: sample mean EQ VAS ± 1 SD; “good health”: ≥ sample mean EQ VAS + 1 SD
Table 2 Multilevel regression
models of AHCvas M1 M2 M3 M4 M5
Level-1 parameters
Constant 93.87***
(0.662) 95.76***
(1.481) 92.71***
(1.770) 94.39***
(1.856) 96.71***
(2.037)
AgeAHS − 0.723***
(0.026) − 0.757***
(0.059) − 0.751***
(0.071) − 0.696***
(0.075) − 0.734***
(0.082) Level-2 parameters: intercept
Age: 18–34 − 4.143***
(1.398) − 4.654***
(1.315) − 4.564***
(1.312) − 4.636***
(1.318)
Age: 65+ − 0.148
(2.023) 3.372*
(1.968) 2.472
(1.969) 2.673 (2.000)
Female 0.687
(1.317) 0.864
(1.278) 0.660
(1.269) 0.686 (1.257)
Education: tertiary − 1.053
(1.321) − 1.238
(1.212) − 1.026
(1.204) − 0.856 (1.193)
Current healtha 0.280***
(0.047) 0.268***
(0.046) 0.271***
(0.046)
High-risk alcohol 1.032
(2.056) 0.406
(2.038) 0.0466 (2.012)
Smoking 2.114
(1.557) 2.320
(1.538) 2.553*
(1.527)
Lack of exercise 1.024
(1.244) 0.796
(1.238) 0.305 (1.243)
BMI 25+ 3.220**
(1.312) 3.455***
(1.295) 3.501***
(1.289)
Reference: mixed − 2.844*
(1.577) − 2.825*
(1.585)
Reference: others − 3.101**
(1.377) − 2.640*
(1.368)
Relatives’ lifespan 75+ − 3.061**
(1.272)
Informal caregiver − 1.123
(1.415) Level-2 parameters: slope
AgeAHS × age: 18–34 0.083
(0.056) 0.066
(0.053) 0.075
(0.053) 0.104*
(0.053)
AgeAHS × age: 65+ − 0.055
(0.080) 0.058
(0.079) 0.036
(0.080) − 0.018 (0.081)
AgeAHS × female − 0.011
(0.052) 0.009
(0.052) 0.012
(0.052) 0.002 (0.051) AgeAHS × education: tertiary 0.023
(0.052) 0.007
(0.049) 0.012
(0.049) 0.012 (0.048)
AgeAHS × current healtha 0.007***
(0.002) 0.007***
(0.002) 0.007***
(0.002)
AgeAHS × high-risk alcohol 0.150*
(0.083) 0.132
(0.083) 0.143*
(0.081)
AgeAHS × smoking − 0.022
(0.063) − 0.023
(0.063) − 0.042 (0.062)
AgeAHS × lack of exercise − 0.125**
(0.050) − 0.132***
(0.050) − 0.140***
(0.050)
AgeAHS × BMI 25+ 0.089*
(0.053) 0.090*
(0.053) 0.070 (0.052)
AgeAHS × reference: mixed − 0.056
(0.064) − 0.034 (0.065)
AgeAHS × reference: others − 0.138**
(0.056) − 0.142**
(0.055)
(reference: oneself) and the ones who also thought about others (reference: others or reference:mixed groups).
(Table 3) Current health had a smaller effect on the level of AHCvas at the ageAHS of 30 in case of respondents think- ing of themselves than in the other or mixed reference sub- sample. At the same time, better current health was associ- ated with greater ADR in the first subsample only. These differences are shown by Fig. 3. Predicted AHCvas values were calculated for three otherwise identical representative individuals with poor, average and good current health, for both subsamples. Respondents in poor health and thinking of themselves accepted a stronger decline of health with age.
Discussion
To our knowledge, this is the first study that explored accept- able health states using the EQ VAS instrument. We found that the modified EQ VAS was a feasible and convenient measure of AHSs for vast majority of our respondents. Our findings confirm previous research results that people find worsening of health with age acceptable [7–9]. The core hypothesis is that respondents have internal age-dependent reference points against which they judge the acceptability of health states.
Previous studies measured AHSs using the descriptive system of the EQ-5D-3L instrument. In these studies, AHSs were assessed separately by the five dimensions of the EQ- 5D-3L, and assumptions were made about the acceptability
Standard errors in parentheses
***p < 0.01, **p < 0.05, *p < 0.1
a Current health is measured on the EQVAS scale, centred on the sample mean
Table 2 (continued) M1 M2 M3 M4 M5
AgeAHS × relative’s lifespan 75+ 0.007
(0.052)
AgeAHS × informal caregiver 0.166***
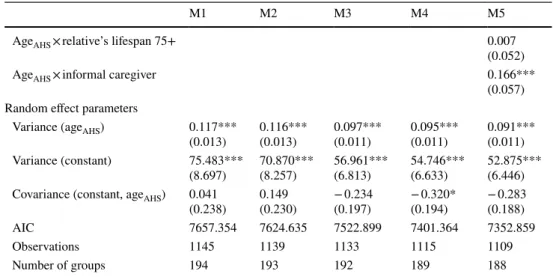
(0.057) Random effect parameters
Variance (ageAHS) 0.117***
(0.013) 0.116***
(0.013) 0.097***
(0.011) 0.095***
(0.011) 0.091***
(0.011) Variance (constant) 75.483***
(8.697) 70.870***
(8.257) 56.961***
(6.813) 54.746***
(6.633) 52.875***
(6.446) Covariance (constant, ageAHS) 0.041
(0.238) 0.149
(0.230) − 0.234
(0.197) − 0.320*
(0.194) − 0.283 (0.188)
AIC 7657.354 7624.635 7522.899 7401.364 7352.859
Observations 1145 1139 1133 1115 1109
Number of groups 194 193 192 189 188
Fig. 3 Predicted AHCvas for reference person subsamples by respondents’ own health. A
“Reference: oneself”: respond- ents thinking of themselves during the evaluation task; b
“reference: other and mixed”:
respondents thinking of oth- ers, or others and themselves;
predicted AHCvas for male, age 35–64, education: middle or low, with no health-related risks; “poor health”: ≤ sam- ple mean EQ VAS − 1 SD;
“average health”: sample mean EQ VAS ± 1 SD; “good health”: ≥ sample mean EQ VAS + 1 SD
0 10 20 30 40 50 60 70 80 90 100
AHCvas
30 40 50 60 70 80
AgeAH (years) Poor Health Average Health Good Health
A
0 10 20 30 40 50 60 70 80 90 100
AHCvas
30 40 50 60 70 80
AgeAH (years) Poor Health Average Health Good Health
B
simultaneous health problems in more than one EQ-5D-3L dimension. Although the acceptability of a few EQ-5D-3L health states profiles was also evaluated, current knowledge is limited about how people jointly evaluate the acceptabil- ity of simultaneous problems in multiple dimensions. One of the benefits of using the EQ VAS is that it provides a single score about where acceptable health states lie com- pared to the best and worst imaginable overall health status.
The moderate slope of the AHCvas with age suggested that by evaluating the acceptability of health states globally, in older ages people are less likely to accept as many com- bined problems as suggested by the AHCaggregate. Moreover, the dispersion of AHCvas was well below the variation of EQ-5D-3L descriptive system-based AHCs, suggesting that using EQ VAS may allow for defining and detecting accept- ability thresholds more precisely. While the dispersion of AHCvas was similar to that of the measures of current health, the greater dispersion of AHCaggregate suggests that consid- erable measurement error arises from the construction of AHCs from the separately evaluated AHSs by dimension.
However, since the AHCaggregate is artificially constructed from EQ-5D-3L index values, which reflect societal pref- erences rather than each respondents’ global evaluation of
individual health [20], the AHCaggregate and AHCvas are not directly comparable measures of AHSs.
Although it may be hypothesised that underlying health preferences influence the acceptability of health problems, the evaluation exercise of acceptable health problems is dif- ferent in many aspects from health-state valuation tasks: it does not involve assumptions about death, expected lifes- pan, nor trade-off or risk-evaluation is involved [12, 23].
Although the cognitive processes behind the evaluation exer- cise of acceptable health are yet to be explored, our results confirm previous findings that respondents’ age, health sta- tus, lifestyle, and other health-related experiences, such as informal caregiver status or the lifespan of close relatives influence the internal reference for acceptable health.
We found that ceteris paribus, the younger respondents reported in younger ages more, and in older ages less health problems acceptable compared to older ones. Other stud- ies demonstrated greater acceptability of health problems by elderly respondents in the general population [7], and in patients with RA [9]. In our study, worse current health of respondents was associated with more acceptable health prob- lems. In the Dutch general population study, suffering from a severe disorder or having a chronic condition was not associ- ated with the acceptability of health problems [7], while lower
Table 3 Multilevel regression models of AHCVAS for subsamples by reference person when evaluating acceptable health problems
Standard errors in parentheses
Specifications identical to M2 and M3 of Table 2
***p < 0.01, **p < 0.05, *p < 0.1
a Current health is measured on the EQVAS scale, centred on the sample mean
Reference: oneself Reference: others or mixed
M2 M3 M2 M3
Level-1 parameters
Constant 98.92***
(1.741) 97.87***
(2.294) 92.18***
(2.496) 86.91***
(2.580)
AgeAHS − 0.732***
(0.081) − 0.792***
(0.095) − 0.759***
(0.086) − 0.645***
(0.102) Level-2 parameters: intercept
Age: 18–34 − 4.255**
(1.918) − 4.593**
(1.934) − 3.526*
(2.013) − 3.344**
(1.698)
Age: 65+ − 2.401
(2.288) − 0.168
(2.337) 1.712
(3.673) 7.355**
(3.491)
Current healthi 0.137**
(0.058) 0.463***
(0.070) Level-2 parameters: slope
AgeAHS × age: 18–34 0.183**
(0.089) 0.121
(0.080) 0.010
(0.070) − 0.006
(0.068) AgeAHS × age: 65+ − 0.022
(0.106) 0.170*
(0.096) − 0.216*
(0.126) − 0.277**
(0.138) AgeAHS × current healthi 0.012***
(0.002) − 0.001
(0.003)
Observations 532 532 589 583
Number of groups 89 89 101 100
EQ VAS scores of Hungarian RA patients predicted more acceptable health problems [9]. Patients’ adaptation to their conditions affects the valuation of health states [24] which may also increase the acceptability of non-perfect health by older individuals experiencing health problems.
In addition to older respondents, the younger age group also deserves attention. The relationship of age and health- state utilities was bell-shaped in the UK TTO EQ-5D valua- tion study [25] and we found increased acceptability of health problems in the 18–34-year-old age group. Perceived severity of health outcomes may play a role in the prevention of health- risk behaviours [26], an important health concern among young adults [27]. Acceptability of health problems may be linked to the perception of health risks by younger adults, although this hypothesis needs empirical testing. Therefore, the complex interplay between the effects of respondents’
health and age on the acceptability of health problems requires further investigation, which may provide useful insights to health valuation as well as health prevention research.
Lifestyle-related variables influenced the acceptability of health problems in both our sample and the Dutch general population, albeit in different ways. In the Dutch population, healthy diet was associated with significantly fewer acceptable health problems. In our sample, lack of exercise was associ- ated with more (greater ADR), while high BMI and high-risk alcohol intake were associated with less acceptable health problems. Longer lifespan of close relatives was associated with more acceptable health problems in our study, while had opposite effect in the Dutch study. We also found that being a caregiver was associated with less AHSs (via lower ADR).
These findings warrant deeper qualitative investigation of the experiences and attitudes about own and others’ health and the context that shape the acceptability of health problems.
We find important to note that the effects of explanatory variables need to be interpreted in the light of the potentially different measurement properties of our methods as well as different preferences of the studied populations. Wout- ers et al. recruited an online sample of the Dutch general population (n = 1067), and constructed an area under curve (AUC) AHCaggregate values between 40 years of ageAHS and the expected lifespan of respondents to study the effect of explanatory variables on AHSs [7]. We conducted computer- assisted interviews in the Hungarian population, and evalu- ated the level and slope parameters of the AHCvas separately as measures of AHSs.
In addition to the four scenarios of health preference eval- uation (general public vs patients, own vs hypothetical health states), the evaluation of AHSs in different ages involves a new hypothetical situation [23]. Our study provided insights about people’s opinion formulating mechanisms when evalu- ating AHSs. Despite the neutral question, approximately half of the respondents imagined themselves, one-third others and one-fifth both themselves and others during the evaluation
task. Mulhern et al. [28] found similar respondent subtypes when evaluating hypothetical health states. We also found that the reference person respondents imagined affected the way respondent’s age and health status influenced the evalua- tion of AHSs, which warrants further investigation as well as methodological refinement of the evaluation exercise.
Our research has three important limitations. First, our sample was a small non-representative sample of the Hun- garian population, which limits the generalisation of our findings. Second, although the EQ VAS has been validated for measuring the current health status of responders, its psychometric properties has not been formally tested and validated for the measurement of AHSs. For instance, respondents may have provided systematic answers on the single VAS scale, which needs further exploration. Also, because some authors raised theoretical concerns about using the EQ VAS for health economic evaluation [12] the theoretical and ethical basis how VAS-based measures of AHSs could inform decision-making have yet to be deter- mined. However, our results showed that EQ VAS has prom- ising properties in the evaluation of AHSs, warranting fur- ther exploration of the acceptable health concept.
Conclusions
We measured AHSs in different ages by adapting the EQ VAS, which proved to be a convenient and feasible measure.
Our findings confirmed that health problems are increasingly acceptable with age. The comparison of VAS-based and EQ- 5D-3L index-based measures suggested that the amount of acceptable health deterioration with age depends on the measurement method. In our sample, respondents’ age, health status, lifestyle, and other health-related experiences influenced the evaluation of acceptable health problems.
We also found that people imagined themselves, others or both during the evaluation of acceptable health, which also influenced the evaluation of AHSs. However, our non-repre- sentative sample limits the generalizability of our findings.
AHSs may indicate societal preferences about the sever- ity of disease and age in a single measure, and may serve as a reference point in healthcare priority setting. However, measuring AHSs need further theoretical and methodologi- cal exploration, before their practical application can be considered.
Acknowledgements Open access funding provided by Corvinus Uni- versity of Budapest (BCE). This research was supported by the Higher Education Institutional Excellence Program of the Ministry of Human Capacities in the framework of the ‘Financial and Public Services’
research project (20764-3/2018/FEKUTSTRAT) at Corvinus Univer- sity of Budapest.
Compliance with ethical standards
Conflict of interest In connection with writing this article, ZZ and HZ received grant support from the Higher Education Institutional Excel- lence Program of the Ministry of Human Capacities in the framework of the ‘Financial and Public Services’ research project (20764-3/2018/
FEKUTSTRAT) at Corvinus University of Budapest. VB, LG, FR, MP report no conflict of interest.
Ethical approval All procedures performed in studies involving human participants were in accordance with the 1964 Helsinki declaration and its later amendments or comparable ethical standards. Ethical approval of the Medical Research Council of Hungary (ID: 5111-2/2018/EKU) was obtained before the enrollment of participants. Informed consent was obtained from all individual participants included in the study.
The article does not contain any studies with animals performed by any of the authors.
Open Access This article is distributed under the terms of the Crea- tive Commons Attribution 4.0 International License (http://creat iveco mmons .org/licen ses/by/4.0/), which permits unrestricted use, distribu- tion, and reproduction in any medium, provided you give appropriate credit to the original author(s) and the source, provide a link to the Creative Commons license, and indicate if changes were made.
References
1. OECD: Fiscal sustainability of health systems: bridging health and finance perspectives. OECD Publishing, Paris (2015) 2. Wouters, S., van Exel, N.J.A., Rohde, K.I.M., Vromen, J.J., Brou-
wer, W.B.F.: Acceptable health and priority weighting: discussing a reference-level approach using sufficientarian reasoning. Soc.
Sci. Med. 181, 158–167 (2017). https ://doi.org/10.1016/j.socsc imed.2017.03.051
3. Williams, A.: Intergenerational equity: an exporation of the ‘fair innings’ argument. Health Econ. 6, 117–132 (1997)
4. Parfit, D.: Equality or priority? University of Kansas, Lawrence (1995)
5. Ottersen, T., Maestad, O., Norheim, O.F.: Lifetime QALY pri- oritarianism in priority setting: quantification of the inherent trade-off. Cost Eff. Resour. Alloc. 12(1), 2 (2014). https ://doi.
org/10.1186/1478-7547-12-2
6. Gosseries, A.: Sufficientarianism. In: Routledge Encyclo- pedia of Philosophy, Tailor and Francis, (2011). https ://doi.
org/10.4324/97804 15249 126-S112-1
7. Wouters, S., van Exel, N.J., Rohde, K.I., Brouwer, W.B.: Are all health gains equally important? An exploration of acceptable health as a reference point in health care priority setting. Health Qual. Life Outcomes 13, 79 (2015). https ://doi.org/10.1186/
s1295 5-015-0277-6
8. Brouwer, W.B.F., van Exel, N.J.A., Stolk, E.A.: Acceptability of less than perfect health states. Soc. Sci. Med. 60(2), 237–246 (2005). https ://doi.org/10.1016/j.socsc imed.2004.04.032 9. Pentek, M., Rojkovich, B., Czirjak, L., Geher, P., Keszthelyi,
P., Kovacs, A., Kovacs, L., Szabo, Z., Szekanecz, Z., Tamasi, L., Toth, A.E., Ujfalussy, I., Hever, N.V., Strbak, B., Baji, P., Brodszky, V., Gulacsi, L.: Acceptability of less than perfect health states in rheumatoid arthritis: the patients’ perspective.
Eur. J. Health Econ. 15(Suppl 1), S73–S82 (2014). https ://doi.
org/10.1007/s1019 8-014-0596-2
10. EuroQoL Group: EuroQol–a new facility for the measurement of health-related quality of life. Health Policy 16(3), 199–208 (1990)
11. d’Aspremont, C., Gevers, L.: Social welfare functionals and inter- personal comparability. In: Arrow, K., Sen, A., Suzumura, K.
(eds.) Handbook of social choice and welfare, vol. 1, pp. 459–541.
Elsevier, New York (2002)
12. Parkin, D., Devlin, N.: Is there a case for using visual analogue scale valuations in cost-utility analysis? Health Econ. 15(7), 653–
664 (2006). https ://doi.org/10.1002/hec.1086
13. Garrow, J.: Treat obesity seriously: a clinical manual. Churchill Livingstone, Edinburgh (1981)
14. Schane, R.E., Ling, P.M., Glantz, S.A.: Health effects of light and intermittent smoking: a review. Circulation 121(13), 1518–1522 (2010). https ://doi.org/10.1161/CIRCU LATIO NAHA.109.90423 5 15. NIAAA, N.I.o.A.A.a.A.: Alcohol facts and Statistics. https ://www.
niaaa .nih.gov/alcoh ol-healt h/overv iew-alcoh ol-consu mptio n/
alcoh ol-facts -and-stati stics . Accessed 1 October 2017
16. WHO, W.H.O.: Recommended levels of physical activity for adults aged 18 - 64 years. https ://www.who.int/dietp hysic alact ivity /facts heet_adult s/en/. Accessed 1 October 2017
17. Dolan, P.: Modeling valuations for EuroQol health states. Med.
Care 35(11), 1095–1108 (1997)
18. Rencz, F., Gulacsi, L., Drummond, M., Golicki, D., Prevolnik Rupel, V., Simon, J., Stolk, E.A., Brodszky, V., Baji, P., Zavada, J., Petrova, G., Rotar, A., Pentek, M.: EQ-5D in Central and Eastern Europe: 2000–2015. Qual. Life Res. 25(11), 2693–2710 (2016).
https ://doi.org/10.1007/s1113 6-016-1375-6
19. Feng, Y., Parkin, D., Devlin, N.J.: Assessing the performance of the EQ-VAS in the NHS PROMs programme. Qual. Life Res. 23(3), 977–989 (2014). https ://doi.org/10.1007/s1113 6-013-0537-z 20. Brooks, R., Rabin, R., de Charro, F.: The measurement and valu-
ation of health status using EQ-5D: a European perspective. Klu- wer Academic Publishers, Dordrecht (2003)
21. KSH, H.C.S.O.: Population Census 2011. http://www.ksh.hu/nepsz amlal as/table s_regio nal_00 (2011). Accessed 1 October 2017 22. KSH, H.C.S.O.: ELEF - European Health Interview Survey 2014.
http://www.ksh.hu/elef/kiadv anyok _ossze fogla lo_adato k.html (2014)
23. Brazier, J., Rowen, D., Karimi, M., Peasgood, T., Tsuchiya, A., Ratcliffe, J.: Experience-based utility and own health state valua- tion for a health state classification system: why and how to do it.
Eur J Health Econ 19(6), 881–891 (2018). https ://doi.org/10.1007/
s1019 8-017-0931-5
24. Ubel, P.A., Loewenstein, G., Jepson, C.: Whose quality of life? A commentary exploring discrepancies between health state evalu- ations of patients and the general public. Qual. Life Res. 12(6), 599–607 (2003). https ://doi.org/10.1023/a:10251 19931 010 25. Dolan, P., Roberts, J.: To what extent can we explain time trade-
off values from other information about respondents? Soc. Sci.
Med. 54(6), 919–929 (2002). https ://doi.org/10.1016/s0277 -9536(01)00066 -1
26. Cohen, D.R.: Utility model of preventive behaviour. J. Epidemiol.
Community Health 38(1), 61–65 (1984)
27. Scott, S., Beyer, F., Parkinson, K., Muir, C., Graye, A., Kaner, E., Stead, M., Power, C., Fitzgerald, N., Bradley, J., Wrieden, W., Adamson, A.: Non-pharmacological interventions to reduce unhealthy eating and risky drinking in young adults aged 18–25 years: a systematic review and meta-analysis. Nutrients 10(10), 1538 (2018). https ://doi.org/10.3390/nu101 01538
28. Mulhern, B., Tsuchiya, A., Devlin, N., Buckingham, K., Rowen, D., Brazier, J.: A comparison of three binary choice methods for health state valuation. In: Health Economics and Decision Science (HEDS) Discussion Paper, vol. DP 13/07. http://www.cesas so.org/
sites /defau lt/files /Mulhe rn%20et%20a%20HES G%20pap er%20for
%20Aix %20en%20Pro vence .pdf (2013)
Publisher’s Note Springer Nature remains neutral with regard to jurisdictional claims in published maps and institutional affiliations.