https://doi.org/10.1007/s10198-021-01325-w ORIGINAL PAPER
Comparing the measurement properties of the ICECAP‑A
and ICECAP‑O instruments in ages 50–70: a cross‑sectional study on a representative sample of the Hungarian general population
Petra Baji1 · Miklós Farkas2 · Ágota Dobos3 · Zsombor Zrubka4,5 · Levente Kovács6 · László Gulácsi4,5 · Márta Péntek4
Received: 1 November 2020 / Accepted: 18 May 2021
© The Author(s) 2021
Abstract
Objective The ICECAP-A and ICECAP-O were validated as capability wellbeing measures of adults aged 18 + and 65 + years, respectively. We aimed to compare their measurement properties in age group 50–70.
Methods Data were derived from a cross-sectional survey among a sample representative for the adult Hungarian popula- tion. Respondents aged between 50 and 70 filled in both the ICECAP-A and ICECAP-O questionnaires. We assessed and compared feasibility, agreement, discriminatory power, convergent and content validity of the two instruments and explored the determinants of the differences between the two measures.
Results 707 respondents (99.4%) provided full answers to both questionnaires (46.3% women, average age 60.1 years).
The instruments showed similar construct and convergent validity and discriminatory power. Pearson-correlations between instrument items were strong (r > 0.5). ICECAP-A and ICECAP-O scores could be calculated from each other with a good confidence (R2 = 0.69 and 0.71). ICECAP-O scores (mean 0.87, SD = 0.12) were systematically higher than ICECAP-A scores (0.85, SD = 0.15) in most subgroups. The difference increased with the deterioration of capability and health, and with age. Regression results showed that employment and health status had larger marginal effect on the ICECAP-A than on the ICECAP-O scores, and these effects were larger than the effect of age on both measures.
Conclusion Validity of both instruments was confirmed in the age groups 50–70. Given that employment and health status are important determinants of the differences between the two instruments besides age, the possibility of linking the choice between ICECAP-A and ICECAP-O to these factors should be investigated by further research.
Keywords Capability · ICECAP-A · ICECAP-O · Validity · EQ-5D-5L JEL Classification I19
* Petra Baji
petra.baji@uni-corvinus.hu
1 Department of Health Economics, Corvinus University of Budapest, Fővám tér 8, Budapest 1093, Hungary
2 School of Accounting and Finance, University of Bristol, Bristol, UK
3 Corvinus Center for Foreign Language Education and Research, Corvinus University of Budapest, Budapest, Hungary
4 Health Economics Research Center-University Research and Innovation Center, Óbuda University, Budapest, Hungary
5 Corvinus Institute for Advanced Studies, Corvinus University of Budapest, Budapest, Hungary
6 Physiological Controls Research Center-University Research and Innovation Center, Óbuda University, Budapest, Hungary
Introduction
There is an increasing demand in health economic evalua- tions to extend the measurement of benefit beyond health and health-related quality of life (HRQoL) and to capture other important aspects of wellbeing. The ICECAP instru- ments [the ICECAP-A (ICEpop CAPability measure for adults) and ICECAP-O (ICEpop CAPability measure for older people)] have been developed to serve such purpose and have gained popularity in the recent years. These are preference-based wellbeing measures, building on Amartya Sen’s capability approach, which defines wellbeing in terms of an individual’s ability and capability to do certain things that are important in life [1]. The use of such measures has increased in economic evaluations in the recent years [2, 3], and regulatory bodies such as The National Institute for Health and Care Excellence (NICE) encourage their use for measuring the impact of social care interventions [4, 5].
The two instruments differ in the age of their recom- mended target population. First, the ICECAP-O instrument has been developed to be applied among the older popula- tion of 65 years and over [6, 7]. Then, a more general ver- sion, the ICECAP-A instrument has been created for the use among the general adult population of 18 years and older [8].
Both measures cover five domains of wellbeing (ICECAP-A:
attachment, stability, achievement, enjoyment, autonomy;
ICECAP-O: attachment, security, role, enjoyment, control) that were found to be important to their target population in the UK by qualitative research [7, 8]. Although there seem to be overlapping domains between the two measures (attach- ment, enjoyment, autonomy/control), only autonomy/con- trol is surveyed identically (e.g. ‘I am able to be completely independent’). Attachment and enjoyment are addressed differently, expressing somewhat different angles in the two measures (e.g. attachment: ICECAP-A ‘I can have a lot of love, friendship and support’ vs. ICECAP-O ‘I can have all of the love and friendship that I want’). The largest differ- ences appear in the stability/security and achievement/role domains, where there is more emphasis on concerns (‘think- ing about the future’) and feeling valuable (‘doing things that make you feel valued’) in the ICECAP-O, while stability (‘feeling settled and secure’) and evolution (‘achievement and progress’) are in focus in the ICECAP-A.
Several studies assessed the validity of the ICECAP-A and ICECAP-O measures [5, 6, 9–20]. However, no quanti- tative studies compared the measurement properties of the ICECAP-A and ICECAP-O measures among elderly (aged 65 +) respondents [21], who are the target population of both instruments. We assume that the ICECAP-A might be more relevant than the ICECAP-O for individuals over 65, whose life circumstances are more similar to that of younger adults. Moreover, we hypothesize that the ICECAP-O might
be more adequate than the ICECAP-A under age 65 for some subgroups of people, especially for those whose health and socioeconomic status resembles more to that of the elderly (e.g. having health problems, being pensioner or disability pensioner).
Thus, the aim of the study was to compare measurement properties of the ICECAP-A and ICECAP-O instruments on a sample of adult general population between the ages of 50 and 70. First, we aim to compare discriminatory power, con- vergent and content validity of the two instruments. Second, we assess agreement and explore the determinants of the differences between the two measures. We are specifically interested if there are any other circumstances apart from age that can motivate/justify the choice between the two instru- ments in research studies and in economic evaluations.
Methods
The survey and the questionnaire
The data for this study come from a major cross-sectional survey (performed by our research group) with the primary objective to measure the health status and wellbeing of the Hungarian population [9, 22]. The survey was conducted by computer-assisted personal interviews on a representative sample for the Hungarian adult population (N = 2023). In the data collection, quotas were employed to obtain a rep- resentative sample in terms of age, gender, and residence.
The recruitment of the respondents and the interviews were carried out by a survey company (New Land Media Kft.). Interviewers received specific training on the content and purpose of the survey. The study was approved by the Hungarian Medical Research Council (Nr. 10058-3/2019/
EKU). Participation in the study was completely voluntary and respondents’ personal data remained anonymous for the analyses. Respondents provided their written informed con- sent at the start of the survey.
The survey questions covered socio-demographics (such as age, gender, education, marital status, employment sta- tus, household size, monthly net household income, place of residence); health; wellbeing, happiness and satisfaction.
The validated Hungarian language versions of the ICECAP- A and ICECAP-O questionnaires (see below) were applied [9]. Respondents between the ages of 50–70 filled in the paper-based self-completed versions of both the ICECAP- A and ICECAP-O questionnaires. (Respondents under the age of 50 filled in only the ICECAP-A questionnaire, while respondents over 70 filled in only the ICECAP-O question- naire.) Our choice for this age group was driven partly by the 65 years age limit of ICECAP-O and partly by the retirement age in Hungary (64–65 years in 2019). The upper age limit (70 years) was set to allow the involvement of individuals
over the age of 65 who are in relatively good health while working in a paid job. The lower age limit was broader as activity limitations due to health problems is substantial already at the age of 50 (about 25% [23]) and the share of disability pensioners increases substantially from this age [24]. We used the best–worst scaling method-based UK tar- iffs to calculate ICECAP-A and ICECAP-O index scores as tariffs were not available from any other country, including Hungary, at the time of the study [25, 26].
Measurement tools
ICECAP-A and ICECAP-O The descriptive system of the ICECAP-A instrument covers the following: (1) Attachment (an ability to have love, friendship and support); (2) stability (an ability to feel settled and secure); (3) achievement (an ability to achieve and progress in life); (4) enjoyment (an ability to experience enjoyment and pleasure) and (5) auton- omy (an ability to be independent), while the ICECAP-O items are the following: (1) attachment (love and friendship);
(2) security (thinking about the future without concern); (3) role (doing things that make you feel valued); (4) enjoy- ment (enjoyment and pleasure); and (5) control (independ- ence). A 4-level response scale is applied for each item and respondents are asked to indicate the one that best describes their overall quality of life now. Overall scores range from 0, which represents ‘no capability’ to 1, which represents ‘full capability’. Tariff sets for the instruments were developed using best–worst scaling methods [25, 26], and based on experience utility approach [27], and currently available only for the UK population.
Five Well-Being Index (WHO-5) [28, 29]: The WHO-5 is a self-reported measurement tool to assess mental wellbeing.
It consists of five statements and respondents are asked to rate their status in relation to the past 2 weeks (5 = all of the time, 4 = most of the time, 3 = more than half of the time, 2 = less than half of the time, 1 = some of the time, 0 = at no time). The final score is the sum of the response scores multiplied by four (score range 0–100), where higher score represents better wellbeing.
Satisfaction with Life Scale (SWLS) [30, 31]: The SWLS is a five-item instrument with a 7-point response scale (7-strongly agree, 1-stronly disagree). SWLS score is the sum of the responses and categories have been established based on the score (31–35: Extremely satisfied, 26–30:
Satisfied, 21–25: Slightly satisfied, 20: Neutral, 15–19:
Slightly dissatisfied, 10–14: Dissatisfied, 5–9: Extremely dissatisfied).
Visual analogue scales (VAS) Data on current happi- ness and satisfaction were collected on an 11-point visual analogue scale (VAS, 0 represents no and 10 represents full happiness/satisfaction).
Minimum European Health Module (MEHM) The health status of the respondents was measured by the MEHM [32]. The MEHM consists of three general ques- tions characterizing three different concepts of health: (1) self-perceived health (very good/good/fair/bad/very bad);
(2) long-standing illness and (3) activity limitations due to health problems for more than 6 months measured via the global activity limitation indicator (GALI) (severely limited/limited but not severely or/not limited at all).
EQ-5D-5L HRQoL of the participants was assessed by the paper-based self-completed version of the EQ- 5D-5L questionnaire [33]. The EQ-5D-5L comprises a descriptive system and a health thermometer (EQ VAS).
Respondents are asked to indicate on a 5-level response scale (1 = no problems, 5 = unable/extreme problem) on each of the five domains of the descriptive system (mobil- ity, self-care, usual activities, pain/discomfort, anxiety/
depression) which describes the best their current health.
This health profile can be converted in an EQ-5D-5L index score. We used Hungarian tariffs (value range − 0.848 to 1) to calculate EQ-5D-5L index score [34]. Similarly, current health status is self-assessed on the EQ VAS with anchors 0 (‘worst health status you can imagine’) and 100 (‘best health status you can imagine’).
Statistical analysis
In the first part of the analysis, we compare the measure- ment properties of the ICECAP-A and ICECAP-O instru- ments in terms of discriminatory power, construct validity and convergent validity following the terminology from the COnsensus-based Standards for the selection of health status Measurement INstruments (COSMIN) taxonomy [35]. In the second part of the analysis, we assess agree- ment between the two instruments (including the compari- son of ICECAP-A and ICECAP-O index scores (herein- after ICECAP-A and ICECAP-O scores) and explore the determinants of the differences between the ICECAP-A and ICECAP-O scores.
Discriminatory power
First, we present the distribution of answers to both the ICE- CAP-A and ICECAP-O questionnaire. Second, we compare discriminatory power of the two instruments by calculating Shannon Evenness Index (SEI) [36] for each item of the two measures. The SEI is defined as follows:
SEI= −
∑l
i=1
�pixlnpi�
lnl ,
where l is the number of levels in a domain of the descriptive system (in our case 4), and pi is the proportion of obser- vations in the ith level (i = 1, …, l). SEI ranges between 0 and 1 (1 indicating that all responses are evenly distributed across levels). The higher the SEI, the more the information obtained and the better the discriminatory power.
Third, we explore and compare the share of respondents in full capability [i.e. who marked the top level (level 4)] and in sufficient capability [i.e. those who marked at least the second-best level (level 3) on all five items] [1, 37] accord- ing to the two measures.
Construct validity
We investigate whether both ICECAP-A and ICECAP-O scores can differentiate between the groups hypothesized to differ in their levels of capability. Subgroup comparisons are carried out by one-way ANOVA tests. The following covariates are used for the subgroup comparison: gender (men/women); age group (50–54, 55–59, 60–64, 65–70);
education: (primary, secondary, tertiary); employment sta- tus (working full time/part-time/self-employed, pensioner, disability pensioner, unemployed, other); having a paid job (yes, no); settlement type (capital, other town, village);
marital status (married, partnership, single, widow/widower, divorced, other; married/partnership: yes or no); income quintile based on per capita net monthly household income;
self-perceived health (very good, good, fair, bad, very bad);
GALI activity limitations for more than 6 months (severely limited, limited but not severely, not limited); long-standing illness (yes, no). Based on previous studies [3, 5, 6, 9, 11], we expected positive association with better health, being married/living with a partner, having higher income, being employed/having a paid job, living with others and living outside the capital.Associations between the ICECAP-A and ICECAP-O scores and covariates were also explored by ordinary least square (OLS) regression analysis using the same covariates used in the subgroup analyses (see above).
Convergent validity
To compare convergent validity of the instruments, Pearson’s correlation coefficients were calculated between ICECAP-A and ICECAP-O scores and related measures of HRQoL and wellbeing (EQ-5D-5L index, EQ VAS, happiness, satisfac- tion, WHO-5, SWLS). Correlations are considered strong if the coefficient is over 0.5, moderate between 0.3 and 0.5 and weak under 0.3 [38].
Furthermore, we also assess correlations between the ICE- CAP-A and ICECAP-O items. Pearson’s correlation coeffi- cients are estimated between each domain of the two measures.
We expect strong correlations between certain questionnaire items. Strong correlation is expected between ICECAP-O
Control and ICECAP-A Autonomy domains, as these have the same wording. Furthermore, both questionnaires have Attachment and Enjoyment domains, (however, their item lev- els are formulated differently); thus we can expect that they are strongly correlated and correlations between them are stronger than with other items.
Agreement and comparison of ICECAP‑A and ICECAP‑O scores
Using paired t tests, we assess whether ICECAP-A and ICE- CAP-O scores significantly differ for individuals for the whole sample and in different subgroups of respondents.
To assess agreement among the ICECAP-A and ICECAP-O scores, we calculate intraclass correlation coefficients (ICC) and present the data on a Bland–Altman plot. ICC is calculated using a two-way mixed model of absolute agreement. The ICC can range from 0.00 (no stability/agreement) to 1.00 (perfect agreement). Based on [39], agreement is considered poor for ICC values below 0.5, moderate between 0.50 and 0.75, good between 0.75 and 0.90 and excellent above 0.90. The Bland–Altman plot shows the differences between the ICE- CAP-A and ICECAP-O scores (ICECAP-O minus ICECAP-A on the y-axis) against the averages of the two scores (x-axis).
Horizontal lines show the mean difference, and the limits of agreement, which is the mean difference plus and minus 1.96 times the standard deviation of the differences.
Determinants of the difference between ICECAP‑A and ICECAP‑O scores
We explore one-way associations of the difference of the ICECAP-A and ICECAP-O scores (ICECAP-O minus ICECAP-A) with age, EQ-5D-5L, EQ VAS and with the ICECAP-A and ICECAP-O scores, and graphically illustrate these associations on two-way scatters plots as well.
With logistic regression analysis, we further examine the determinants of falling outside the limits of agreement (i.e.
the difference between ICECAP-O and ICECAP-A score being larger/lower than the mean difference ± 1.96 times the standard deviation of the difference). These are the dots outside the horizontal lines on the Bland–Altman (BA) plot.
Results
The sampleIn the study sample of 2023 respondents, 711 respondents were between the ages of 50 and 70; hence they were asked to fill in both the ICECAP-A and ICECAP-O questionnaires.
Among them, all but two respondents answered all questions on the ICECAP-A instrument, and another two respondents
did not answer all questions on the ICECAP-O, which indi- cate good feasibility of both instruments. Altogether 707 respondents provided full answers to both questionnaires, and this subsample was considered for the analyses. Among them 46.3% were women, and the average age was 60.1 years (SD = 6.0) with 23.5% of the respondents being between 50 and 54 years of age, 22.2% between 55 and 59, 25.0%
between 60 and 64 and 29.6% between 65 and 70. 7.5%
of respondents reported being in very good self-perceived health, while 44.0%, 38.9%, 8.8% and 0.8% reported good, fair, poor and very poor health status, respectively. 43.7%
had long-standing illness, and 3.5% considered themselves severely limited in their activities and 22.9% limited but not severely according to the GALI question. The average EQ- 5D-5L index score of the respondents was 0.91 (SD 0.16), and the average of EQ VAS was 76.8 (SD 17.1).
Comparison of measurement properties Discriminatory power
Table 1 shows the distribution of answers on the ICECAP-A and ICECAP-O items. The modal response for the ICECAP- A items was the second-best level (level 3) for all the items except for Attachment, where the most common answer was the top level (level 4) with 49.6% of the answers. For the ICECAP-O, the modal answer was the second-best level (level 3) across each of the five domains. On the ICECAP- A instrument, little or no capability (level 1 or 2) was most frequently reported on the Achievement domain (22.6%), followed by Stability with 16.5% reporting little or no capa- bility, Autonomy (13%) and Enjoyment (11.7%). The least problematic item was Attachment where only 7.3% of the
Table 1 ICECAP-A, ICECAP-O distribution of responses N = 707
SEI Shannon Evenness Index
ICECAP-A N % ICECAP-O N %
Feeling settled and secure (stability) (SEI = 79.4%) Love and friendship (attachment) (SEI = 66.9%)
I am able to feel settled and secure in all areas of my life 281 39.7 I can have all of the love and friendship that I want 290 41.0 I am able to feel settled and secure in many areas of my
life 309 43.7 I can have a lot of the love and friendship that I want 359 50.8
I am able to feel settled and secure in a few areas of my
life 97 13.7 I can have a little of the love and friendship that I want 56 7.9
I am unable to feel settled and secure in any areas of my
life 20 2.8 I cannot have any of the love and friendship that I want 2 0.3
Love, friendship and support (attachment) (SEI = 66.2%) Thinking about the future (security) (SEI = 81.9%)
I can have a lot of love, friendship and support 351 49.6 I can think about the future without any concern 207 29.3 I can have quite a lot of love, friendship and support 304 43.0 I can think about the future with only a little concern 361 51.1 I can have a little love, friendship and support 49 6.9 I can only think about the future with some concern 103 14.6 I cannot have any love, friendship and support 3 0.4 I can only think about the future with a lot of concern 36 5.1 Being independent (autonomy) (SEI = 73.9%) Doing things that make you feel valued (role)
(SEI = 71.3%)
I am able to be completely independent 294 41.6 I am able to do all of the things that make me feel valued 299 42.3 I am able to be independent in many things 321 45.4 I am able to do many of the things that make me feel
valued 329 46.5
I am able to be independent in a few things 85 12.0 I am able to do a few of the things that make me feel
valued 75 10.6
I am unable to be at all independent 7 1.0 I am unable to do any of the things that make me feel
valued 4 0.6
Achievement and progress (achievement) (SEI = 79.9%) Enjoyment and pleasure (enjoyment) (SEI = 69.2%)
I can achieve and progress in all aspects of my life 207 29.3 I can have all of the enjoyment and pleasure that I want 239 33.8 I can achieve and progress in many aspects of my life 340 48.1 I can have a lot of the enjoyment and pleasure that I want 396 56.0 I can achieve and progress in a few aspects of my life 148 20.9 I can have a little of the enjoyment and pleasure that I
want 64 9.1
I cannot achieve and progress in any aspects of my life 12 1.7 I cannot have any of the enjoyment and pleasure that I
want 8 1.1
Enjoyment and pleasure (enjoyment) (SEI = 72.0%) Independence (control) (SEI = 71.5%)
I can have a lot of enjoyment and pleasure 293 41.4 I am able to be completely independent 287 40.6 I can have quite a lot of enjoyment and pleasure 331 46.8 I am able to be independent in many things 335 47.4 I can have a little enjoyment and pleasure 78 11.0 I am able to be independent in a few things 82 11.6 I cannot have any enjoyment and pleasure 5 0.7 I am unable to be at all independent 3 0.4
respondents reported little or no capability. On the ICECAP- O, respondents were slightly less likely to indicate little or no capability, the prevalence was the highest in the Secu- rity domain (19.7%) and lowest in the Attachment domain (8.2%) (Table 1).
Based on the distribution of answers, Shannon Evenness Indices (SEI) were calculated to compare the discriminatory power of the two instruments (Table 1). For ICECAP-A, SEIs range from 66.2% (Attachment) to 79.9% (Achieve- ment). For ICECAP-O, SEIs range from 66.9% (Attach- ment) to 81.9% (Security). Considering the average of the SEIs for ICECAP-A (74.3%) and ICECAP-O (72.2%), ICE- CAP-A had slightly better discriminatory power than the ICECAP-O.
Finally, regarding ceiling effect, the share of respond- ents in full capability (best level marked on every item) was comparable for the ICECAP-A and ICECAP-O instru- ments (21.2% and 19.9%, respectively). Among them, 113 respondents (16.0%) had full capability on both measures.
The share of respondents in sufficient capability (propor- tion of respondents who indicated at least level 3 on all items) was larger (but not significantly) for the ICECAP-O instrument (67.8% and 71.3%, respectively). As many as 439 respondents (62.1%) had sufficient capability by both measures. Differences in the share of respondents in full and sufficient capability by socio-demographic groups are presented in Electronic Supplementary material Table 1.
Construct validity
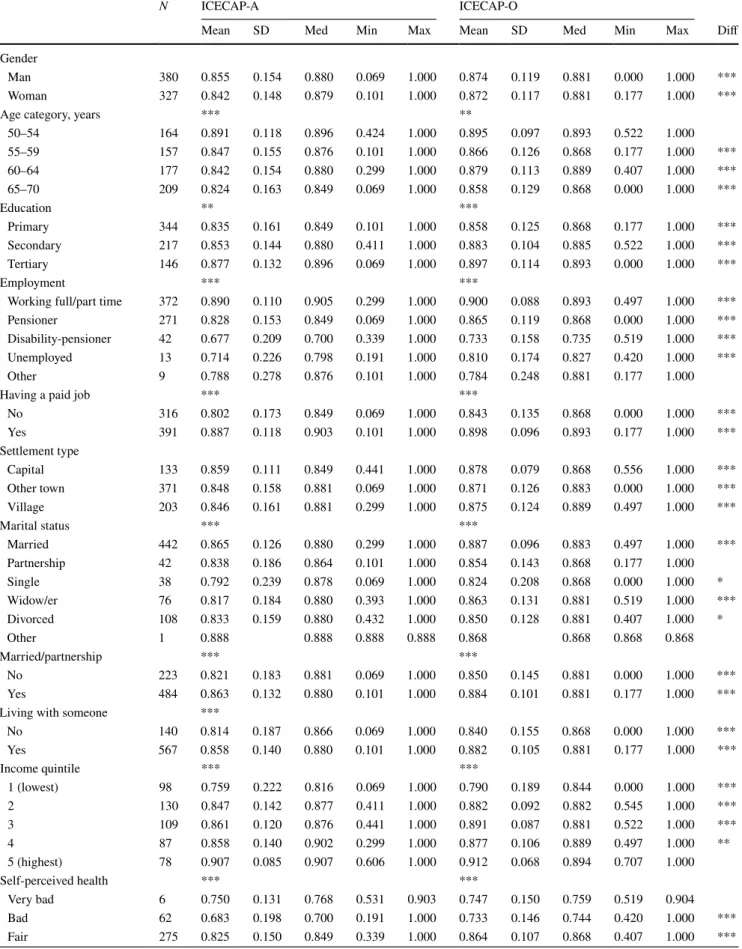
Table 2 presents summary statistics for the ICECAP-A and ICECAP-O scores by socio-demographic characteristics and health status. Both ICECAP-A and ICECAP-O scores sig- nificantly differed by age groups, education, employment, marital status, income quintiles and all the three health measures. There were no significant differences neither in ICECAP-A nor in ICECAP-O scores by gender and settle- ment type. Respondents living with someone had signifi- cantly higher ICECAP-A scores, while there was no signifi- cant difference in their ICECAP-O scores.
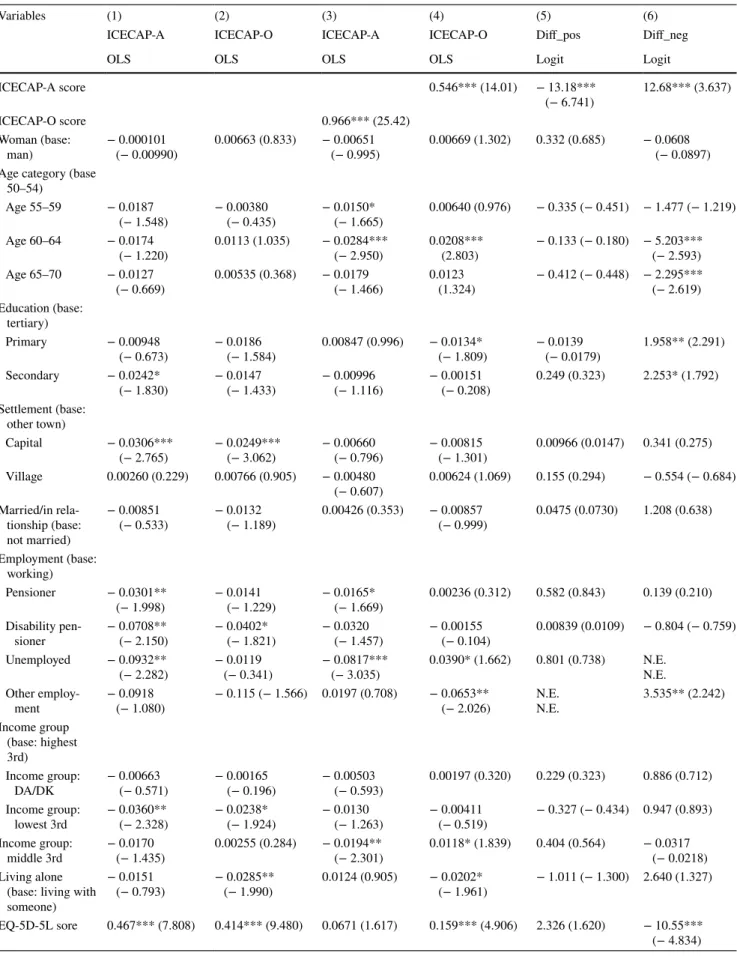
According to the results of the multivariate regression analysis (Table 3, columns 1–2), respondents with higher EQ-5D-5L index (indicating better HRQoL), had signifi- cantly higher ICECAP-A and ICECAP-O scores; however, the marginal effect of the EQ-5D-5L index score was slightly lower in the case of the ICECAP-O instrument (0.467 vs 0.414, respectively). Also, pensioners, disability-pensioners and unemployed had significantly lower ICECAP-A scores, but ICECAP-O scores were only associated with disabil- ity pensioner status. Respondents living in the capital had significantly lower ICECAP-A and ICECAP-O scores com- pared to respondents living in other towns or villages. Also, people in the lowest income third had significantly lower
ICECAP-A and ICECAP-O scores than people in the high- est income third.
Convergent validity
Correlations with other HRQoL and wellbeing measures were comparable across the two instruments (Table 4). Both ICECAP-A and ICECAP-O had the strongest correlation with the EQ-5D-5L index score (0.573 and 0.604), followed by the WHO-5 index (0.566 and 0.557) and the satisfaction with life VAS score (0.517 and 0.537).
We also calculated correlations between ICECAP-A and ICECAP-O questionnaire items. As expected, ICECAP-A enjoyment had the strongest correlations with ICECAP-O enjoyment (r = 0.670) among the ICECAP-O items (and vice versa) (Table 5). Also, ICECAP-A attachment had the strongest correlations with ICECAP-O Attachment (r = 0.609). (However, correlation between ICECAP- O Attachment and ICECAP-O Enjoyment was stronger (r = 0.626) than this.) Also, correlation between ICECAP- A control and ICECAP-A autonomy domains, which have the same wording, was indeed the highest among all pair- wise correlations (r = 0.720). Furthermore, both ICECAP-O security and role items had the strongest correlations with ICECAP-A achievement (r = 0.571 and 0.564, respectively) and stability domains (r = 0.566 and 0.502). ICECAP-A sta- bility had the strongest correlations with ICECAP-O secu- rity (r = 0.566) and enjoyment (r = 0.560), and ICECAP-A achievement had correlation coefficients higher than 0.5 with all the ICECAP-O domains.
Agreement and comparison of ICECAP‑A and ICECAP‑O scores
The mean ICECAP-A and ICECAP-O scores of respondents were 0.85 (SD 0.15) and 0.87 (SD 0.12), respectively. The ICC was estimated at 0.876 (95% CI 0.844–0.900), which indicate good agreement between the two measures. For 368 (52.1%) respondents the ICECAP-O score was higher than the ICECAP-A scores, for 114 (16.1%) they were equal (but 113 of these were 1) and for 225 (31.8%), the ICECAP-O score was lower than the ICECAP-A score. The minimum value of the ICECAP-O score (0) was lower than the mini- mum value of the ICECAP-A score (0.069), while the maxi- mum value was 1 for both instruments.
Paired t test results showed that individuals’ ICECAP- O scores were significantly higher than ICECAP-A scores.
This was the case in most subgroups (Table 2), except in age group 50–54, for respondents with other types of employ- ment (e.g. homemaker), respondents living in civil partner- ship, respondents in the 5th (highest) income quintile, or respondents in very bad health status, where no significant
Table 2 Summary statistics for ICECAP-A and O scores by subgroups
N ICECAP-A ICECAP-O
Mean SD Med Min Max Mean SD Med Min Max Diff
Gender
Man 380 0.855 0.154 0.880 0.069 1.000 0.874 0.119 0.881 0.000 1.000 ***
Woman 327 0.842 0.148 0.879 0.101 1.000 0.872 0.117 0.881 0.177 1.000 ***
Age category, years *** **
50–54 164 0.891 0.118 0.896 0.424 1.000 0.895 0.097 0.893 0.522 1.000
55–59 157 0.847 0.155 0.876 0.101 1.000 0.866 0.126 0.868 0.177 1.000 ***
60–64 177 0.842 0.154 0.880 0.299 1.000 0.879 0.113 0.889 0.407 1.000 ***
65–70 209 0.824 0.163 0.849 0.069 1.000 0.858 0.129 0.868 0.000 1.000 ***
Education ** ***
Primary 344 0.835 0.161 0.849 0.101 1.000 0.858 0.125 0.868 0.177 1.000 ***
Secondary 217 0.853 0.144 0.880 0.411 1.000 0.883 0.104 0.885 0.522 1.000 ***
Tertiary 146 0.877 0.132 0.896 0.069 1.000 0.897 0.114 0.893 0.000 1.000 ***
Employment *** ***
Working full/part time 372 0.890 0.110 0.905 0.299 1.000 0.900 0.088 0.893 0.497 1.000 ***
Pensioner 271 0.828 0.153 0.849 0.069 1.000 0.865 0.119 0.868 0.000 1.000 ***
Disability-pensioner 42 0.677 0.209 0.700 0.339 1.000 0.733 0.158 0.735 0.519 1.000 ***
Unemployed 13 0.714 0.226 0.798 0.191 1.000 0.810 0.174 0.827 0.420 1.000 ***
Other 9 0.788 0.278 0.876 0.101 1.000 0.784 0.248 0.881 0.177 1.000
Having a paid job *** ***
No 316 0.802 0.173 0.849 0.069 1.000 0.843 0.135 0.868 0.000 1.000 ***
Yes 391 0.887 0.118 0.903 0.101 1.000 0.898 0.096 0.893 0.177 1.000 ***
Settlement type
Capital 133 0.859 0.111 0.849 0.441 1.000 0.878 0.079 0.868 0.556 1.000 ***
Other town 371 0.848 0.158 0.881 0.069 1.000 0.871 0.126 0.883 0.000 1.000 ***
Village 203 0.846 0.161 0.881 0.299 1.000 0.875 0.124 0.889 0.497 1.000 ***
Marital status *** ***
Married 442 0.865 0.126 0.880 0.299 1.000 0.887 0.096 0.883 0.497 1.000 ***
Partnership 42 0.838 0.186 0.864 0.101 1.000 0.854 0.143 0.868 0.177 1.000
Single 38 0.792 0.239 0.878 0.069 1.000 0.824 0.208 0.868 0.000 1.000 *
Widow/er 76 0.817 0.184 0.880 0.393 1.000 0.863 0.131 0.881 0.519 1.000 ***
Divorced 108 0.833 0.159 0.880 0.432 1.000 0.850 0.128 0.881 0.407 1.000 *
Other 1 0.888 0.888 0.888 0.888 0.868 0.868 0.868 0.868
Married/partnership *** ***
No 223 0.821 0.183 0.881 0.069 1.000 0.850 0.145 0.881 0.000 1.000 ***
Yes 484 0.863 0.132 0.880 0.101 1.000 0.884 0.101 0.881 0.177 1.000 ***
Living with someone ***
No 140 0.814 0.187 0.866 0.069 1.000 0.840 0.155 0.868 0.000 1.000 ***
Yes 567 0.858 0.140 0.880 0.101 1.000 0.882 0.105 0.881 0.177 1.000 ***
Income quintile *** ***
1 (lowest) 98 0.759 0.222 0.816 0.069 1.000 0.790 0.189 0.844 0.000 1.000 ***
2 130 0.847 0.142 0.877 0.411 1.000 0.882 0.092 0.882 0.545 1.000 ***
3 109 0.861 0.120 0.876 0.441 1.000 0.891 0.087 0.881 0.522 1.000 ***
4 87 0.858 0.140 0.902 0.299 1.000 0.877 0.106 0.889 0.497 1.000 **
5 (highest) 78 0.907 0.085 0.907 0.606 1.000 0.912 0.068 0.894 0.707 1.000
Self-perceived health *** ***
Very bad 6 0.750 0.131 0.768 0.531 0.903 0.747 0.150 0.759 0.519 0.904
Bad 62 0.683 0.198 0.700 0.191 1.000 0.733 0.146 0.744 0.420 1.000 ***
Fair 275 0.825 0.150 0.849 0.339 1.000 0.864 0.107 0.868 0.407 1.000 ***
differences were found between individuals’ ICECAP-A and ICECAP-O scores.
Determinants of the difference between ICECAP‑A and ICECAP‑O index scores
The distribution of the difference between ICECAP-A and ICECAP-O scores (ICECAP-O minus ICECAP-A) with the mean of 0.024 and standard deviation of 0.088) is pre- sented in a histogram (Electronic Supplementary Material Figs. 1 and 2). The BA plot (Electronic Supplementary Material Fig. 3) shows the difference of ICECAP-A and ICECAP-O scores as a function of the average of two scores. Altogether the difference fell outside the limits of agreement in 48 cases (37 on the positive side, and 11 on the negative side). The graph indicates that the difference decreases with the increase of the mean score. Positive dif- ferences for lower scores indicate that for lower capability ICECAP-O scores are generally higher than the ICECAP-A scores.
Two-way scatters (Electronic Supplementary Material Fig. 4) show that the difference significantly decreases with the increase of both ICECAP-A and ICECAP-O scores; how- ever, the difference has a stronger association with the ICE- CAP-A score. Furthermore, the difference slightly increases with age and decreases with the increase of the EQ-5D-5L index and EQ VAS scores.
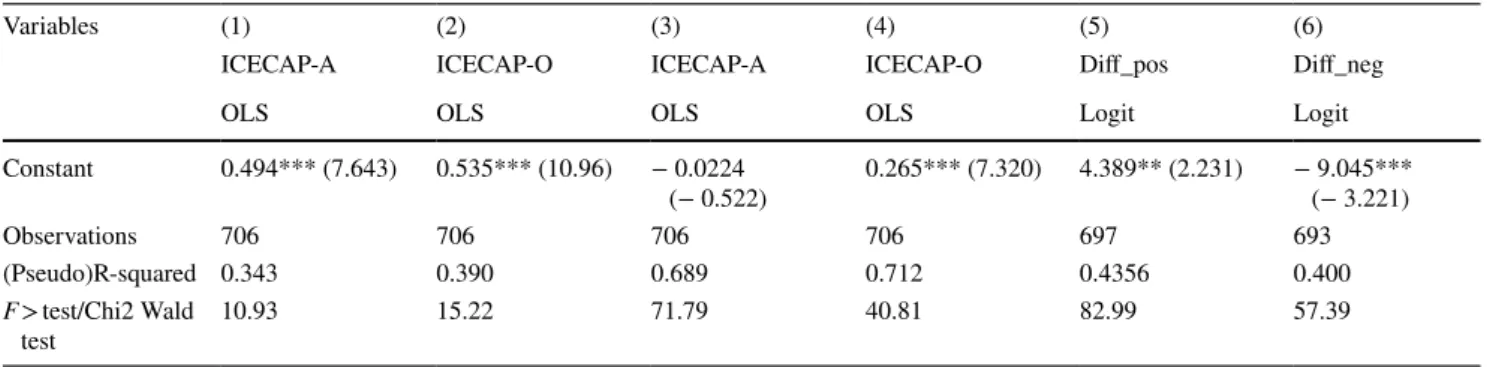
Multivariate regression models 3 and 4 (Table 3) indi- cate that ICECAP-A and ICECAP-O scores can be cal- culated from each other with good confidence. In model 3 (column 3), the ICECAP-A score increased with the increase of ICECAP-O score (marginal effects were 0.966). On the other hand, it was significantly lower if the respondent was between 55 and 64 years old, a pensioner,
unemployed, from the middle income third. In model 4 (column 4), the constant indicates that ICECAP-O scores are systematically higher than ICECAP-A scores by an average 0.265. ICECAP-O score significantly increased with the increase of the ICECAP-A and the EQ-5D-5L scores (marginal effects were 0.546 and 0.159, respec- tively). Furthermore, it was significantly higher than the ICECAP-A if the respondent was unemployed or from the middle income third, but lower if the respondent had pri- mary education, lived alone or had other type of employ- ment status (like homemaker). In the age group 60–64, ICECAP-A was significantly lower than the ICECAP-O score by 0.02. Rather high R2 of the two models (0.69 and 0.71) indicate that covariates explain most of the variance in the measures in both cases.
Logistic regression results on the difference being larger/lower than the mean difference ± 1.96 times the standard deviation are presented in Table 3, columns 5 and 6. Results indicate that if someone has higher ICECAP-A score (better capability), it is less likely that the ICECAP-O score is meaningfully higher than the ICECAP-A score, but at the same time it is more likely that the ICECAP-A score is meaningfully higher than the ICECAP-O score. Furthermore, if someone is in a better HRQoL (EQ-5D-5L) it is significantly less likely that ICECAP-A scores are higher than ICECAP-O scores. People between the ages of 60 and 70 and with respondents with tertiary education were less likely to have meaningfully higher ICECAP-A scores than ICE- CAP-O scores.
Means were compared by one-way ANOVA tests; ICECAP-A and O scores were compared using paired t test GALI global activity limitations indicator
*p < 0.1; **p < 0.05; ***p < 0.01 Table 2 (continued)
N ICECAP-A ICECAP-O
Mean SD Med Min Max Mean SD Med Min Max Diff
Good 311 0.887 0.117 0.898 0.069 1.000 0.901 0.101 0.893 0.000 1.000 ***
Very good 53 0.958 0.067 1.000 0.709 1.000 0.937 0.074 0.975 0.676 1.000 **
Activity limitation (GALI) *** ***
Severely 25 0.617 0.218 0.616 0.069 0.946 0.669 0.205 0.700 0.000 0.927 *
Not severely 162 0.756 0.176 0.805 0.299 1.000 0.802 0.129 0.845 0.507 1.000 ***
Not limited 520 0.890 0.111 0.907 0.101 1.000 0.905 0.084 0.893 0.177 1.000 ***
Long-standing illness *** ***
No 398 0.894 0.115 0.912 0.101 1.000 0.908 0.089 0.894 0.177 1.000 ***
Yes 309 0.791 0.171 0.849 0.069 1.000 0.829 0.135 0.868 0.000 1.000 ***
Total 707 0.849 0.151 0.880 0.069 1.000 0.873 0.118 0.881 0.000 1.000 ***
Table 3 Results of the OLS and logistic regression analysis
Variables (1) (2) (3) (4) (5) (6)
ICECAP-A ICECAP-O ICECAP-A ICECAP-O Diff_pos Diff_neg
OLS OLS OLS OLS Logit Logit
ICECAP-A score 0.546*** (14.01) − 13.18***
(− 6.741) 12.68*** (3.637)
ICECAP-O score 0.966*** (25.42)
Woman (base:
man) − 0.000101
(− 0.00990) 0.00663 (0.833) − 0.00651
(− 0.995) 0.00669 (1.302) 0.332 (0.685) − 0.0608 (− 0.0897) Age category (base
50–54)
Age 55–59 − 0.0187
(− 1.548) − 0.00380
(− 0.435) − 0.0150*
(− 1.665) 0.00640 (0.976) − 0.335 (− 0.451) − 1.477 (− 1.219) Age 60–64 − 0.0174
(− 1.220) 0.0113 (1.035) − 0.0284***
(− 2.950) 0.0208***
(2.803) − 0.133 (− 0.180) − 5.203***
(− 2.593) Age 65–70 − 0.0127
(− 0.669) 0.00535 (0.368) − 0.0179
(− 1.466) 0.0123
(1.324) − 0.412 (− 0.448) − 2.295***
(− 2.619) Education (base:
tertiary)
Primary − 0.00948
(− 0.673) − 0.0186
(− 1.584) 0.00847 (0.996) − 0.0134*
(− 1.809) − 0.0139
(− 0.0179) 1.958** (2.291) Secondary − 0.0242*
(− 1.830) − 0.0147
(− 1.433) − 0.00996
(− 1.116) − 0.00151
(− 0.208) 0.249 (0.323) 2.253* (1.792) Settlement (base:
other town)
Capital − 0.0306***
(− 2.765) − 0.0249***
(− 3.062) − 0.00660
(− 0.796) − 0.00815
(− 1.301) 0.00966 (0.0147) 0.341 (0.275) Village 0.00260 (0.229) 0.00766 (0.905) − 0.00480
(− 0.607) 0.00624 (1.069) 0.155 (0.294) − 0.554 (− 0.684) Married/in rela-
tionship (base:
not married)
− 0.00851
(− 0.533) − 0.0132
(− 1.189) 0.00426 (0.353) − 0.00857
(− 0.999) 0.0475 (0.0730) 1.208 (0.638) Employment (base:
working)
Pensioner − 0.0301**
(− 1.998) − 0.0141
(− 1.229) − 0.0165*
(− 1.669) 0.00236 (0.312) 0.582 (0.843) 0.139 (0.210) Disability pen-
sioner − 0.0708**
(− 2.150) − 0.0402*
(− 1.821) − 0.0320
(− 1.457) − 0.00155
(− 0.104) 0.00839 (0.0109) − 0.804 (− 0.759) Unemployed − 0.0932**
(− 2.282) − 0.0119
(− 0.341) − 0.0817***
(− 3.035) 0.0390* (1.662) 0.801 (0.738) N.E.
N.E.
Other employ-
ment − 0.0918
(− 1.080) − 0.115 (− 1.566) 0.0197 (0.708) − 0.0653**
(− 2.026) N.E.
N.E. 3.535** (2.242)
Income group (base: highest 3rd)
Income group:
DA/DK − 0.00663
(− 0.571) − 0.00165
(− 0.196) − 0.00503
(− 0.593) 0.00197 (0.320) 0.229 (0.323) 0.886 (0.712) Income group:
lowest 3rd − 0.0360**
(− 2.328) − 0.0238*
(− 1.924) − 0.0130
(− 1.263) − 0.00411
(− 0.519) − 0.327 (− 0.434) 0.947 (0.893) Income group:
middle 3rd − 0.0170
(− 1.435) 0.00255 (0.284) − 0.0194**
(− 2.301) 0.0118* (1.839) 0.404 (0.564) − 0.0317 (− 0.0218) Living alone
(base: living with someone)
− 0.0151
(− 0.793) − 0.0285**
(− 1.990) 0.0124 (0.905) − 0.0202*
(− 1.961) − 1.011 (− 1.300) 2.640 (1.327) EQ-5D-5L sore 0.467*** (7.808) 0.414*** (9.480) 0.0671 (1.617) 0.159*** (4.906) 2.326 (1.620) − 10.55***
(− 4.834)
Discussion
This is the first study to compare measurement properties of the ICECAP-A and ICECAP-O instruments among the middle-aged/elderly population. Our findings confirmed that both instruments are valid measurement tools among the general population aged 50–70 years. In summary, the
ICECAP-O scores were systematically higher than the ICECAP-A scores. The difference was driven mostly by respondents’ health status (EQ-5D-5L) and employment status rather than age. ICECAP-A and ICECAP-O scores could be calculated from each other with a good confi- dence (R2 = 0.69 and 0.71), especially when the health state and employment status of respondents are available.
We found several similarities between the two instru- ments. The measures showed similar construct and conver- gent validity (i.e. ICECAP-A and ICECAP-O scores differ- entiate between the same subgroup of respondents). Also, correlation with other HRQoL and wellbeing measures indi- cated similar convergent validity of the two instruments. We also found similar ceiling effects, as the share of respondents in full capability was comparable according to the two meas- ures (21.2% and 19.9%). Overall, the agreement between ICECAP-A and ICECAP-O scores was good (ICC = 0.876) between the two measures.
Furthermore, strong correlations found between ICE- CAP-A and ICECAP-O items indicate similar concepts behind the questionnaire items. As expected, the ICE- CAP-A attachment, stability, enjoyment and autonomy items had the strongest correlation with the ICECAP-O attachment, security, enjoyment and control items, respec- tively. Nevertheless, we can also find some interesting
Diff_pos = 1 if (difference) > Mean (difference) + 1.96*SD(difference) where difference is the difference between the ICECAP-O and the ICE- CAP-A score. Diff_neg = 1 if (difference) > Mean (difference) − 1.96*SD(difference) where difference is the difference between the ICECAP-O and the ICECAP-A score
DA/DK do not answer, do not know, N.E. not estimated
*p < 0.1; **p < 0.05; ***p < 0.01 Table 3 (continued)
Variables (1) (2) (3) (4) (5) (6)
ICECAP-A ICECAP-O ICECAP-A ICECAP-O Diff_pos Diff_neg
OLS OLS OLS OLS Logit Logit
Constant 0.494*** (7.643) 0.535*** (10.96) − 0.0224
(− 0.522) 0.265*** (7.320) 4.389** (2.231) − 9.045***
(− 3.221)
Observations 706 706 706 706 697 693
(Pseudo)R-squared 0.343 0.390 0.689 0.712 0.4356 0.400
F > test/Chi2 Wald
test 10.93 15.22 71.79 40.81 82.99 57.39
Table 4 Pearson’s correlations between ICECAP-A and ICECAP-O scores with EQ-5D-5L, EQ VAS, WHO-5 and SWLS scores
For all correlations p = 0.000
Mean SD Correla- tion with ICECAP-A
Correlation with ICECAP- O
ICECAP-A 0.849 0.151 1.000 0.815
ICECAP-O 0.873 0.118 0.815 1.000
EQ-5D-5L 0.899 0.150 0.547 0.588
EQ VAS (0–100) 76.81 17.14 0.475 0.462 Happiness VAS
(0–10) 7.376 1.983 0.477 0.491
Satisfaction VAS
(0–10) 7.317 2.105 0.517 0.537
WHO-5 (0–100) 70.65 18.17 0.566 0.557
SWLS (5–35) 24.40 6.51 0.454 0.474
Table 5 Pearson’s correlations between ICECAP-A and ICECAP-O items
For all correlations p = 0.0000
ICECAP-O/ICECAP-A Attachment Stability Achievement Enjoyment Autonomy ICECAP-A
Attachment 0.609 0.495 0.555 0.626 0.425 0.655
Security 0.439 0.566 0.571 0.513 0.423 0.624
Role 0.450 0.502 0.564 0.495 0.495 0.604
Enjoyment 0.516 0.560 0.638 0.670 0.483 0.695
Control 0.414 0.502 0.576 0.510 0.721 0.656
ICECAP-O 0.567 0.612 0.656 0.649 0.586 0.815
controversies as well. For example, ICECAP-O security had slightly stronger correlation with ICECAP-A achieve- ment than with ICECAP-A stability. ICECAP-O security item covers concerns about the future, while ICECAP-A stability reflects security in the present, and future worries are not covered by any of the ICECAP-A items. Therefore, it makes sense that concerns about the future are better projected by current achievements and progress than by security in the present. Furthermore, ICECAP-A achieve- ment correlated stronger with ICECAP-O enjoyment, con- trol and security than with ICECAP-O role. This finding suggests that achievement and progress might result in less concerns about the future, and more feelings of inde- pendence, enjoyment and pleasure in the present. Also, it implies that possibly achievement and progress are not the things that make people feel valued.
Our analysis pointed out some further differences between the two instruments. Overall, (at least on this sub- sample of adults between the age of 50 and 70) ICECAP-A seems to be a slightly more sensitive measure in terms of discriminatory power than the ICECAP-O. Also, the share of respondents in sufficient capability was slightly higher according to the ICECAP-O instrument.
Regarding ICECAP scores, average ICECAP-O scores were systematically higher than ICECAP-A scores in most of the subgroups. This can be partly explained by the dif- ference in tariff values between the ICECAP-O and the ICECAP-A (tariffs of ICECAP-O being higher than of the ICECAP-A for most domains and levels) (Electronic Supplementary Material Table 2). Difference between the ICECAP-O and ICECAP-A scores increased with the decrease of capability, HRQoL and with age. Multivari- ate regression results also indicated that employment and health status had slightly larger marginal effect on the ICECAP-A score than on the ICECAP-O score. Pension- ers, and unemployed had significantly lower ICECAP-A scores, but these seemed not to be associated with the ICECAP-O scores. These results are not unexpected, given that ICECAP-O is specifically designed to consider preferences and values of elderly respondents, and it is likely that employment status is relatively less important for elderly, while worse health state might be more accept- able in older ages [40–42].
Findings related to the age of respondents require spe- cial attention as the difference between the two measures is defined by the age of their target population. Our analy- sis pointed out that ICECAP scores were more sensitive to health and employment status than to age. Difference between ICECAP-O and ICECAP-A was significant above the age of 55, but not between 50 and 54. This means that people over 55 tended to have higher ICECAP-O scores than ICECAP-A scores (however, this is true to
most subgroups), and it seems that the difference slightly increased with age.
Implications of our findings
Our results have some implications on the potential use of the ICECAP instruments in economic evaluations as well.
As opposed to ICECAP-O, ICECAP-A has been devel- oped for the use among the entire adult population and thus a preferred option for use in economic evaluation [8].
Our results imply that in economic evaluations, when two health states are compared, using ICECAP-A might result in a larger difference in scores than the ICECAP-O. This indicates that ICECAP-A might magnify the benefit of health care interventions in terms of improvement in capa- bility wellbeing compared to the scenario when ICECAP- O is applied. On the other hand, using ICECAP-O may potentially underestimate gains in capability wellbeing, especially among the working (working age) population where health status can affect people’s ability to work as well. None of the two instruments contain health as a sepa- rate conceptual attribute. However, health improves the capability to achieve desired functions such as meaning- ful relationships (ICECAP-A and ICECAP-O attachment), enjoyment of life (enjoyment), independence (ICECAP- A autonomy and ICECAP-O control) [10]. Also, health strongly affects the ability to work among the working population, and working itself results in higher ICECAP-A scores, most probably because it gives people the feelings of progress and achievement (ICECAP-A achievement).
Our findings may also help to provide guidance on the selection of the instruments in further research stud- ies. Our results show that employment status is a crucial factor in driving the difference between ICECAP-A and ICECAP-O scores. In most cases, employment status is determined largely by age, thus using age as a simple cut- off for switching between the measures seems appropriate.
Nevertheless, in some cases, it is the employment status of the target population, rather than the age, which could bet- ter drive the choice between the instruments in age groups around the retirement age. For example, ICECAP-A could be a preferred option to be used among people—even in older ages—if they are still active in the labor market (or only temporarily absent from work), as it better reflects losses in wellbeing due to their decreased ability to work.
On the other hand, in inactive population groups (e.g. dis- ability pensionaries), the ICECAP-O could be considered even in ages under 65. Given the potential increases in the retirement age in the future, recommending the use of ICECAP-O above the retirement age (rather than above a specific age cut-off of 65 years), as a rule of thumb, seems to be a potential simple solution to consider to strengthen the validity of the instrument in the long term.
Limitations
Some limitations of our study should be mentioned. The age of the studied population is limited to age 50–70; how- ever, investigation could be extended to higher ages as well, especially in countries where retirement age and the life expectancy is substantially higher than in Hungary. Due to the cross-sectional nature of the study, we could not assess and compare the responsiveness of the ICECAP instruments to changes in this age group, and we cannot examine any causality issues either. Furthermore, our study has been car- ried out among the general population, so it is possible that studies focusing on specific patient populations would lead to different findings.
Conclusion
Our results confirmed the validity of both the ICECAP-A and ICECAP-O measures in the 50–70 age group and the two measures show good agreement with each other. In gen- eral, ICECAP-O results in higher scores than ICECAP-A in the 50–70 age group, and the difference increases with the decline of capability, health status and age. The employ- ment status has larger impact on ICECAP-A scores than on ICECAP-O scores. Also, the difference between the two measures is determined mostly by health status (EQ-5D-5L) and employment status rather than age. Our research results are suggested to be considered for the choice of measures and design of capability wellbeing studies. Further research should investigate whether the choice of instruments (for a population around the retirement age) should also be linked to the respondent’s employment status.
Supplementary Information The online version contains supplemen- tary material available at https:// doi. org/ 10. 1007/ s10198- 021- 01325-w.
Acknowledgements The authors express their thanks to Dr. Philip Kinghorn (University of Birmingham) for his help provided through- out the development process of the Hungarian language version of the ICECAP-A and ICECAP-O instruments, and to Dr. Valentin Brodszky and Dr. Fanni Rencz (Corvinus University of Budapest), participants of the ‘Financial and Public Services’ research project.
Author contributions All authors contributed to the study conception and design. Material preparation, data collection and analysis were performed PB, MF, ÁD, ZZ, LK, LG and MP. The first draft of the manuscript was written by PB and MP and all authors commented on previous versions of the manuscript. All authors read and approved the final manuscript.
Funding Open access funding provided by Corvinus University of Budapest. This research was supported by the Higher Education Insti- tutional Excellence Program of the Ministry of Human Capacities in
the framework of the ‘Financial and Public Services’ research project (20764-3/2018/FEKUTSTRAT) at Corvinus University of Budapest.
Availability of data The data that support the findings of this study are available from the corresponding author upon reasonable request.
Declarations
Conflict of interest In connection with writing this article, Petra Baji, and Márta Péntek received grant support from the Higher Education Institutional Excellence Program of the Ministry for Innovation and Technology in the framework of the ‘Financial and Public Services’ re- search project (NKFIH-1163-10/2019 and NKFIH-2020) at Corvinus University of Budapest. Miklós Farkas received Grant support from the Higher Education Institutional Excellence Program of the Ministry for Innovation and Technology in the framework of the ‘Financial and Public Services’ research project (NKFIH-2020) at Corvinus Univer- sity of Budapest. Ágota Dobos received grant support from the Higher Education Institutional Excellence Program of the Ministry for Inno- vation and Technology in the framework of the ‘Financial and Public Services’ research project (NKFIH-1163-10/2019) at Corvinus Uni- versity of Budapest. The work of Márta Péntek and László Gulácsi was supported by Project no. 2019-1.3.1-KK-2019-00007 that has been implemented with the support provided from the National Research, Development and Innovation Fund of Hungary, financed under the 2019-1.3.1-KK funding scheme. In connection with this project, Zrub- ka Zsombor has received funding from the European Research Council (ERC) under the European Union’s Horizon 2020 research and innova- tion programme (Grant agreement no 679681). Márta Péntek is mem- ber of the EuroQol Group, a not-for-profit organisation that develops and distributes instruments that assess and value health. Other authors declare that they have no conflict of interest.
Ethics approval All procedures performed in studies involving human participants were in accordance with the ethical standards of the national research committee (Hungarian Medical Research Council;
approval Nr. 10058-3/2019/EKU) and with the 1964 Helsinki declara- tion and its later amendments or comparable ethical standards.
Informed consent Informed consent was obtained from all individual participants included in the study.
Open Access This article is licensed under a Creative Commons Attri- bution 4.0 International License, which permits use, sharing, adapta- tion, distribution and reproduction in any medium or format, as long as you give appropriate credit to the original author(s) and the source, provide a link to the Creative Commons licence, and indicate if changes were made. The images or other third party material in this article are included in the article’s Creative Commons licence, unless indicated otherwise in a credit line to the material. If material is not included in the article’s Creative Commons licence and your intended use is not permitted by statutory regulation or exceeds the permitted use, you will need to obtain permission directly from the copyright holder. To view a copy of this licence, visit http:// creat iveco mmons. org/ licen ses/ by/4. 0/.
References
1. Mitchell, P.M., Roberts, T.E., Barton, P.M., Coast, J.J.: Assessing sufficient capability: a new approach to economic evaluation. Soc.
Sci. Med. 139, 71–79 (2015)