-
Contents lists available atsciencedirect.com Journal homepage:www.elsevier.com/locate/jvalPreference-Based Assessments
Development of Population Tariffs for the ICECAP-A Instrument for Hungary and their Comparison With the UK Tariffs
Miklós Farkas, PhD, Elisabeth Huynh, PhD, László Gulácsi, DSc, Zsombor Zrubka, PhD, Ágota Dobos, PhD, Levente Kovács, PhD, Petra Baji, PhD,*Márta Péntek, PhD*
A B S T R A C T
Objectives:The ICEpop CAPability measure for Adults (ICECAP-A) was developed to assess the capability well-being of adults for use in economic evaluations. Currently, ICECAP-A tariffs are available only for the UK population. The objectives of this study were to develop a Hungarian tariff set for the ICECAP-A instrument and to explore intercountry differences between the Hungarian and the UK value sets.
Methods:A survey was conducted by computer-assisted personal interviews on a sample representative of the Hungarian adult population (N = 1000) to elicit their preferences regarding ICECAP-A attributes with the use of a best-worst scaling choice task. A latent class multinomial logit model with continuous variance scale was used to estimate the weights for each of the 4 capability levels of all 5 ICECAP-A attributes, namely, attachment, stability, achievement, enjoyment, and autonomy.
Results:The model identified 2 preference classes with approximately equal share. Thefirst class had a stronger relative preference for autonomy and achievement, whereas the second class had a strong preference for attachment. Multivariate analysis of the classes revealed that women, pensioners, people who are married or living in a partnership, and people with poorer health status are characteristics associated with the latter class membership (preference for attachment). Population tariffs were estimated from the model. Overall, attachment was found to be the most important attribute, followed by stability, enjoyment, achievement, and autonomy.
Conclusions:Hungarian tariffs are largely consistent with those found for the United Kingdom; nevertheless, autonomy seems to be less important in Hungary compared with the United Kingdom.
Keywords:best-worst scaling, EQ-5D-5L, Hungary, ICEpop CAPability measure for Adults, population tariffs, preferences, value set.
VALUE HEALTH. 2021;-(-):-–-
Introduction
In economic evaluations, there is an increasing need to consider well-being effects of interventions beyond health, which better reflect the value infields such as social care, mental health, or end-of-life care.1 The ICEpop CAPability measure for Adults (ICECAP-A) instrument was developed to be used in economic evaluations among the general adult population (18 years and older)2to capture aspects of well-being beyond health and health- related quality of life (QOL). The measure is based on Amartya Sen’s capability approach, which defines well-being in terms of an individual’s ability and capability to“do”certain things that are important in life. The descriptive system of the instrument was developed using qualitative methods.2 It covers 5 attributes of well-being that were found to be important to the general adult population in the United Kingdom: (1) attachment (an ability to
have love, friendship, and support), (2) stability (an ability to feel settled and secure), (3) achievement (an ability to achieve and progress in life), (4) enjoyment (an ability to experience enjoy- ment and pleasure), and (5) autonomy (an ability to be indepen- dent). Each question can be answered on a 4-level scale (from no capability [level 1] to full capability [level 4]). A well-being score (ranging from 0, which represents “no capability,” to 1, which represents“full capability”) can be attached to each well-being state described by the combination of attribute levels using weights for each of the 4 levels of all 5 attributes. The set of weights, also called tariffs, reflect population preferences for or experience with certain well-being states.
In economic evaluations, the ICECAP-A measure can be combined with time to generate years of full capability (YFCs), which represent the total amount of capability that is available over time.3Cost-effectiveness ratio can be calculated to show the
*Petra Baji and Márta Péntek contributed equally to this work.
1098-3015 - see front matter Copyrightª2021, ISPOR–The Professional Society for Health Economics and Outcomes Research. Published by Elsevier Inc. This is an open access article under the CC BY-NC-ND license (http://creativecommons.org/licenses/by-nc-nd/4.0/).
incremental cost of producing an additional YFC. Nevertheless, it should be highlighted that YFC is not equivalent to a quality- adjusted life-year (QALY) outcome because QALYs are anchored on a perfect health–dead scale (1-0), whereas capability is valued in relation to full capability (1) and no capability (0). Furthermore, a new approach of sufficient capability is also being investigated for use in economic evaluation.4As opposed to traditional welfare economics approaches, this concept promotes the maximization of years of sufficient capability instead of maximizing YFCs.
The interest for capability measures in economic evaluations has been increasing in the recent years,1,5 given that these are designed to estimate well-being effects that extend beyond health.
Regulatory bodies such as the National Institute for Health and Care Excellence and the Social Care Institute for Excellence in the United Kingdom and Zorginstituut in The Netherlands encourage the use of ICECAP instruments for measuring the impact of social care or long-term care interventions.1Recent systematic literature reviews by Helter et al5 and Proud et al1 identified 14 studies in which the ICECAP-A or the ICECAP-O measures were applied in economic evaluations. These studies mostly focused on in- terventions relating to care in a community setting, self-care, mental healthcare, and/or integrated services for those with chronic and long-term conditions.
So far, tariff sets for the ICECAP-A instrument have been developed and are available only for the UK population,3,6 the former based on decision utility and the latter on experience utility. Nevertheless, it is plausible that societal preferences for capability would differ in countries owing to differences in eco- nomic development and social and cultural backgrounds.3Cross- country differences have been shown to exist with other preference-based QOL measures such as the EQ-5D health-related QOL measure7or the CarerQol-7D measure of care-related QOL of informal caregivers.8,9
This study aimed to construct population average tariffs for the ICECAP-A instrument in Hungary, accounting for possible het- erogeneity in preferences for well-being (via latent class analysis).
Second, we aimed to compare Hungarian and UK tariffs. To ensure comparability offindings, we used the same best-worst scaling method with the same design and analytical techniques that were successfully applied previously to develop thefirst UK decision utility value set.3
Methods
The Survey
The survey was conducted by computer-assisted personal in- terviews on a sample representative for the Hungarian adult population. The target sample size was set to 1000 respondents.
Previous studies suggested that a sample of 400 complete re- sponses would be sufficient to estimate a set of index values for the measure that could be used for the population and could enable some investigation of preference and scale heterogene- ity.3,10 The recruitment of the respondents and the interviews were performed by a survey company. Quotas were used to obtain a representative sample in terms of age, sex, and education. The interviews took place between May and June 2019.
The survey was administered by interviewers using a computer-assisted survey platform. Two principal interviewers of the survey company received specific training on the content, purpose, and technique of the survey. They were then responsible for instructing the other interviewers. The survey was piloted in April 2019 in a convenience sample of 4 individuals with different backgrounds. The 2 principal interviewers conducted computer- assisted interviews that were followed via video streaming by 2
researchers (MP, ZZ). After that, researchers provided feedback on the interview, and questions raised by interviewers were dis- cussed and clarified. The pilot testing suggested that the exercise was apprehensible for respondents; thus, no change was made to the survey.
Ethical approval was obtained from the Hungarian Medical Research Council (Nr. 10054-2/2019/EKU). Respondents were informed that the participation in the survey was completely voluntary and their data would remain anonymous and would not be linked to personal information, such as their name or address, and would be used solely for scientific purposes. Respondents needed to provide their informed consent at the start of the survey.
The Questionnaire
The study was the part of a survey“The valuation of well-being states–survey among the general population,”which consisted of 3 main parts: (1) a valuation exercise of well-being states using best-worst scaling (to develop the population tariffs for the ICECAP-A instrument), (2) a willingness-to-pay exercise, and (3) questions on sociodemographic and health status. In this study, we focused only on the best-worst scaling exercise. For reasons of comparability, we adopted the same study design used to obtain the UK value set3; see more on the development of the design below. The translations of the ICECAP-A attributes and their levels into Hungarian were based on the Hungarian version of the ICECAP-A questionnaire,11 which was developed and validated according to current guidance on the topic12using independent forward-backward translations involving native in-country in- vestigators and professional translating agencies. After completing the best-worst scaling exercise, respondents were asked to indi- cate on a 7-point response scale (endpoints, I fully agree, I do not agree at all; midpoint, I neither agree nor disagree) how much they agreed with the statement“It was difficult to answer the best-worst scaling exercise”and also the reasons for experiencing difficulties, if any. Following this, the survey questionnaire included the paper-based self-completed validated Hungarian version of the ICECAP-A questionnaire11 and questions on the sociodemographics and health status of respondents. The health status measures included self-perceived health of respondents (very good/good/fair/bad/very bad) and the online self-completed version of the EQ-5D-5L questionnaire.13 We used Hungarian tariffs (value range 20.848 to 1) to calculate EQ-5D-5L index score.7 The final version of the questionnaire was pilot tested before the main study was performed.
The Best-Worst Scaling Exercise
In the best-worst scaling exercise, respondents were presented with a set of 16 hypothetical scenarios. In each scenario, a well- being profile described by the 5 attributes was shown to the re- spondents, with levels varying across scenarios (see Appendix Table 1 in Supplemental Materials found athttps://doi.org/10.1 016/j.jval.2021.06.011). From each profile, respondents were asked to choose an attribute they consider the best and the worst within the profile. How much each attribute level is valued is directly associated with the attribute-level choice frequencies.14,15 The experimental design developed in the United Kingdom3 was used in this study. This design is based on an orthogonal main effects plan (OMEP) of 16 states where all attributes are statistically independent. This enables independent estimation of the values that people associate with each level of every attribute, assuming no interactions between them.3To increase the number of scenarios relative to the number of parameters being estimated, the“foldover”or mirror image of the OMEP design was used for
half of the sample. Respondents were randomly allocated to either the original OMEP or the foldover. The OMEP design was obtained from an online catalog; further details are available in the study by Flynn et al.3
Statistical Analysis
Choice frequencies of all possible best-worst pairs (5 best attributes34 levels34 worst attributes34 levels = 320 pairs) were computed. Marginal distributions of the best and worst frequencies provide model-free evidence of the relative impor- tance of attributes, as in Flynn et al.3
To account for heterogeneity in both preferences and scale, we estimated a latent class multinomial logit model with continuous variance scale using PandasBiogeme.16 The model extends the heteroscedastic multinomial logit (also known as scaled- multinomial logit) to allow for different latent preference seg- ments or classes. Following Flynn et al,3for each respondent, we computed the best minus worst score for each attribute level, squared them, and summed these squares for each attribute. We then normalized them with their sum across attributes, that is, the Empirical Scale Parameter (ESP). These normalized sums of squares were used in the class membership equation, which was specified as a multinomial logit function. The indirect utility function for respondent n in latent class Q was given by Un;Q¼expðmESPESPn1mBWBWÞh
SiASCi;Q1Sib0i;QXi;n
i
The scale factor was captured via the exponentiated expression in the equation. A best-worst indicator BW and the ESP were used for predicting (continuous) variance scale. The best-worst indicator was effects coded (best = 1 and worst =21) and captured the scale differences between best and worst sources of data. Attribute levelsXi;nare effects coded, andASCi;Q is an alternative specific constant for attributei.
Respondent preference-class membership probabilities were regressed on respondent characteristics to uncover associations between preferences and respondent characteristics.
Tariffs were calculated by normalizing the estimated beta- coefficients bi;Qs so that the best possible capability profile (highest capability state on each attribute) 44444 gives a value of 1, and the worst capability profile (lowest capability state on each attribute) 11111 gives a value of 0. These latent class tariffs were then weighted across classes using class shares to gain population tariffs.
To compare the Hungarian and the UK value set, we computed ICECAP-A utility scores for each respondent in our sample using both the Hungarian and the UK tariffs and presented these on a scatterplot. Selected capability profiles were further compared to analyze the implications of using different value sets.
Results
Sample Characteristics and Experiences With the Best-Worst Scaling Task
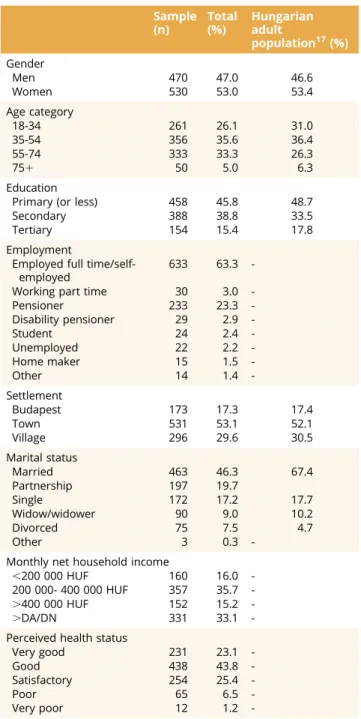
The sample size was 1000 respondents (53.0% women) with the average age of 48.0 years (standard deviation [SD] 16.9). The average EQ-5D-5L score of the sample was 0.92 (SD 0.18), and the EuroQol visual analog scale was 80.77 (SD 18.97). Other charac- teristics of respondents in the sample are summarized inTable 1.
A relatively low share of respondents (8%) totally agreed with the statement that “It was difficult to answer the best-worst scaling exercise,” whereas 26.5% of the respondents totally dis- agreed with this statement. The reasons for experiencing this
difficulty were choosing the best and worst attributes (mentioned by 44.1% of respondents), imagining being in a situation described by the profile (31.5%), and understanding the profile (12.7%).
Choice Data Summary
Table 2 presents the frequencies of the chosen best-worst pairs. “Best choices” data indicate very strong relative prefer- ences for attachment (with 2110 choices) and stability (with 2030 choices) attributes, followed by enjoyment (1222 choices), achievement (1139 choices), and autonomy (896 choices). The
“worst”data indicate the same order of items: strong aversion to low levels of attachment and stability. Autonomy seems to have the smallest impact on best or worst preferences. Attribute sum of Table 1. Descriptive statistics (n = 1000).
Sample (n)
Total (%)
Hungarian adult
population17(%) Gender
Men 470 47.0 46.6
Women 530 53.0 53.4
Age category
18-34 261 26.1 31.0
35-54 356 35.6 36.4
55-74 333 33.3 26.3
751 50 5.0 6.3
Education
Primary (or less) 458 45.8 48.7
Secondary 388 38.8 33.5
Tertiary 154 15.4 17.8
Employment
Employed full time/self- employed
633 63.3 -
Working part time 30 3.0 -
Pensioner 233 23.3 -
Disability pensioner 29 2.9 -
Student 24 2.4 -
Unemployed 22 2.2 -
Home maker 15 1.5 -
Other 14 1.4 -
Settlement
Budapest 173 17.3 17.4
Town 531 53.1 52.1
Village 296 29.6 30.5
Marital status
Married 463 46.3 67.4
Partnership 197 19.7
Single 172 17.2 17.7
Widow/widower 90 9.0 10.2
Divorced 75 7.5 4.7
Other 3 0.3 -
Monthly net household income
,200 000 HUF 160 16.0 -
200 000- 400 000 HUF 357 35.7 -
.400 000 HUF 152 15.2 -
.DA/DN 331 33.1 -
Perceived health status
Very good 231 23.1 -
Good 438 43.8 -
Satisfactory 254 25.4 -
Poor 65 6.5 -
Very poor 12 1.2 -
DA indicates denied to answer; DN, does not know.
square scores for various subsamples are inAppendix Table 2in Supplemental Materials found at https://doi.org/10.1016/j.jval.2 021.06.011. The histogram of ESP is presented in Appendix Figure 1in Supplemental Materials found athttps://doi.org/10.1 016/j.jval.2021.06.011.
Regression Estimates and Tariffs
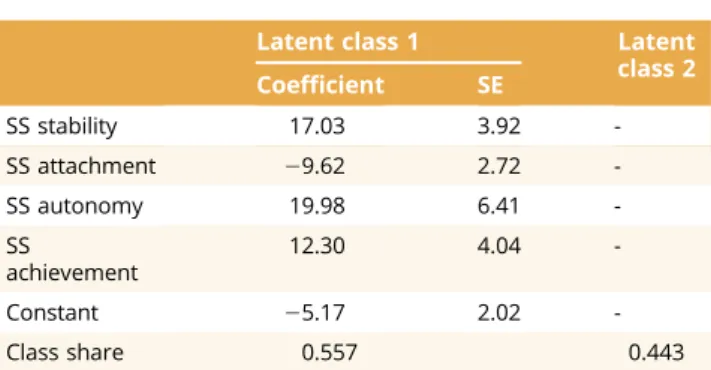
A 2 preference-class specification was selected (a 3 preference- class specification leads to very similar results without providing further insights as 2 large classes matched the characteristics of those obtained with the 2-class specification, whereas the size of the third class was small). The estimated preference parameters and tariffs are presented inTable 3, while class membership pa- rameters and scale parameters are presented inTables 4and5, respectively. Both ESP and the best-worst indicator were found to significantly affect the variance scale. The negative coefficient on the best-worst indicator implies that respondents were more consistent in what they least valued than what they most valued.
The ESP is a nonparametric indicator closely associated with scale, more random responses decrease ESP (random responses imply an average ESP of approximately 2), and the positive sign on the ESP-parameter was in line with our expectations of scale increasing in ESP (the average ESP in our sample was 4.2 with an SD of 0.7). In particular, our results imply that moving from an ESP of 2 (ESP of a random response) to our sample average ESP of 4.2 increases scale by a factor of 3.9.
The tariff indicates that all 5 attributes make a significant contribution to an individual’s capability well-being. Attachment seems to be the most important attribute (accounting for 26% of the space), followed by stability (24%), whereas the least impor- tant attribute is autonomy (14%). Within attributes, differences
were greatest between the intermediate levels of capability (moving from some capability to a lot of capability), except for stability, where the largest difference was between the lowest levels (from no capability to some capability).
Preference Classes and Personal Characteristics
Class shares are approximately 56% to 44% between the 2 latent classes, respectively. Latent class 1 values autonomy (19%) and achievement (20%) relatively more than latent class 2, which has a strong preference for attachment (35%). Multivariate analysis (shown inTable 6) reveals that being male, tertiary educated, divorced, and having a good health status (measured by EuroQol visual analog scale) are characteristics positively associated with latent class 1 membership (“autonomy and achievement”), whereas being women, pensioners, primary educated, living in marriage or partnership, and having a poorer health status are characteristics associated with latent class 2 membership (“attachment”).
Comparison With the UK Value Set
When we compared our estimates with the UK value set, we found that the order of the 3 most important attributes (attach- ment, stability, and enjoyment) matched, with tariffs being slightly higher for these in Hungary. The largest difference was found in valuing autonomy (Hungary: 14% and ranked last; the United Kingdom 18% and ranked fourth).
Heterogeneity of preferences revealed similar tendencies in both countries, with the notable difference that the latent class valuing attachment relatively more (our latent class 2) in the Hungarian data had a more pronounced valuation for attachment;
that is, attachment accounted for 35% of the tariff space in this Table 2. Best-worst pair frequencies (n = 1000, 16 scenarios).
Best attribute level (rows)
Worst attribute level (columns)
Stability Attachment Autonomy Achievement Enjoyment Total
1 2 3 4 1 2 3 4 1 2 3 4 1 2 3 4 1 2 3 4 best
Stability
1 0 0 0 0 5 6 4 2 11 9 6 9 10 1 4 5 15 1 3 1 92
2 0 0 0 0 124 50 3 3 73 22 12 16 54 15 8 16 55 31 7 6 495
3 0 0 0 0 383 159 7 4 148 124 19 13 220 186 11 10 268 108 11 7 1678
4 0 0 0 0 374 186 86 5 214 201 80 13 204 54 62 11 188 308 16 28 2030
Attachment
1 13 0 4 1 0 0 0 0 9 4 7 5 14 9 13 11 5 9 4 1 109
2 100 9 6 8 0 0 0 0 22 9 9 9 27 12 8 13 84 22 4 5 347
3 308 96 8 14 0 0 0 0 199 153 49 18 257 155 48 18 218 154 4 15 1714
4 437 216 12 10 0 0 0 0 171 173 27 20 227 205 29 18 298 230 33 4 2110
Autonomy
1 8 2 5 5 11 4 3 3 0 0 0 0 3 2 1 2 4 0 0 1 54
2 92 10 9 5 41 22 9 3 0 0 0 0 18 6 1 5 62 11 1 1 296
3 178 54 11 13 204 86 10 6 0 0 0 0 70 52 6 8 77 61 8 6 850
4 132 35 6 6 113 178 8 9 0 0 0 0 109 42 4 0 88 148 10 8 896
Achievement
1 5 3 2 5 14 11 8 8 5 0 0 2 0 0 0 0 3 1 0 1 68
2 142 4 6 8 81 35 11 13 18 4 1 1 0 0 0 0 67 12 2 2 407
3 170 36 7 12 295 156 23 7 70 55 17 4 0 0 0 0 108 126 5 6 1097
4 173 204 7 12 182 205 17 11 84 79 7 4 0 0 0 0 88 51 9 6 1139
Enjoyment
1 5 3 8 3 11 6 8 6 0 2 1 0 0 1 0 0 0 0 0 0 54
2 39 12 4 6 61 25 5 4 15 4 2 2 21 3 2 1 0 0 0 0 206
3 227 42 11 9 352 143 10 9 136 62 6 9 59 45 11 5 0 0 0 0 1136
4 168 105 5 16 236 217 38 7 100 61 29 10 105 101 22 2 0 0 0 0 1222
Total worst 2197 831 111 133 2487 1489 250 100 1275 962 272 135 1398 889 230 125 1628 1273 117 98 16000
class in the Hungarian data, whereas it only accounted for 31% of the tariff space in the corresponding UK latent class. The reverse holds for autonomy in the same preference class across countries:
in Hungary, autonomy accounted for 9%, whereas in the United Kingdom, it accounted for 14% of the tariff space in the latent
class valuing attachment relatively more. The other preference class showed a more even valuation for all attributes in both countries.
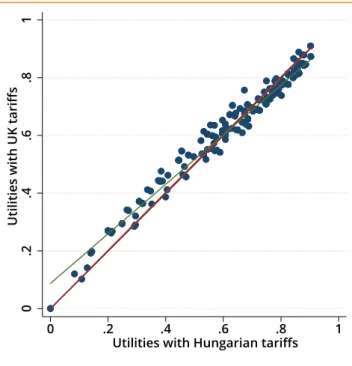
Figure 1provides a scatterplot of the utility scores for both tariffs applied to respondents in our sample with below sufficient capability (ie, with at least one attribute below 3).18Although the scores are closely aligned particularly for profiles with greater capability scores (tighter cluster of points around the slope = 1), there are noticeable differences for lower score capability profiles.
This is further demonstrated in Figure 2, which compares the scores across selected capability well-being states. Score differ- ences may be wider for lower capability states (eg, 22112), and the 2 tariffs may result in reversed rankings of capability states (22112 and 13211).
Improving capability within attributes was typically valued most for intermediate levels (from some capability to a lot of capability) in Hungary, whereas in the United Kingdom, typically moving from no capability to some capability within attributes led to the largest tariff gains. This is also supported byFigure 2, which shows that moving from capability state 11111 to 22222 results in a larger tariff gain in the United Kingdom, whereas the reverse holds for moving from capability state 22222 to 33333. Improving capability from a lot of capability to full capability was found to have the smallest gain for all attributes in both countries.
Table 3. Latent class logit model: estimated preference parameters and implied tariffs.
Latent class 1,
“Autonomy and Achievement”
Latent class 2,
“Attachment” Hungarian tariff UK tariff
Coefficient SE Coefficient SE Latent class 1 Latent class 2 Overall
Stability (mean) 0.284 0.034 0.159 0.040
Attachment (mean) 20.317 0.037 0.277 0.059 Autonomy (mean) 20.119 0.033 20.138 0.042
Enjoyment (mean) 20.403 0.038 0.169 0.044
Stability (4) 2.245 1.425 0.220 0.197 0.210 0.2221
Stability (3) 1.627 0.069 1.103 0.078 0.191 0.178 0.185 0.1915
Stability (2) 20.570 0.061 20.516 0.053 0.088 0.081 0.085 0.1013
Stability (1) 23.303 0.145 22.012 0.146 20.040 20.008 20.026 20.0008
Attachment (4) 1.882 2.679 0.203 0.272 0.233 0.2276
Attachment (3) 1.330 0.084 1.881 0.093 0.177 0.224 0.198 0.1890
Attachment (2) 20.898 0.069 21.436 0.081 0.073 0.026 0.052 0.0964
Attachment (1) 22.314 0.138 23.125 0.154 0.006 20.074 20.029 20.0239
Autonomy (4) 1.663 0.564 0.193 0.146 0.172 0.1881
Autonomy (3) 1.103 0.065 0.662 0.061 0.166 0.151 0.160 0.1560
Autonomy (2) 20.463 0.048 20.328 0.037 0.093 0.092 0.093 0.0836
Autonomy (1) 22.302 0.134 20.898 0.099 0.007 0.058 0.030 0.0063
Achievement (4) 1.768 0.937 0.198 0.168 0.184 0.1811
Achievement (3) 1.181 0.072 0.814 0.061 0.170 0.161 0.166 0.1588
Achievement (2) 20.519 0.048 20.433 0.046 0.090 0.086 0.089 0.0909
Achievement (1) 22.429 0.140 21.319 0.122 0.001 0.033 0.015 0.0210
Enjoyment (4) 1.548 1.675 0.187 0.212 0.198 0.1811
Enjoyment (3) 1.249 0.073 1.313 0.081 0.173 0.190 0.181 0.1540
Enjoyment (2) 20.882 0.057 20.956 0.067 0.073 0.055 0.065 0.0693
Enjoyment (1) 21.915 0.126 22.032 0.119 0.025 20.009 0.010 20.0026
Note.Variables are effects coded.
SE indicates robust standard errors to account for clustering at respondent level.
Table 4. Latent class logit model: estimated class membership parameters.
Latent class 1 Latent
class 2 Coefficient SE
SS stability 17.03 3.92 -
SS attachment 29.62 2.72 -
SS autonomy 19.98 6.41 -
SS
achievement
12.30 4.04 -
Constant 25.17 2.02 -
Class share 0.557 0.443
Note.Attribute SS scores are normalized by Empirical Scale Parameter (ESP).
SE indicates standard error; SS, sum of square.
Discussion
In this study, we obtained population-based tariff sets for the ICECAP-A in Hungary. The attribute contributing most to capability scores was attachment, followed by stability and enjoyment, whereas the least important attributes were achievement and autonomy.
We pointed out notable heterogeneities in preferences by identifying 2 preference classes, one with a focus on attachment and the other one with strong relative preferences for achieve- ment and autonomy. For example, people who are in worse health status have stronger preference for attachment than for achieve- ment and autonomy. Nevertheless, the tariff set developed reflects
preferences of the whole population rather than specific sub- groups in accordance with the commonly used methodology to develop value sets for health measures.19
Country-specific tariff set is now available in Hungary to promote the use of ICECAP-A instruments in economic evaluations. Tariffs are used to calculate a utility index score that can be further used in cost- utility analysis as substitutes for or complements of health-related QOL outcome measures. The use of capability in economic evalua- tions is still under development to better understand the health and wider nonhealth implications of new technologies and public health policies.3 Nevertheless, the literature suggests that capability measures such as the ICECAP-A could better reflect improvements in well-being, where outcomes extend beyond health. For instance, in thefields of social care, long-term care, or mental health services, standard economic techniques based on health-related QOL (QALYs) would underestimate such gains. Some cost-effectiveness studies use ICECAP-A in addition to the EQ-5D instrument to calculate cost of YFC,20,21whereas others also experiment with calculating the cost of a year of sufficient capability.21Using capability measures alongside health-related QOL measures in economic evaluations Table 5. Latent class logit model: estimated scale parameters.
Coefficient SE
Best-worst (BW) 20.074 0.013
ESP 0.621 0.040
Note.The BW indicator is effects coded.
ESP indicates Empirical Scale Parameter; SE, standard error.
Table 6. Class membership probabilities and personal characteristics.
Dependent variable: probability of latent class 1
(“autonomy and achievement”) membership, conditional on choices
Coefficient SE
Sex (benchmark: female)
Male 0.182 0.029
Income (benchmark: low)
Middle 0.000 0.051
High 0.027 0.062
DA/DN 0.047 0.051
Age (benchmark: 18-34 y)
35-54 0.016 0.042
55-74 20.004 0.057
751 0.046 0.095
Employment (benchmark: employed full time/self-employed)
Working part time 0.168 0.088
Pensioner 20.106 0.052
Disability pensioner 20.159 0.081
Student 20.008 0.094
Unemployed 0.032 0.110
Home maker 0.010 0.114
Other 20.064 0.126
Education (benchmark: primary)
Secondary 20.043 0.032
Tertiary 0.078 0.042
Marital status (benchmark: married)
Partnership 20.076 0.040
Single 0.031 0.049
Widow/widower 0.126 0.067
Divorced 0.157 0.055
Other 0.108 0.221
Perceived health (z-score)
EQ-VAS 0.066 0.016
Constant 0.400 0.068
DA indicates denied to answer; DN, does not know; EQ-VAS, EuroQol visual analog scale; SE, standard error.
Figure 2.Utilities of selected capability profiles implied be the Hungarian and UK tariffs.
Utilities using UK tariffs 0
11111
0.290 13211
0.294 22112
0.442 22222
0.849 33333
1 44444 Utilities using Hungarian tariffs
0 11111
0.248 22112
0.290 13211
0.384 22222
0.889 33333
1 44444
Figure 1.Scatterplot of utilities computed with Hungarian and UK tariffs. For each respondent in our sample with below sufficient capabilities (ie, at least one level 2 or level 1 attribute level), we compute their utility scores using both the Hungarian and the UK tariffs tabulated inTable 3. A line with a slope equal to one is added.
0.2.4.6.81Utilities with UK tariffs
0 .2 .4 .6 .8 1
Utilities with Hungarian tariffs
would also allow to compare interventions/investments between social and healthcare sectors.
In our large-scale study, we confirmed the transferability of the research method and instrument used previously in the United Kingdom to develop tariffs for the ICECAP-A. We also found that the best-worst scaling exercise was feasible for respondents and worked as a good alternative stated preference technique to discrete choice experiment, where respondents might be overwhelmed by the complexity of the task. This positive experience might also encourage further studies that use self- administered online questionnaires instead of an interviewer to guide the respondent. Nonetheless, further standardization of the survey technique and development of a study protocol and a quality control process deserves a consideration to ensure comparability between value sets.
The Hungarian and the UK value sets were broadly compara- ble; nevertheless, we can observe some relevant differences in values, which may reflect differences in preferences and cultural values across countries. The most relevant was that autonomy was valued relatively more by UK respondents (similarly to the levels of achievement and enjoyment in the United Kingdom), whereas this was clearly the least important attribute for Hungarians. This is consistent with previous evidence on population values and cultural differences.22 For instance, the UK population tends to agree more with the statement that it is the individual’s re- sponsibility to provide for themselves, whereas a relatively larger fraction of the population in Hungary would argue that it is the state’s responsibility.23Plausibly, in a culture that emphasizes the responsibility of the individual, the capability of being indepen- dent should matter more. Similar to the UK study, our tariffs also suggest that people place greater value on improving the capa- bility of those with lower levels of capability,3with the caveat that the Hungarian results imply that the largest gains typically occur when moving from the second level of an attribute to its third level (some capability vs a lot of capability), whereas in the United Kingdom, the largest gains occur when moving from no capability to some capability (Fig. 2).
Using a different approach based on experienced utility, Himmler et al6estimated different UK weights for attachment and autonomy items than Flynn et al.3Because of differences in methodology, re- sults are not directly comparable.
The differences in the UK and the Hungarian value sets high- light the importance of developing and using local tariffs based on local preferences in economic evaluations. Local tariffs lead to different valuations of the same capabilities, which can have sig- nificant implications for the results of an economic evaluation.
Figure 2highlights that utility rankings of 2 states (both below sufficient capability) are reversed when using UK tariffs. Hence, different groups might be prioritized for treatment with UK and Hungarian tariffs.
Strengths and Limitations
Some strengths and limitations of this study should be mentioned. First, we believe that the best-worst scaling task was feasible for respondents and that data obtained from the exercise are reliable. Overall, the results of the study indicated logical well- behaved response patterns, with less attractive states consistently receiving lower values (eg, approximately 90% of worst chosen at- tributes had a level of 1 or 2, whereas 85% of best chosen attributes had a level 3 or 4) consistent with the health-state valuation liter- ature. The distribution of the ESP (seeAppendix Figure 1in Sup- plemental Materials found athttps://doi.org/10.1016/j.jval.2021.06.
011) also shows that complete random responses (which would imply ESP to be distributed around 2) and responses that would
attempt to game the survey (implying ESPs close to 8) were not prevalent in the sample. In addition, a relatively low proportion of respondents (8%) totally agreed with the statement that“It was difficult to answer the best-worst scaling exercise.”
Second, in this study, although we aimed for representative- ness of our samples in terms of gender, age, education, and regional distribution, we could not match the sample for further characteristics that might be relevant for the evaluation of capa- bilities. Moreover, only respondents living in their own home were invited; hence, institutionalized, homeless, or hospitalized people were not involved.
Although we revealed some relevant country-specific differ- ences compared with the only available UK tariffs, we cannot rule out that some differences were related to sampling issues or other unexplored differences. Nevertheless, both studies used computer- assisted personal interviews, targeted the representative sample of the general population (nevertheless, in the UK survey, random selection method was used, and in our survey, quotas were applied, which is a nonprobability selection method), and applied the same design and analytical approach (considering heterogeneity in both preferences and variance scale at the level of the individual respondent), which increases the comparability of results. Similar to the UK study, our approach did not estimate interaction effects.
Conclusions
This article has provided a local Hungarian value set for the ICECAP-A capability well-being measure. This is the first local decision utility–based value set besides the original value set of the UK population. Using comparable methods allowed a com- parison of the UK and the Hungarian tariffs and pointed out some relevant differences in preferences, which justifies the need for local tariffs in economic evaluations.
Supplemental Material
Supplementary data associated with this article can be found in the online version athttps://doi.org/10.1016/j.jval.2021.06.011.
Article and Author Information
Accepted for Publication:June 18, 2021 Published Online:xxxx
doi:https://doi.org/10.1016/j.jval.2021.06.011
Author Affiliations: School of Accounting and Finance, University of Bristol, Bristol, England, UK (Farkas); Department of Health Services Research and Policy, Research School of Population Health, Australian National University, Acton, Australia (Huynh); Health Economics Research Center (Gulácsi, Zrubka, Péntek) and Physiological Controls Research Center (Kovács), University Research and Innovation Center, Óbuda Uni- versity, Budapest, Hungary; Corvinus Institute for Advanced Studies (Gulácsi, Zrubka), Corvinus Center for Foreign Language Education and Research (Dobos), and Department of Health Economics (Baji), Corvinus University of Budapest, Budapest, Hungary.
Correspondence:Petra Baji, PhD, Department of Health Economics, Cor- vinus University of Budapest, 8 F}ovám tér, Budapest, Hungary 1093. Email:
petra.baji@uni-corvinus.hu
Author Contributions: Concept and design: Farkas, Huynh, Gulácsi, Zrubka, Dobos, Kovács, Baji, Péntek
Acquisition of data:Gulácsi, Zrubka, Baji, Péntek
Analysis and interpretation of data:Farkas, Huynh, Gulácsi, Dobos, Kovács, Baji, Péntek
Drafting of the manuscript:Farkas, Baji, Péntek
Critical revision of the paper for important intellectual content:Farkas, Huynh, Gulácsi, Zrubka, Dobos, Kovács, Baji, Péntek
Statistical analysis:Farkas, Baji
Obtaining funding:Gulácsi, Zrubka, Baji, Péntek
Administrative, technical, or logistic support:Gulácsi, Zrubka, Péntek Supervision:Kovács, Péntek
Conflict of Interest Disclosures:Drs Farkas, Gulácsi, Baji, and Péntek reported receiving grant support from the Higher Education Institutional Excellence Program 2020 of the Ministry of Innovation and Technology in the framework of the “Financial and Public Services”research project (TKP2020-IKA-02) at the Corvinus University of Budapest during the conduct of this study. Dr Péntek reported being a member of the EuroQol Group, a not-for-profit organization that develops and distributes in- struments that assess and value health. No other conflicts were reported.
Funding/Support:This research was supported by the Higher Education Institutional Excellence Program 2020 of the Ministry of Innovation and Technology in the framework of the “Financial and Public Services” research project (TKP2020-IKA-02) at the Corvinus University of Budapest.
Role of the Funder/Sponsor:The funder had no role in the design and conduct of the study; collection, management, analysis, and interpretation of the data; preparation, review, or approval of the manuscript; and de- cision to submit the manuscript for publication.
REFERENCES
1. Proud L, McLoughlin C, Kinghorn P. ICECAP-O, the current state of play: a systematic review of studies reporting the psychometric properties and use of the instrument over the decade since its publication. Qual Life Res.
2019;28(6):1429–1439.
2. Al-Janabi H, Flynn TN, Coast J. Development of a self-report measure of capa- bility wellbeing for adults: the ICECAP-A.Qual Life Res. 2012;21(1):167–176.
3. Flynn TN, Huynh E, Peters TJ, et al. Scoring the ICECAP-a capability instru- ment. Estimation of a UK general population tariff. Health Econ.
2015;24(3):258–269.
4. Mitchell PM, Roberts TE, Barton PM, Coast J. Assessing sufficient capability: a new approach to economic evaluation.Soc Sci Med. 2015;139:71–79.
5. Helter TM, Coast J,Łaszewska A, Stamm T, Simon J. Capability instruments in economic evaluations of health-related interventions: a comparative review of the literature.Qual Life Res. 2020;29(6):1433–1464.
6. Himmler S, van Exel J, Brouwer W. Happy with your capabilities? Valuing ICECAP-O and ICECAP-A states based on experienced utility using subjective well-being data.Med Decis Making. 2020;40(4):498–510.
7. Rencz F, Brodszky V, Gulácsi L, et al. Parallel valuation of the EQ-5D-3L and EQ-5D-5L by time trade-off in Hungary.Value Health. 2020;23(9):1235–1245.
8. Baji P, Farkas M, Golicki D, et al. Development of population tariffs for the CarerQol instrument for Hungary, Poland and Slovenia: a discrete choice experiment study to measure the burden of informal caregiving.Pharma- coeconomics. 2020;38(6):633–643.
9. Hoefman RJ, van Exel J, Brouwer WB. Measuring care-related quality of life of caregivers for use in economic evaluations: CarerQol tariffs for Australia, Germany, Sweden, UK, and US.Pharmacoeconomics. 2017;35(4):469–478.
10. Flynn TN, Louviere JJ, Peters TJ, Coast J. Best–worst scaling: what it can do for health care research and how to do it.J Health Econ. 2007;26(1):171–189.
11. Baji P, Farkas M, Dobos Á, et al. Capability of well-being: validation of the Hungarian version of the ICECAP-A and ICECAP-O questionnaires and population normative data.Qual Life Res. 2020;29(10):2863–2874.
12. Wild D, Grove A, Martin M, et al. Principles of good practice for the trans- lation and cultural adaptation process for patient-reported outcomes (PRO) measures: report of the ISPOR Task Force for Translation and Cultural Adaptation. 2005;8(2):94-104.
13. Herdman M, Gudex C, Lloyd A, et al. Development and preliminary testing of the newfive-level version of EQ-5D (EQ-5D-5L).Qual Life Res. 2011;20(10):1727–
1736.
14. Thurstone LL. A law of comparative judgment.Psychol Rev. 1927;34(4):273–286.
15. McFadden D.Conditional Logit Analysis of Qualitative Choice Behavior. In:
Chapter 4, Zarembka, P., Ed., Frontiers in Econometrics, 105-142. New York:
Academic Press; 1973.
16. Bierlaire M. A short introduction to PandasBiogeme. Technical report TRANSP-OR 200605.https://transp-or.epfl.ch/documents/technicalReports/
Bier20.pdf. Accessed November 5, 2020.
17. Hungarian Central Statistical Office, Population census 2011. National data.
http://www.ksh.hu/nepszamlalas/tables_regional_00?lang=en. Accessed April 19, 2021.
18. Kinghorn P. Using deliberative methods to establish a sufficient state of capability well-being for use in decision-making in the contexts of public health and social care.Soc Sci Med. 2019;240:112546.
19. Versteegh M, Knies S, Brouwer W. From good to better: new Dutch guidelines for economic evaluations in healthcare. Pharmacoeconomics.
2016;34(11):1071–1074.
20. Bray N, Brand A, Taylor J, Hoare Z, Dickinson C, Edwards RT. Portable elec- tronic vision enhancement systems in comparison with optical magnifiers for near vision activities: an economic evaluation alongside a randomized crossover trial.Acta Ophthalmol. 2017;95(5):e415–e423.
21. Goranitis I, Coast J, Day E, Copello A, Freemantle N, Frew E. Maximizing health or sufficient capability in economic evaluation? A methodological experiment of treatment for drug addiction. Med Decis Making.
2017;37(5):498–511.
22. Schwartz SH, Boehnke K. Evaluating the structure of human values with confirmatory factor analysis.J Res Pers. 2004;38(3):230–255.
23. EVS.European values study longitudinal datafile 1981-2008 (EVS 1981-2008).
ZA4804 Datafile Version 2.0.0. Cologne, ZA: GESIS Data Archive; 2011.