Validation of the PAM-13 instrument in Hungary
Zrubka Zsombor, Vékás Péter, Németh Péter, Dobos Ágota, Hajdu Ottó, Kovács Levente, Gulácsi László
Background
In our days more and more people live with chronic conditions, which will account for nearly three quarters of global mortality in 2020 [1]. The quest for sustainable financing of
healthcare systems needs to embrace efficient approaches in the management of chronic conditions [2]. Over the last decades, patient-centredness has gained considerable attention in medicine, which, by putting patients’ values and preferences in the forefront of medical decision-making, aims for their more efficient involvement as partners in the health
production process [3, 4]. The active involvement of patients is particularly important in the reduction of modifiable lifestyle-related risks, which contribute to a considerable share of excess mortality from chronic conditions [5]. Since large-scale policy measures such as changes of income or education, that can influence important individual determinants of health and healthy behaviours potentially span in time over generations, personally acquired potentials, which can develop over later courses of life, such as knowledge, skills, positive emotions and engagement are of particular importance from both public health and health economic perspective [6, 7]. A number of theories, such as internal locus of control [8], self-efficacy [9] or self-management [10] or the transtheoretical model of change [11] have addressed the drivers of change in health behaviours, and a number care delivery models, such as the Chronic Care Model promoted systematic improvements involving patient-centredness, support for self-management, evidence-based proactive interventions, integrated team-care and supportive information technology solutions [12].
Digital health interventions have been shown to be effective in promoting healthy behaviours through patient education or supporting behaviour change, and upon the demonstration of adequate supportive evidence, authorities are now considering their adoption among publicly financed health technologies [13, 14].
The Patient-Activation Measure (PAM) has been developed to serve as a reliable patient- reported outcome measure (PROM) that can measure the skills, knowledge and motivation of patients that are necessary for their effective contribution to their own care, and
eventually predict better outcomes [15]. Since its development, PAM has become an officially adopted PROM by the National Institute of Health of the US and the National Health Service of the UK, its validated versions have been available in over 20 countries and it has been applied in over 500 studies worldwide [16]. It has been demonstrated that higher PAM values are associated with better health outcomes [17], fewer lifestyle-related risks [18], better adherence to therapy [19], and lower use of healthcare resources [18, 20].Furthermore, it has been shown that patient activation can be improved via digital health interventions [21, 22] as well as offline patient-support programs [23].
In accordance with national policies aiming to reduce lifestyle related excess mortality as well as the advancement of digital health [24], our aim was to adapt and validate the abbreviated PAM-13 tool in Hungary to serve as a widely tested and internationally recognised instrument in the development or monitoring of evidence-based health- promotion interventions.
Methods Data collection
In April 2020 we conducted an online survey recruiting 900 respondents from a large online panel via quota-based sampling with strata set according to the 2011 population census.
[25]. Our sample was representative of the 40+ years old Hungarian population in terms of age groups (40-49, 50-59, 60-69 and 70+ years old), gender, education (primary, secondary and tertiary), geographic region (7 NUTS-2 regions) and type of residence (village, town or capital city). After 10 days, 100 respondents were randomly selected for repeat
administration of the entire survey. We considered 10 days lag sufficient to prevent recall, yet capture a stable PAM-13 status [26-28]. Ethical approval was granted by the National Medical Research Council (TUKEB, ID: 49702-3/2019/EKU) and applicable licenses were obtained for the instruments (PAM-13, EQ-5D). Data collection was performed by an online research firm, NRC Kft.
Translation of PAM
The Hungarian language version of the PAM-13 questionnaire was produced in accordance with the WHO guidelines for the translation and adaptation of instruments [29]. Forward- translation was performed by two independent experts, the back-translation was carried out by two bilingual translators and elaborated by two researchers (DÁ and ZZ) against the original version of the instrument. The draft instrument was piloted along with cognitive debriefing on 10 respondents including both males and females from different age groups.
The literal translations were overridden at several questions with natural phrases that were considered to be acceptable for the broadest audience, yet conceptually equivalent with the original questionnaire. The pre-final version was consulted with the developers of the PAM instrument. The 4-level Likert scale response options of the original instrument (“Disagree strongly”, “Disagree”, “Agree”, “Agree strongly”) were slightly modified to mark more precisely the scale degrees in a Hungarian context (“Completely disagree”, “Rather disagree”, “Rather agree”, “Completely agree”). The Hungarian PAM-13 is attached in [Electronic Supplementary Material Sx.]
The survey questionnaire PAM-13
PAM-13 assesses one’s knowledge, skill and confidence for self-management. The instrument consists 13 items, scored on a 4-point Likert scale and a 5th not applicable option. For a valid PAM score, up to 3 not applicable responses are allowed. The items are ordered in increasing difficulty. Using a proprietary scoring algorithm based on Rasch analysis, PAM is scored on a scale of 0-100, where lower values suggest that less likelihood that patients engage in effective self-management. Based on their PAM scores, patients are grouped into four PAM levels. At level 1, patients may not understand the need to take active role in their health. At level 2, their confidence or skill is probably too low to take action, at level 3 patients are beginning to take action, and at level 4, they may endure in self-management even in difficult times [15, 30, 31].
eHEALS
eHEALS measures self-reported eHEALTH literacy using eight 5-point Likert scale items. The eHEALS score (range 8-40) is calculated by summing individual item scores, with higher values indicating greater skill levels. The Hungarian eHEALS instrument has been validated in the general population via an online survey [32, 33]. Since eHEALS showed weak correlation with objective performance tests [34, 35], we also measured performed health literacy in our survey.
NVS
The Newest Vital Sign is a frequently used screening instrument for performed health literacy. Respondents need to answer six questions by interpreting the information from an ice-cream nutritional label and performing simple arithmetic tasks. For some questions correct answers can be formulated in several ways. The number of correctly answered items are counted. A score of 0-1 indicates limited - , 2-3 indicated probably limited- , and 4-6 indicates adequate health literacy [36]. We adapted the Hungarian NVS for online administration [37]. Instead of offering multiple-choice options in the online adaptation [38], we specified the measurement unit for answers in the questions, and evaluated the accuracy of free-text answers.
EQ-5D-5L
We measured health-related quality of life via the Hungarian version of EQ-5D-5L [39]. The EQ-5D-5L consists a descriptive system, which asks respondents to evaluate their current health in 5 dimensions (mobility, self-care, usual activities, pain/discomfort,
anxiety/depression) using 5 levels (1: no problems, 2: mild problems, 3: moderate problems, 4: severe problems, 5: extreme problems). By combining the problem levels in each
dimension, the EQ-5D-5L can describe 3125 (55) discrete health profiles, to which utility values are attached reflecting preferences of the general population. We used the
Hungarian value-set in our study [40]. As part of EQ 5D, we also applied the EQ VAS, which is a 20-cm vertical visual analogue scale asking respondents to evaluate their current health between the two extremes of 0 (worst imaginable health) and 100 (best imaginable health).
MEHM
We also inquired respondents’ health by the Minimal European Health Module (MEHM).
The MEHM consists of three questions. Self-perceived health evaluates current health on a 5-point Likert scale (Very good; Good; Fair; Bad; Very Bad). The Global Activity Limitation Indicator (GALI) asks limitations in activities over the past 6 months due to a health problem (Not limited, Limited but not severely, Severely limited). A final item (Chronic Morbidity) inquires the presence of long-standing health problems [41].
Health-related information seeking and online behaviours
We constructed seven items to assess the frequency of various health-related information seeking and online behaviours over the past 12 months. Item 1 inquired about health information seeking in general and item 2 about participation at patient-education programs. Items 3-7 inquired about health-related use of the internet or mobil devices in different functional domains, motivated by the classification of the evidence standards
framework of digital health interventions proposed by NICE [14]. Item 3 inquired general health-related administration, item 4 about health-related information seeking, item 5 about health-related communication with HCPs, helpers or peer patients, item 6 about health prevention activities and item 7 about disease management activities using the internet or mobil devices. All items were scored on a 6-point Likert scale (never, few times past year, bimonthly, monthly, several times per month, at least once a week).
Demographic variables
We recorded basic demographic variables and defined the following subgroups: age (40- 49,50-59, 60-69, 70+ year olds), gender (male, female), family status (single, married, domestic partnership, divorced, widowed and other), education (primary, secondary, tertiary), health professional qualification (yes, no), type of settlement (capital, town,
village), NUTS2 region and the place of residence based on poscode. Net monthly household income was queried in 11 range categories, and per-capita household income was
calculated by dividing the category mid-range values by the number of household members, without adjustment for the number of children. The mid-range value of the upper open category was calculated by fitting the Pareto curve as proposed by Parker and Fenwick [42].
Local currency values were transformed to Euros using the average exchange rate for the period of Apr 1, 2019 Apr 1,-2020 (330.7 HUF/EUR) [43]. We also recorded respondents’
level of happiness using the 10-point numeric happiness scale [44]. Although not in scope for our current research goals, we also recorded healthcare resource use, out-of-pocket expenditure and general wellbeing using the capability-based ICECAP-A and ICECAP-O instruments [45-48].
Lifestyle risks
We recorded the most common modifiable risk factors for all-cause mortality and chronic conditions, such as BMI, smoking, alcohol intake, dietary habits, physical activity and sedentary behaviour [49-53]. Lifestyle-risk (LR) were inquired via single-question self-
reported items. In order to represent similar “severity levels”, the following LR cutoff values were chosen that represent approximately 1.4-fold or greater relative risk increase for overall mortality: BMI <18.5 or BMI ³30 [54], current smoking [55, 56], sedentary behaviour
³8 hours per day with <150 min exercise per week or no exercise at all [57], no fruit or vegetable intake [58] and binge drinking ³1 day per week [59]. Binge drinking was defined as >5 drinks / occasion for men and >4 drinks / occasion for women [59, 60]. We also generated LR index (LRI) by adding the number of LR’s for each patient. Based on their LR index, respondents were assigned to risk groups using stringent- (no LR vs any LR) and relaxed (0-1 LR vs 2-4 LR) criteria.
Preventive behaviours
We considered the participation at screenings and vaccination programs as preventive behaviours, which are prescribed by Hungarian law [61, 62]. According to this, for females we counted the participation at cervical cancer screening between 25-65 years of age, breast cancer screening between 45-65 years of age, colorectal screening between 50-70 years of age, blood pressure, blood glucose and cholesterol levels measured within a year,
flu vaccination at 60+ years of age and bacterial pneumonia vaccination at 50+ years of age.
For males we counted the participation at prostate cancer colorectal cancer screening between 50-70 years of age, blood pressure, blood glucose and cholesterol levels measured within a year, flu vaccination at 60+ years of age and bacterial pneumonia vaccination at 50+
years of age. In order to make respondents with different gender and age comparable, we calculated the preventive behaviour score (PBS) as the proportion of performed preventive behaviours compared to the maximum of preventive behaviours prescribed for a given age and gender. For example, having only blood pressure measured within a year would represent a PBS of 0.33 for a 40-year-old man (with only blood pressure, glucose and cholesterol check recommended), while it would be a PBS of 0.125 for a 60-year-old woman, (for whom cervix-, breast- and colorectal cancer screenings, blood pressure, glucose and cholesterol tests, as well as flu and bacterial pneumonia vaccinations are recommended). We also grouped respondents based on their PBS (<50%, ³ 50%).
Excluded respondents
Before data analysis, we checked the dataset for outliers and based on group consensus, we set implausible values to missing, or deleted entire records in case of potentially unreliable answer patterns. We deleted the data point if sedentary time was reported >18 hours / day, and we deleted cases if the frequency of online health information seeking was reported over two categories greater than general health information seeking, response times for shorter than 4 second per item for the survey instruments (PAM-13, eHEALS, ICECAP-A, ICECAP-O), or shorter than 1 minute for the NVS instrument. One respondent was excluded due to unlikely body parameters (height 111 cm, weight 200 kg, BMI=162), and based on the PAM license owner’s recommendation, we dropped individuals with a PAM-13 score of 0 and 100 as well as ones with not applicable answers in more than 3 PAM-13 items [63].
Statistical methods
We followed the applicable COSMIN guidelines for patient-reported outcome measurement instruments when planning the methods of our study [64-66]. Missing data, descriptive statistics and distributional properties were asessed for all variables. The distribution of PAM- 13 scores was assessed via inspection of the histogram and quantile-plot, and normality was tested via the Shapiro–Wilk test. Floor- and ceiling effects (frequency of the highest and lowest scores in the sample) were assessed against the threshold of 15% [67]. We tabulated respondents based on their PAM levels.
Reliability
We evaluated internal consistency via computing Cronbach’s alpha. Test-retest reliability for PAM-13 scores was assessed by intra-class correlation coefficient of agreement using a two- way random effects model (ICCagreement or ICC(A,1)) [68]. For categorical PAM levels, we calculated weighted kappa using quadratic weights to progressively penalise greater differences between categories [68]. Measurement error (standard error of measurement,
SEM) was calculated using the formula !"# = % ∗ '1 − *++!"#$$%$&', where % is the pooled standard deviation of the pooled sample from repeat administration. The smallest detectable change (SDC, the smallest change that can be detected within a single person with p<0.05 taking measurement error into consideration) was calculated via the following formula
!-+ = 1.96 ∗ √2 ∗ !"# [28]. We considered the following thresholds for good measurement properties: ≥0.7 for ICCagreement and weighted kappa, and the range of 0.7-0.95 for Cronbach’s alpha [28].
Validity
Content validity was assessed during the translation process, no further quantitative measurements were performed. Construct validity was assessed via confirmatory factor analysis using robust structural equitation modelling via the R package lavaan [69], asuming a single underlying factor. We checked the Kaiser-Meyer-Olkin (KMO) statistic for the adequacy of sampling [70] and Bartlett-test for sphericity to check the adequacy of our data for factor analysis. Model fit was assessed by the RMSEA, the Tucker-Lewis index (TLI) and the comparative fit index (CFI), using cutoff values of ≤0.05, 0.9 and 0.9 for good fit,
respectively. Convergent validity was assessed by the correlation between PAM-13 scores as well as PAM levels and eHEALS scores, based on the assumption that both instruments measure advanced knowledge and are conceptually related to self-efficacy [15, 33]. We expected significant positive relationship between the two measures. Discriminant validity was tested by the expectation of weak or non-significant correlation between PAM-13 scores and levels and age, education and income, based on the assumption that PAM measures qualities that cannot be explained by socio-economic status. We applied Pearson correlation between continuous measures, and polyserial correlation when categorical measures were involved.
When testing known-groups validity, our hypothesis was the following: patients with more preventive behaviours (PBS ≥50%), fewer lifestyle risks (LRI=0 or LRI ≤1), those, who were more active in health information seeking, patient education, online/mobile health-
information seeking- , health-related communication, disease-prevention- or disease
management activities had higher mean PAM scores. We defined higher activity as having at least median scores on each item, or any activity over the past year, if majority of
respondents did not engage in the respective online activity. The hypotheses were tested using one-sided Welch’s t-test. We also explored the same hypotheses in subgroups of patients with or without chronic disease, male or female respondents, and respondents ≥65 years of age or younger, respondents in the lowest income group or higher and respondents with adequate (NVS≥4) or lower health literacy scores. We deleted missing values pairwise for all statistical analyses. No missing values were imputed.
Item-response theory
Results Descriptives
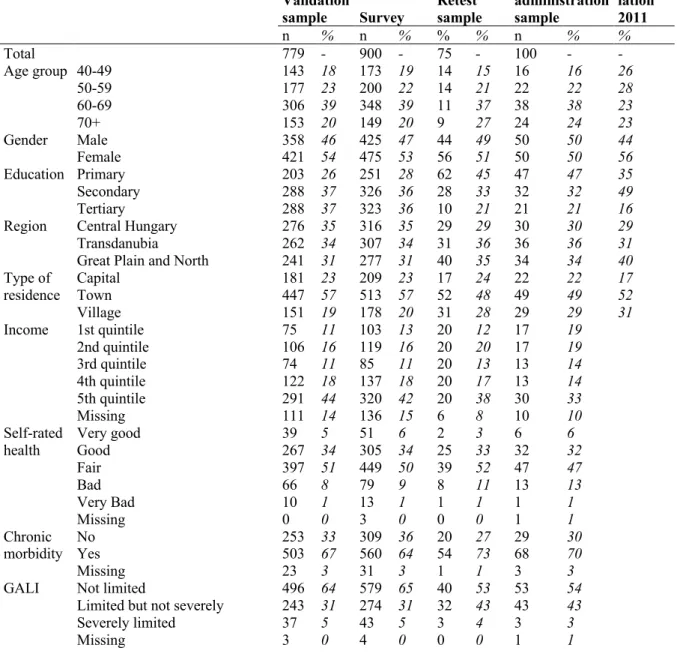
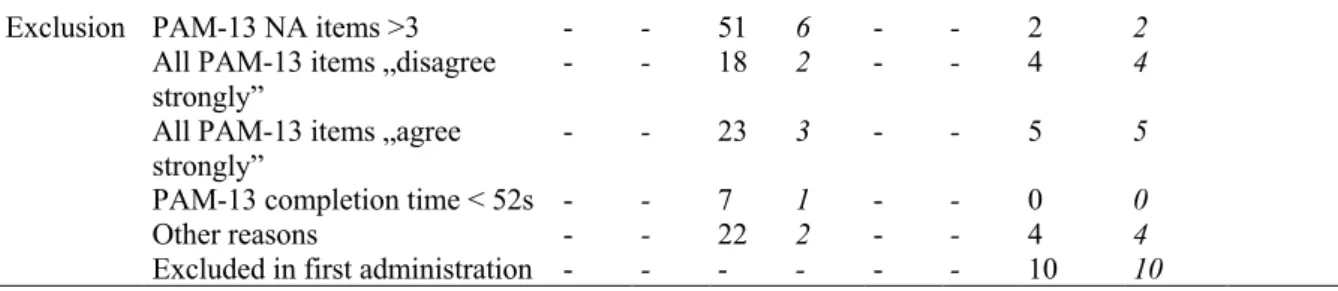
From the 900 survey respondents 779 (86.6%) individuals were eligible for the analysis (validation sample). For PAM-13-related quality issues we excluded 99 respondents (11.0%), and other 22 respondents (2.4%) due to other reasons detailed above. From retest sample (n=100), 11 (11.0%) had PAM-13-related quality issues, 4 (4.0%) other reasons for exclusion and 10 respondents were excluded in the first administration. Altogether, 75 respondents had matching test-retest scores (retest sample).
In the validation sample, mean age was 60.4 (SD=10.6) years, 54.0% were female, 66.5%
reported to have chronic disease. The demographic properties, reasons for exclusion and corresponding values from the general population are summarized in Table 1. [vs General population]
Table 1 Sociodemographic charatcteristics and health status
Validation
sample Survey Retest sample
Repeat administration sample
General popu- lation 2011
n % n % % % n % %
Total 779 - 900 - 75 - 100 - -
Age group 40-49 143 18 173 19 14 15 16 16 26
50-59 177 23 200 22 14 21 22 22 28
60-69 306 39 348 39 11 37 38 38 23
70+ 153 20 149 20 9 27 24 24 23
Gender Male 358 46 425 47 44 49 50 50 44
Female 421 54 475 53 56 51 50 50 56
Education Primary 203 26 251 28 62 45 47 47 35
Secondary 288 37 326 36 28 33 32 32 49
Tertiary 288 37 323 36 10 21 21 21 16
Region Central Hungary 276 35 316 35 29 29 30 30 29
Transdanubia 262 34 307 34 31 36 36 36 31
Great Plain and North 241 31 277 31 40 35 34 34 40
Type of
residence Capital 181 23 209 23 17 24 22 22 17
Town 447 57 513 57 52 48 49 49 52
Village 151 19 178 20 31 28 29 29 31
Income 1st quintile 75 11 103 13 20 12 17 19
2nd quintile 106 16 119 16 20 20 17 19
3rd quintile 74 11 85 11 20 13 13 14
4th quintile 122 18 137 18 20 17 13 14
5th quintile 291 44 320 42 20 38 30 33
Missing 111 14 136 15 6 8 10 10
Self-rated health
Very good 39 5 51 6 2 3 6 6
Good 267 34 305 34 25 33 32 32
Fair 397 51 449 50 39 52 47 47
Bad 66 8 79 9 8 11 13 13
Very Bad 10 1 13 1 1 1 1 1
Missing 0 0 3 0 0 0 1 1
Chronic
morbidity No 253 33 309 36 20 27 29 30
Yes 503 67 560 64 54 73 68 70
Missing 23 3 31 3 1 1 3 3
GALI Not limited 496 64 579 65 40 53 53 54
Limited but not severely 243 31 274 31 32 43 43 43
Severely limited 37 5 43 5 3 4 3 3
Missing 3 0 4 0 0 0 1 1
Exclusion PAM-13 NA items >3 - - 51 6 - - 2 2 All PAM-13 items „disagree
strongly” - - 18 2 - - 4 4
All PAM-13 items „agree strongly”
- - 23 3 - - 5 5
PAM-13 completion time < 52s - - 7 1 - - 0 0
Other reasons - - 22 2 - - 4 4
Excluded in first administration - - - - - - 10 10
Mean (±SD) PAM-13, eHEALS and NVS scores were 59.8 (±11.5), 28.7 (±5.1) and 3.9 (±1.7), respectively. The number (%) of patients with PAM levels 1,2,3 and 4 were 124 (15.9%), 143 (18.4%), 428 (54.9%) and 84 (10.8%), respectively. The health literacy was adequate for 491 (63.0%), possibly limited for 197 (25.3%), and probably limited for 91 (11.7%). Mean ( ±SD) LRI was 1.2 (±1.0), 0, 1,2 and ≥1 LRs were reported by 210 (27.0%), 275 (35.3%), 207 (26.6%) and 87 (11.2%) respondents. Mean (±SD) PBS was 0.45 (±0.25). According to the cutoff values for hypothesis testing, 466 (59.8%) respondents searched health-related information at least monthly, 171 (22.0%) participated in patient education over the past year, 443 (56.9%) performed health-related administration over the internet, 421 (54.0%) seeked health-related information at least bimonthly, 196 (25.2%) communicated online over past year about health with HCPs, helpers or peers, 280 (35.9%) engaged in online health
prevention activities 347 (44.5%) participated in online disease-management activities over the past year. Further details of the key variables are summarized in the [Electronic
Supplementary Material Sx.]
Classic test theory methods
We summarized the psychometric properties of PAM-13 along with the applied methods, target values, and results in Table 2. The distribution plots of PAM-13 are displayed in the [Electronic Supplementary Material Sx.] The results of known-groups hypothesis tests in multiple subgroups are summarized in the [Electronic Supplementary Material Sx].
Table 2. Summary of the results of classic test theory methods
Category Property Method Target Result Comment
General Distribution Skewness 0.00 0.22; p=0.01 Positive skew
Kurtosis 3.00 2.85; p=0.43 Normal kurtosis
Shapiro–Wilk test for normal
distribution p ≥0.05 p=0.049 Deviation from
normality Shapiro–Wilk test for log-
normal distribution p≥0.05 p=0.85 Log-normal
distribution Floor effect <15% 0.13% [0.0-0.7%]a No floor effect Ceiling effect <15% 1.3% [0.6-2.3%] No ceiling effect Reliability Internal
consistency
Cronbach alpha 0.7-0.95 0.766 Adequate
Test-retest
reliability ICCagreement >0.7 0.63 [0.47-0.75] Moderate weighted kappa* >0.7 0.48 [0.29-0.68] Moderate Standard error of
measurement (SEM)
- 7.21 -
Smallest detectable change
(SDC) - 20.0 -
Absolute agreement* - 49.3% - Validity Structural
validity Confirmatory factor analysis (CFA): adequate sample
- KMO
- Bartlett test ???
p<0.05 0.84 p<0.001
Adequate sampling
Confirmatory factor analysis (CFA): single factor
- RMSEA - CFI
- TLI <0.05
>0.90
>0.90
0.049 [0.041- 0.057]
0.94 0.95
Good fit
Convergent
validity PAM-13 – eHEALS Pearson
correlation r>0.3
p<0.05 r=0.43
p<0.001 Supported PAM levels – eHEALS
Polyserial correlation* r>0.3
p<0.05 r>0.44 p<0.001
Supported Discriminant
validity PAM-13 – age
Pearson correlation r<0.3
p≥0.05 r=-0.01
p=0.69 Supported
PAM-13 – education
polyserial correlation r <0.3
p≥0.05 r =0.03
p=0.46 Supported
PAM-13 – income quintiles
polyserial correlation r <0.3
p≥0.05 r =-0.03
p=0.47 Supported
Known groups
validity PAM-13 score difference
PBS ≥50% vs PBS <50% D>0.0
p<0.05 D=1.03
p=0.11 Not supported
PAM-13 score difference
LRI=0 vs LRI≥1 D>0.0
p<0.05 D=4.45 p<0.001
Supported PAM-13 score difference
LRI≤1 vs LRI≥2 D>0.0
p<0.05 D=5.14 p<0.001
Supported PAM-13 score difference
Health information seeking at least monthly vs less
D>0.0
p<0.05 D=2.76 p<0.001
Supported
PAM-13 score difference patient education over past year vs none
D>0.0
p<0.05 D=2.14 p=0.02
Supported
PAM-13 score difference online health information seeking at least bimonthly or less
D>0.0
p<0.05 D=1.0 p=0.12
Not supported
PAM-13 score difference online health-related communication past year vs none
D>0.0
p<0.05 D=1.77 p=0.03
Supported
PAM-13 score difference online health-prevention over past year vs none
D>0.0
p<0.05 D=1.79 p=0.02
Supported
PAM-13 score difference online disease management over past year vs none
D>0.0
p<0.05 D=1.65 p=0.02
Supported
Results refer to PAM-13 scores, with the exception of measures indicated with *, which refer to PAM levels. a 95% CI values are displayed in square brackets
Item-response theory methods FUNDING
The study was funded by the National Research, Development and Innovation Fund of Hungary (Project No. NKFIH-869-10/2019 , Tématerületi Kiválósági Program funding scheme).
References
1. WHO. Chronic diseases and health promotion. 2019 2019.09.01.]; Available from:
https://www.who.int/chp/about/integrated_cd/en/.
2. OECD, Fiscal Sustainability of Health Systems: Bridging Health and Finance Perspectives. 2015, Paris: OECD Publishing.
3. Institute of Medicine, Crossing the quality chasm: A new Health System for the 21 century. 2005, Washington, DC.
4. World Health Organization, WHO global strategy on people-centred and integrated health services - Interim report. 2015, WHO: Geneva.
5. WHO, Action plan for the prevention and control of noncommunicable diseases in the WHO European Region. 2016, Copenhagen: WHO Regional Office for Europe.
6. WHO, Healthy, prosperous lives for all: the European Health Equity Status Report.
2019, Copenhagen: World Health Organization Regional Office for Europe.
7. Bircher, J. and S. Kuruvilla, Defining health by addressing individual, social, and environmental determinants: new opportunities for health care and public health. J Public Health Policy, 2014. 35(3): p. 363-86.
8. Wallston, K.A., B.S. Wallston, and R. DeVellis, Development of the Multidimensional Health Locus of Control (MHLC) Scales. Health Educ Monogr, 1978. 6(2): p. 160-70.
9. Bandura, A., Self-efficacy: Toward a unifying theory of behavioral change.
Psychological Review, 1977. 84(2): p. 191-215.
10. Lorig, K., Self-management of chronic illness: a model for the future. Generations, 1993. 17(3): p. 11-14.
11. Prochaska, J., C. Redding, and K. Evers, The transtheorethical model model and stages of change, in Health Behaviour and Health Education Theory, Research and Practice 4th Edition, K. Glanz, B. Rimer, and K. Viswanath, Editors. 2008, Jossey-Bass:
San Francisco, CA.
12. Coleman, K., et al., Evidence on the Chronic Care Model in the new millennium.
Health Aff (Millwood), 2009. 28(1): p. 75-85.
13. Morton, K., et al., Using digital interventions for self-management of chronic physical health conditions: A meta-ethnography review of published studies. Patient Educ Couns, 2017. 100(4): p. 616-635.
14. NICE, Evidence standards framework for digital health technologies. 2019: London.
15. Hibbard, J.H., et al., Development of the Patient Activation Measure (PAM):
conceptualizing and measuring activation in patients and consumers. Health Serv Res, 2004. 39(4 Pt 1): p. 1005-26.
16. Insignia Health. The Science of the PAM survey. 2019; Available from:
https://www.insigniahealth.com/research/science.
17. Mosen, D., et al., Is Patient Activation Associated With Outcomes of Care for Adults With Chronic Conditions? Journal of Ambulatory Care Management, 2007. 30(1): p.
21-29.
18. Harvey, L., et al., When activation changes, what else changes? the relationship between change in patient activation measure (PAM) and employees' health status and health behaviors. Patient Educ Couns, 2012. 88(2): p. 338-43.
19. Graffigna, G., S. Barello, and A. Bonanomi, The role of Patient Health Engagement Model (PHE-model) in affecting patient activation and medication adherence: A structural equation model. PLoS One, 2017. 12(6): p. e0179865.
20. Remmers, C., et al., Is patient activation associated with future health outcomes and healthcare utilization among patients with diabetes? J Ambul Care Manage, 2009.
32(4): p. 320-7.
21. Aziz, A., R. Reynolds, and A. Ansari, PROCESS AND SYSTEMS: A population-based model of care for people with inflammatory bowel disease - patient-reported outcomes. Future Healthc J, 2019. 6(1): p. 30-35.
22. Schnock, K.O., et al., Acute Care Patient Portal Intervention: Portal Use and Patient Activation. J Med Internet Res, 2019. 21(7): p. e13336.
23. Carroll, J.K., et al., "Get Ready and Empowered About Treatment" (GREAT) Study: a Pragmatic Randomized Controlled Trial of Activation in Persons Living with HIV. J Gen Intern Med, 2019. 34(9): p. 1782-1789.
24. Korm. határozat az „Egészséges Magyarország 2014–2020” Egészségügyi Ágazati Stratégia 2017–2018 évekre vonatkozó cselekvési tervéről, in 1886/2016. (XII. 28.) 2017, Egészségügyi Közlöny LXVI. évfolyam 1. : Hungary.
25. KSH, Population census 2011. 2011, Hungarian Central Statistical Office: Online.
26. Skolasky, R.L., et al., Psychometric properties of the Patient Activation Measure among individuals presenting for elective lumbar spine surgery. Qual Life Res, 2009.
18(10): p. 1357-66.
27. Kosar, C. and D.B. Besen, Adaptation of a patient activation measure (PAM) into Turkish: reliability and validity test. Afr Health Sci, 2019. 19(1): p. 1811-1820.
28. Terwee, C.B., et al., Quality criteria were proposed for measurement properties of health status questionnaires. J Clin Epidemiol, 2007. 60(1): p. 34-42.
29. WHO. Process of translation and adaptation of instruments. na 4th Nov, 2019];
Available from:
https://www.who.int/substance_abuse/research_tools/translation/en/.
30. Hibbard, J.H., et al., Development and testing of a short form of the patient activation measure. Health Serv Res, 2005. 40(6 Pt 1): p. 1918-30.
31. Lindsay, A., et al., Patient Activation Changes as a Potential Signal for Changes in Health Care Costs: Cohort Study of US High-Cost Patients. J Gen Intern Med, 2018.
33(12): p. 2106-2112.
32. Zrubka, Z., et al., Psychometric properties of the Hungarian version of the eHealth Literacy Scale. Eur J Health Econ, 2019. 20(Suppl 1): p. 57-69.
33. Norman, C.D. and H.A. Skinner, eHEALS: The eHealth Literacy Scale. J Med Internet Res, 2006. 8(4): p. e27.
34. van der Vaart, R., et al., Does the eHealth Literacy Scale (eHEALS) measure what it intends to measure? Validation of a Dutch version of the eHEALS in two adult populations. J Med Internet Res, 2011. 13(4): p. e86.
35. Neter, E. and E. Brainin, Perceived and Performed eHealth Literacy: Survey and Simulated Performance Test. JMIR Hum Factors, 2017. 4(1): p. e2.
36. Weiss, B.D., et al., Quick assessment of literacy in primary care: the newest vital sign.
Ann Fam Med, 2005. 3(6): p. 514-22.
37. Koltai, J. and E. Kun, [The practical measurement of health literacy in Hungary and in international comparison]. Orv Hetil, 2016. 157(50): p. 2002-2006.
38. Mansfield, E.D., et al., Canadian adaptation of the Newest Vital Sign(c), a health literacy assessment tool. Public Health Nutr, 2018. 21(11): p. 2038-2045.
39. Herdman, M., et al., Development and preliminary testing of the new five-level version of EQ-5D (EQ-5D-5L). Qual Life Res, 2011. 20(10): p. 1727-36.
40. Rencz, F., et al., Pns401 the First Parallel Eq-5d-3l and Eq-5d-5l Composite Time Trade-Off Valuation Study in Europe. Value in Health, 2019. 22.
41. Cox, B., et al., The reliability of the Minimum European Health Module. Int J Public Health, 2009. 54(2): p. 55-60.
42. Parker, R.N. and R. Fenwick, The Pareto Curve and Its Utility for Open-Ended Income Distributions in Survey Research. Social Forces, 1983. 61(3).
43. European Central Bank Eurosystem. Euro foreign exchange reference rates. 2020 2020.04.01.]; Available from:
https://www.ecb.europa.eu/stats/policy_and_exchange_rates/euro_reference_exch ange_rates/html/eurofxref-graph-huf.en.html.
44. Veenhoven, R., Happiness in Nations: Overview of happiness surveys using Measure type: 112G / 11-step numeral Happiness, in World Database of Happiness. 1993, Erasmus University Rotterdam, Happiness Economics Research Organisation:
Rotterdam.
45. Al-Janabi, H., T.N. Flynn, and J. Coast, Development of a self-report measure of capability wellbeing for adults: the ICECAP-A. Qual Life Res, 2012. 21(1): p. 167-76.
46. Coast, J., et al., Valuing the ICECAP capability index for older people. Soc Sci Med, 2008. 67(5): p. 874-82.
47. Coast, J., et al., An assessment of the construct validity of the descriptive system for the ICECAP capability measure for older people. Qual Life Res, 2008. 17(7): p. 967-76.
48. Flynn, T.N., et al., Scoring the Icecap-a capability instrument. Estimation of a UK general population tariff. Health Econ, 2015. 24(3): p. 258-69.
49. Stein, C.J. and G.A. Colditz, Modifiable risk factors for cancer. Br J Cancer, 2004.
90(2): p. 299-303.
50. Lim, S.S., et al., Validation of a new predictive risk model: measuring the impact of the major modifiable risks of death for patients and populations. Popul Health Metr, 2015. 13: p. 27.
51. Ng, R., et al., Smoking, drinking, diet and physical activity-modifiable lifestyle risk factors and their associations with age to first chronic disease. Int J Epidemiol, 2020.
49(1): p. 113-130.
52. WHO, Global Status Report About Noncommunicable Diseases. 2014, Geneva: WHO.
53. McGorrian, C., et al., Estimating modifiable coronary heart disease risk in multiple regions of the world: the INTERHEART Modifiable Risk Score. Eur Heart J, 2011. 32(5):
p. 581-9.
54. Di Angelantonio, E., et al., Body-mass index and all-cause mortality: individual- participant-data meta-analysis of 239 prospective studies in four continents. The Lancet, 2016. 388(10046): p. 776-786.
55. Taghizadeh, N., J.M. Vonk, and H.M. Boezen, Lifetime Smoking History and Cause- Specific Mortality in a Cohort Study with 43 Years of Follow-Up. PLoS One, 2016.
11(4): p. e0153310.
56. Pirie, K., et al., The 21st century hazards of smoking and benefits of stopping: a prospective study of one million women in the UK. The Lancet, 2013. 381(9861): p.
133-141.
57. Stamatakis, E., et al., Sitting Time, Physical Activity, and Risk of Mortality in Adults. J Am Coll Cardiol, 2019. 73(16): p. 2062-2072.
58. Wang, X., et al., Fruit and vegetable consumption and mortality from all causes, cardiovascular disease, and cancer: systematic review and dose-response meta- analysis of prospective cohort studies. BMJ, 2014. 349: p. g4490.
59. Xi, B., et al., Relationship of Alcohol Consumption to All-Cause, Cardiovascular, and Cancer-Related Mortality in U.S. Adults. J Am Coll Cardiol, 2017. 70(8): p. 913-922.
60. NIAAA, NIAAA Newsletter in NIAAA Newsletter 2004, Office of Research Translation and Communications, NIAAA, NIH: Online. p. 3.
61. NM rendelet a kötelező egészségbiztosítás keretében igénybe vehető betegségek megelőzését és korai felismerését szolgáló egészségügyi szolgáltatásokról és a szűrővizsgálatok igazolásáról, in 51/1997. (XII. 18.) 1997, Magyar Közlöny 1997/114;
Publication date: 18/12/1997: Hungary.
62. A Nemzeti Népegészségügyi Központ módszertani levele a 2020. évi védőoltásokról.
2020, ÁNTSZ [National Public Health and Medical Officer Service]: Online.
63. Insignia Health, Best Practices for Analysing PAM data, Insignia Health, Editor., Insignia Health, : online.
64. Mokkink, L.B., et al., The COSMIN checklist for assessing the methodological quality of studies on measurement properties of health status measurement instruments: an international Delphi study. Qual Life Res, 2010. 19(4): p. 539-49.
65. Prinsen, C.A.C., et al., COSMIN guideline for systematic reviews of patient-reported outcome measures. Qual Life Res, 2018. 27(5): p. 1147-1157.
66. Terwee, C.B., et al., Rating the methodological quality in systematic reviews of studies on measurement properties: a scoring system for the COSMIN checklist. Qual Life Res, 2012. 21(4): p. 651-7.
67. Lim, C.R., et al., Floor and ceiling effects in the OHS: an analysis of the NHS PROMs data set. BMJ Open, 2015. 5(7): p. e007765.
68. McGraw, K.O. and S.P. Wong, Forming inferences about some intraclass correlation coefficients. Psychological Methods, 1996. 1(1): p. 30-46.
69. Rosseel, Y., lavaan: AnRPackage for Structural Equation Modeling. Journal of Statistical Software, 2012. 48(2).
70. Kaiser, H. and J. Rice, Little jiffy, mark IV. Educational and psychological measurement, 1974 34(1): p. 111-117.
Appendix 1.
13 kérdésből álló Beteg Aktivitás Kérdőívâ (PAM-13)
Az alábbiakban néhány olyan állítás szerepel, melyeket az emberek az egészségükkel kapcsolatosan szoktak mondani. Kérjük, jelölje be, hogy mennyire ért egyet - vagy nem ért egyet - azzal, hogy Önre jellemzőek ezek az állítások. Válaszai tükrözzék azt, amit önmagára nézve igaznak tart, és ne azt, amiről azt gondolja, hogy mások elvárnának Öntől.
Amelyik állítás nem alkalmazható Önre, annál jelölje meg a “nem jellemző” lehetőséget.
1 Összességében az én felelősségem, hogy vigyázzak a saját egészségemre
Egyáltalán nem értek egyet
Inkább nem
értek egyet Inkább
egyetértek Teljesen
egyetértek Nem
jellemző
2 Az egészségemet leginkább az befolyásolja, hogy aktívan foglalkozom vele.
Egyáltalán nem értek egyet
Inkább nem
értek egyet Inkább
egyetértek Teljesen
egyetértek Nem
jellemző
3 Biztos vagyok benne, hogy tudok segíteni az egészségemmel kapcsolatos problémák megelőzésében vagy csökkentésében.
Egyáltalán nem értek egyet
Inkább nem
értek egyet Inkább
egyetértek Teljesen
egyetértek Nem
jellemző
4 Minden felírt gyógyszeremről tudom, hogy mi a hatása.
Egyáltalán nem értek egyet
Inkább nem
értek egyet Inkább
egyetértek Teljesen
egyetértek Nem
jellemző
5 Biztos vagyok benne, hogy meg tudom állapítani, hogy egy egészségi problémával orvoshoz kell fordulnom, vagy magam is meg tudom azt oldani.
Egyáltalán nem értek egyet
Inkább nem
értek egyet Inkább
egyetértek Teljesen
egyetértek Nem
jellemző
6 Biztos vagyok benne, hogy el tudom mondani az orvosnak az aggályaimat akkor is, ha ő nem kérdezi.
Egyáltalán nem értek egyet
Inkább nem
értek egyet Inkább
egyetértek Teljesen
egyetértek Nem
jellemző
7 Biztos vagyok benne, hogy ha szükségem van rá, el tudom végezni az otthonra előírt kezeléseket.
Egyáltalán nem értek egyet
Inkább nem
értek egyet Inkább
egyetértek Teljesen
egyetértek Nem
jellemző
8 Értem az egészségi problémáimat és azok lehetséges kiváltó okait.
Egyáltalán nem értek egyet
Inkább nem
értek egyet Inkább
egyetértek Teljesen
egyetértek Nem
jellemző
9 Tudom, hogy egészségi problémáimra milyen kezelési lehetőségek állnak rendelkezésre.
Egyáltalán nem értek egyet
Inkább nem
értek egyet Inkább
egyetértek Teljesen
egyetértek Nem
jellemző
10 Kitartó tudtam maradni, amikor életmódot
változtattam (pl. helyes táplálkozás vagy testmozgás).
Egyáltalán nem értek egyet
Inkább nem
értek egyet Inkább
egyetértek Teljesen
egyetértek Nem
jellemző
11 Tudom, hogyan előzzem meg az egészségi problémáimat.
Egyáltalán nem értek egyet
Inkább nem
értek egyet Inkább
egyetértek Teljesen
egyetértek Nem
jellemző
12 Biztos vagyok benne, hogy találok megoldást, ha új egészségi problémáim merülnek fel.
Egyáltalán nem értek egyet
Inkább nem
értek egyet Inkább
egyetértek Teljesen
egyetértek Nem
jellemző 13 Biztos vagyok benne, hogy ha életmódot változtatok
(pl. helyes táplálkozás vagy testmozgás), akkor még stresszes időszakokban is kitartó tudok maradni.
Egyáltalán nem értek egyet
Inkább nem
értek egyet Inkább
egyetértek Teljesen
egyetértek Nem
jellemző
Insignia Health, LLC®. Patient Activation Measure © 2003-2020 University of Oregon.
Minden jog fenntartva.
Bizalmas. Csak érvényes PAM® Licencmegállapodás mellett használható.
Az engedélyezésért lépjen kapcsolatba az Insignia Health-szel az info@insigniahealth.com e-mail címen
Distribution of PAM-13 scores. A) Quantile-plot vs normal distribution, B) histogram with kernel-density plot (dashed line) and normal curve (solid line)
20 40 60 80 100
PAM score
20 40 60 80 100
Inverse Normal
A
0 .01 .02 .03 .04
Density
20 40 60 80 100
PAM score
B
Subgroups
Variable Category Total Male Female
No chronic disease
Chronic disease
<65 years old
≥65 years old
2-5th Income quintile
1st Income quintile
Adequate healht literacy
Not adequate health literacy
Preventive behaviours PBS≥50% 60.35 58.94 61.44 63.35 59.45 60.87 60.31 60.36 60.14 59.69 61.57
PBS <50% 59.32 58.32 60.25 61.44 58.48 58.84 59.68 59.33 59.27 58.87 60.04
p value 0.107 0.301 0.148 0.092 0.178 0.026 0.328 0.113 0.39 0.211 0.135
Lifestyle risks LRI=0 63.07 62.59 63.39 63.91 63.18 64.11 61.45 62.88 65.19 62.46 64.16
LRI≥1 58.62 57.4 59.76 61.29 57.77 58.17 59.38 58.71 57.81 58.09 59.52
p value <0.001 <0.001 0.002 0.04 <0.001 <0.001 0.099 <0.001 0.013 <0.001 0.002
LRI≤1 61.76 60.1 62.98 63.3 61.31 62.43 60.76 61.67 62.67 61.1 62.92
LRI≥2 56.62 56.61 56.64 59.52 55.76 55.67 58.41 56.84 54.68 56.19 57.33
p value <0.001 0.002 <0.001 0.005 <0.001 <0.001 0.048 <0.001 0.007 <0.001 <0.001
Health information
seeking At least montly 60.93 60.42 61.27 63.21 60.37 61.22 60.48 60.89 61.28 60.01 62.46
Less often than monthly 58.17 56.69 60.03 60.95 56.78 57.65 59.1 58.38 55.23 58.22 58.1
p value 0.001 0.001 0.157 0.053 <0.001 <0.001 0.162 0.002 0.042 0.041 0.001
Patient education Over past year 61.49 59.37 62.73 65.02 60.72 61.98 60.63 61.33 62.8 60.95 62.31
None 59.35 58.44 60.21 61.71 58.4 59.09 59.78 59.44 58.49 58.84 60.26
p value 0.019 0.286 0.029 0.053 0.028 0.012 0.31 0.038 0.131 0.049 0.118
Online healht
information seeking At least bimonthly 60.28 59.50 61.00 63.83 59.23 60.55 60.12 60.28 60.31 59.46 61.8
Less often than bimonthly 59.29 57.86 60.77 60.89 58.68 58.73 59.8 59.35 58.61 59.05 59.65
p value 0.116 0.082 0.422 0.016 0.30 0.04 0.408 0.141 0.293 0.345 0.062
Online health-related
communication Over past year 61.15 60.49 61.56 63.58 60.72 61.18 61.11 61.15 61.17 60.83 61.56
None 59.38 58.11 60.57 61.89 58.29 59.3 59.5 59.41 59.08 58.84 60.4
p value 0.031 0.048 0.218 0.173 0.016 0.059 0.149 0.039 0.269 0.049 0.225
Online health
prevention activity Over past year 60.97 59.93 61.6 62.51 60.7 61.59 59.99 60.77 62.94 60.34 61.76
None 59.18 58.05 60.33 61.99 58.08 58.73 59.93 59.33 57.8 58.79 59.98
p value 0.018 0.066 0.137 0.356 0.007 0.004 0.484 0.051 0.06 0.077 0.102
Online disease
management activity Over past year 60.74 59.06 61.74 63.71 60.12 61.65 60.38 60.52 62.56 60.00 61.86
None 59.09 58.35 59.92 61.35 57.94 58.43 59.54 59.32 56.69 58.75 59.72
p value 0.024 0.275 0.056 0.05 0.017 0.001 0.27 0.082 0.025 0.116 0.063
N 779 358 421 253 503 483 296 704 75 491 288