https://doi.org/10.1007/s11136-020-02542-1
Capability of well‑being: validation of the Hungarian version of the ICECAP‑A and ICECAP‑O questionnaires and population normative data
Petra Baji1 · Miklós Farkas2 · Ágota Dobos3 · Zsombor Zrubka1 · László Gulácsi1 · Valentin Brodszky1 · Fanni Rencz1,4 · Márta Péntek1
Accepted: 21 May 2020 / Published online: 28 May 2020
© The Author(s) 2020
Abstract
Purpose We aimed to develop and assess the psychometric characteristics of the Hungarian language version of two well- being capability measures, the ICEpop CAPability measure for Adults/Older people (ICECAP-A/-O), and to establish population norms.
Methods A cross-sectional survey was performed involving a representative sample of the Hungarian population. Socio- demographic characteristics, the use and provision of informal care were recorded. The Minimum European Health Module (MEHM), EQ-5D-5L, WHO-5 well-being index, happiness and life satisfaction visual analogue scale (VAS), Satisfaction with Life Scale (SWLS) measures were applied alongside the ICECAP-A (age-group 18–64) and ICECAP-O (age-group 65+).
Results Altogether 1568 and 453 individuals completed the ICECAP-A/-O questionnaires, respectively. Cronbach’s alpha was 0.86 for both measures (internal consistency). Subgroup analyses showed positive associations between ICECAP-A/-O scores and marital status, employment, income, health status (MEHM) and informal care use (construct validity). Pearson correlations were strong (r > 0.5; p < 0.01) between ICECAP-A/-O indexes and EQ-5D-5L, WHO-5, happiness and satis- faction VAS and SWLS scores (convergent validity). The age, education, and marital status were no longer significant in the multiple regression analysis. Test–retest average (SD) scores were 0.88 (0.11) and 0.89 (0.10) for the ICECAP-A, and equally 0.86 (0.09) for the ICECAP-O (reliability).
Conclusion This is the first study to provide ICECAP-A/-O population norms. Also, it is the first to explore associations with WHO-5 well-being index which, alongside the MEHM measures, enable estimates from routinely collected international health statistics. The Hungarian ICECAP-A/-O proved to be valid and reliable measurement tools. Socio-demographic charac- teristics had minor or no impact on ICECAP-A/-O. Other influencing factors deserve further investigation in future research.
Keywords Capability · ICECAP-A · ICECAP-O · Validation · Psychometrics · Reliability
Introduction
Ageing of the populations and the increasing prevalence of chronic diseases in Europe poses significant burden on the health and social care systems [1]. The economic evaluation of informal and social care interventions, as well as their contribution to societal welfare, have received increased attention in the past years [2, 3]. In current health economic analyses and guidelines, the health-related quality of life (HRQoL) outcomes are used and recommended as golden standard. However, there is a growing interest in new emerg- ing measures, which capture wider concept of well-being [4].
Electronic supplementary material The online version of this article (https ://doi.org/10.1007/s1113 6-020-02542 -1) contains supplementary material, which is available to authorized users.
* Márta Péntek
marta.pentek@uni-corvinus.hu
1 Department of Health Economics, Corvinus University of Budapest, 8 Fővám tér, Budapest 1093, Hungary
2 Department of Accounting and Finance, University of Bristol, Bristol, UK
3 Corvinus Center for Foreign Language Education and Research, Corvinus University of Budapest, Budapest, Hungary
4 Hungarian Academy of Sciences, Premium Postdoctoral Research Programme, Budapest, Hungary
ICECpop CAPability (ICECAP) measures have been developed to be used in economic evaluations to capture aspects of well-being beyond health and HRQoL. The ICECAP measures are based on Amartya Sen’s capabil- ity approach which defines well-being in terms of an indi- vidual’s ability and capability to ‘do’ certain things that are important in life [5]. The ICECAP-A instrument has been developed for use among the general adult population (18 years and older) [6], while the ICECAP-O instrument addresses important aspects of life of the older population (65 years and over) [7]. Helter et al. identified 14 capability instruments, but only the ICECAP-A, ICECAP-O and the Adult Social Care Outcomes Toolkit (ASCOT) instruments reported both psychometric properties and valuation studies reflecting the preferences (utility) of the general public [8].
The use of ICECAP instruments is evolving in economic evaluations. A recent systematic review by Proud et al. iden- tified 22 studies where the ICECAP-O measure was applied in economic evaluations [9]. On the regulatory level, the National Institute for Health and Care Excellence (NICE) recommends the use of ICECAP-O for measuring the impact of social care interventions, while in the Netherlands, ICE- CAP-O is recommended to be used for evaluations of long- term conditions [10, 11].
Several studies assessed the validity of the ICECAP measures [8, 9], however most of the literature focuses on the UK, where the measures were originally developed [12–14], and on other English speaking countries, such as Australia [15, 16] and Canada [17, 18]. Other language versions of the ICECAP-O instrument have been developed and vali- dated in Dutch [19], German [20], Spanish [21] and Swed- ish [22]. ICECAP-A has been validated in Chinese [23] and in German [11]. Nevertheless, no language versions have been available so far for the Central and Eastern European countries. Moreover, all ICECAP-A/-O studies (except an ICECAP-O study in Australia [16]) involved either specific samples (e.g. patient groups or informal caregivers), or could achieve only partial representativeness in population-based samples due to online recruitment, relatively small sample size or higher response rates in specific groups [13, 14, 24].
In European countries no population norms have been estab- lished that are based on a large sample, and can be consid- ered representative along key demographic characteristics.
The primary aim of our study was, therefore, to develop the Hungarian versions of the ICECAP-A and ICECAP-O instruments, assess their construct validity, and test–retest their reliability among the Hungarian general population.
Secondarily, we aimed to establish population normative data with both measures.
Methods
The surveyWe designed and conducted a large population health sur- vey in Hungary (year 2019) and developed the Hungarian version of the ICECAP-A and -O as part of this research.
Computer-assisted personal interviews were conducted among the Hungarian adult general population (N = 2023).
The recruitment of the respondents and the interviews were carried out by a subcontractor (New Land Media Kft., Survey Company). Quotas were applied based on the number and composition of the population (National Cen- tral Statistical Office) to obtain a representative sample in terms of age, gender and residence [25]. Ethical approval was obtained from the Hungarian Medical Research Coun- cil (no. 10058-3/2019/EKU). Respondents were informed that the participation in the survey was voluntary, the data would remain anonymous, impersonal and would be used solely for scientific purposes. Respondents needed to give their informed consent before the start of the survey.
In this paper our focus is on the ICECAP-A/-O results, but the survey covered five major modules: (1) socio- demographics (such as age, gender, education, marital status, employment status, household size, monthly net household income, place of residence) (2) health (3) well- being, happiness and satisfaction with life (4) major life events in the last 12 months and (5) experience with infor- mal care either as a current caregiver (for the last 2 weeks) or recipient (in the past 3 months). A detailed definition of informal care was provided for the respondents. In brief, informal care was determined as a non-paid support or care, provided for family members or acquaintances in need of help due to health problems or ageing. The applied measurement tools introduced in the next sections were presented in the same order to each respondent. For the ICECAP-A, ICECAP-O and EQ-5D-5L questionnaires, we used self-completed paper based versions, and the data were recorded into the electronic database.
The instruments
The ICECAP‑A and ICECAP‑O and the development of their Hungarian versions
The ICECAP-A (for age group 18+) and ICECAP-O (for age group 65+) are preference-based measures of well- being capabilities, developed for use in economic evalu- ations [6, 7, 12]. Both measures cover five domains of well-being. The ICECAP-A items are (1) Attachment (an ability to have love, friendship and support); (2) Stability
(an ability to feel settled and secure); (3) Achievement (an ability to achieve and progress in life); (4) Enjoyment (an ability to experience enjoyment and pleasure) and (5) Autonomy (an ability to be independent). The ICECAP-O items are the following: (1) Attachment (love and friend- ship); (2) Security (thinking about the future without concern); (3) Role (doing things that make you feel val- ued); (4) Enjoyment (enjoyment and pleasure); (5) Con- trol (independence). A 4-level response scale is applied for each item and respondents are asked to indicate the one that best describes their overall quality of life at the moment. Scores range from 0, which represents ‘no capa- bility’ to 1, which represents ‘full capability’ based on the tariff sets for the instruments developed using best–worst scaling methods [26, 27]. Tariffs are currently available only for the UK population, so we used those to calculate index scores. In this study, ICECAP-A scores were cal- culated for respondents below the age of 65 (< 65) and ICECAP-O scores for respondents (65+).
The Hungarian language versions of the ICECAP-A and ICECAP-O questionnaires were developed in accordance with available guidance on the topic [28]. In brief, independ- ent forward- and back-translations were undertaken. Differ- ences were discussed among the investigators and they were reviewed by the copyright owner of the original English ICECAP measures. With the final versions, semi-structured interviews (N = 10) were conducted with the aim to assess the comprehensiveness and the relevance of the content.
Minimum European Health Module (MEHM)
The MEHM health status measure consists of three general questions characterizing three different concepts of health:
(1) self-perceived health in general (very good/good/fair/
bad/very bad); (2) long-standing illness (3) long-standing activity limitations due to health problems measured via the Global Activity Limitation Indicator (GALI) (severely lim- ited/limited but not severely/not limited at all) [29].
The EQ‑5D‑5L
The EQ-5D-5L is a generic health status measure which dis- tinguishes between five health domains, i.e. Mobility, Self- care, Usual activities, Pain/discomfort, Anxiety/depression [30]. Respondents are asked to indicate the problem level (1—no, 2—slight, 3—moderate, 4—severe and 5—unable/
extreme problems) that best describes their health ‘today’.
Due to the lack of country-specific value set for Hungary [31], we used the tariffs for England in our study (value range: − 0.285 to 1) to calculate EQ-5D-5L index score [32].
In the second part of the questionnaire respondents are asked to value their health that day on a EQ VAS, a vertical 0–100
visual analogue scale (0—worst, 100—best health state the respondent can imagine).
World Health Organization‑Five Well‑Being Index (WHO‑5) The WHO-5 is a short self-reported measure of mental well- being [33, 34]. It consists of five statements, which respond- ents rate in relation to the past 2 weeks on a 6-point Likert- scale (0—“at no time”; 5—“all of the time”) answer. The WHO-5 index is calculated by summing up the scores which is multiplied by 4 to give the final score between 0 and 100.
Happiness and satisfaction with life visual analogue scales (VAS)
We used 0–10 VAS to measure respondents’ current happi- ness and satisfaction with life (0—completely unhappy/not satisfied at all; 10—completely happy/completely satisfied).
The Satisfaction with Life Scale (SWLS)
The SWLS is a five-item instrument, designed to measure global cognitive judgments of satisfaction with one’s life [35, 36]. Respondents are asked to indicate their agreement with each of the five statements on a seven-point Likert- scale (1—“Strongly disagree”, 7—“Strongly agree”). The index is the summary of the scores, ranging from 5 to 35 with a score of 20 representing a neutral point on the scale (5–9: extremely dissatisfied; 31–35: extremely satisfied.) Statistical analysis
The psychometric properties of the ICECAP-A and ICE- CAP-O instruments were evaluated in relation to socio- demographic characteristics, health status, major life events and health-related quality of life (EQ-5D-5L) as well as well-being measures (WHO-5, happiness and satisfaction VAS, SWLS).
We used the terminology from the COnsensus-based Standards for the selection of health status Measurement INstruments (COSMIN) taxonomy to describe validity while investigating psychometric properties of the instru- ment [37]. We investigated internal consistency, construct validity (hypothesis testing, including convergent validity) and reliability (and test–retest reliability).
To assess the internal consistency, Cronbach’s alphas were calculated [38]. Alpha ranges from 0 to 1 (0.7–0.8:
acceptable, 0.8–0.9: good > 0.9: excellent internal consist- ency) [39].
Construct validity was assessed via one-way subgroup comparisons and by multiple regression analysis. We investi- gated whether the ICECAP-A/ICECAP-O scores can differ- entiate between groups hypothesized to differ in their levels
of the construct capability-well-being, i.e. among different socio-demographic characteristics, health status and major life events. Subgroup comparisons were carried out by one- way ANOVA tests, associations were also explored by OLS multiple regression analysis. Based on previous literature [9, 11, 12, 14], we expected positive association with the following variables: being married/living with a partner, having higher income, being employed/having a paid job, living with others. A positive relationship was also expected between ICECAP-A/ICECAP-O scores and better health. On the other hand, we expected no association with gender, and no or negative association with age. We also investigated if capabilities differed by informal caregiving situation. Coast et al. found positive but not significant relationship [12, 13].
To assess convergent validity, Pearson’s correlation coefficients were calculated between ICECAP-A/ ICECAP- O scores and related measures of health-related quality of life and well-being (EQ-5D-5L index, EQ VAS, WHO-5, happiness and satisfaction VAS, SWLS) and Spearman’s rho correlations between domains of these measures. Cor- relations were considered strong if the coefficient was over 0.5, moderate between 0.3 and 0.5 and weak under 0.3 [40].
Based on previous literature we expected moderate / strong correlation with the EQ-5D-5L and SWLS measures [11].
Positive association between ICECAP scores and WHO-5 scores were also assumed.
To assess the test–retest reliability of the ICECAP-O and ICECAP-A scores, 5% of the respondents were asked to par- ticipate in a follow up measurement right after the interview.
For each questionnaire item, we calculated the percentage of agreement on each item. We calculated intra-class cor- relation coefficients (ICC), using a two-way mixed model of absolute agreement. The ICC can range from 0.00 (no stability/agreement) to 1.00 (perfect agreement). Based on Koo et al. [41], agreement is considered poor for ICC values below 0.5, moderate between 0.50 and 0.749, good between 0.750 and 0.900 and excellent above 0.90.
In all types of analysis, a 5% significance level was applied. All analyses were undertaken using Stata version 13.
Results
The sampleThe sample size was 2023 respondents (50.1% women) with the average age of 48.7 years (SD = 17.9). All but two respondents answered all questions on the ICECAP-A instru- ment (n = 1568), and all respondents aged 65+ answered all questions on the ICECAP-O (n = 453). Socio-demographic characteristics, health status (MEHM) and informal care experience of the sample are presented in Tables 1 and 2,
respectively. Summary statistics for the standard health sta- tus and well-being measures are provided in Table 3.
Population norms for the ICECAP‑A and ICECAP‑O The mean ICECAP-A and ICECAP-O scores were 0.89 (SD = 0.13) and 0.83 (SD = 0.15), and the distribution of scores are presented in Figs. 1 and 2, respectively. Distribu- tion of answers on the ICECAP-A and ICECAP-O items are presented in Online Resource 1. The modal response of the ICECAP-A was the top level (level 4) of capability across all domains but Achievement, where the most common answer was the second best level (level 3: 44.6%), followed by the top level (level 4: 43.4%). For the ICECAP-O, the modal answer was the second best level (level 3) across each of the five domains.
Average ICECAP-A and -O scores of subgroups by socio- demographic characteristics are provided in Table 1. In the one-way ANOVA analysis, significant differences were found in both ICECAP-A and ICECAP-O scores by age cat- egory, education level, employment status (only ICECAP- A), marital status, if the respondent was living with some- one, income quintiles (Table 1) and by all health indicators (Table 2). Furthermore, ICECAP scores were significantly lower if the respondent was an informal care recipient. No significant differences were observed by gender, settlement type, or if the respondent was an informal caregiver on either of the two instruments. Nonetheless, age, education and marital status variables were no longer significant in the multiple regression analysis (Online Resource 2). Also, employment (having a paid job) and income level were sig- nificant determinants only for the ICECAP-A instrument.
Furthermore, regression results show that respondents liv- ing in the capital had significantly lower ICECAP-A scores.
Construct validity and internal consistency
The differences found between subgroups as detailed in the section above support the good construct validity of the instruments. In addition, both ICECAP-A and ICECAP- O scores were significantly lower if some of the major life events happened to the respondents in the last 12 months (Online Resource 3), i.e. Death of a close relative or friend;
Serious financial worries or debts; Problems with parents or close relatives; Other serious illness to the respondent.
ICECAP-A scores were also lower if the wage earner in the household lost their job; in the case of problems at work and in the case of a serious accident or injury to the respondent.
While ICECAP-O scores were significantly lower if prob- lems were reported with children.
Cronbach’s alpha was 0.863 for the ICECAP-A and 0.864 for the ICECAP-O instrument, indicating good internal consistency.
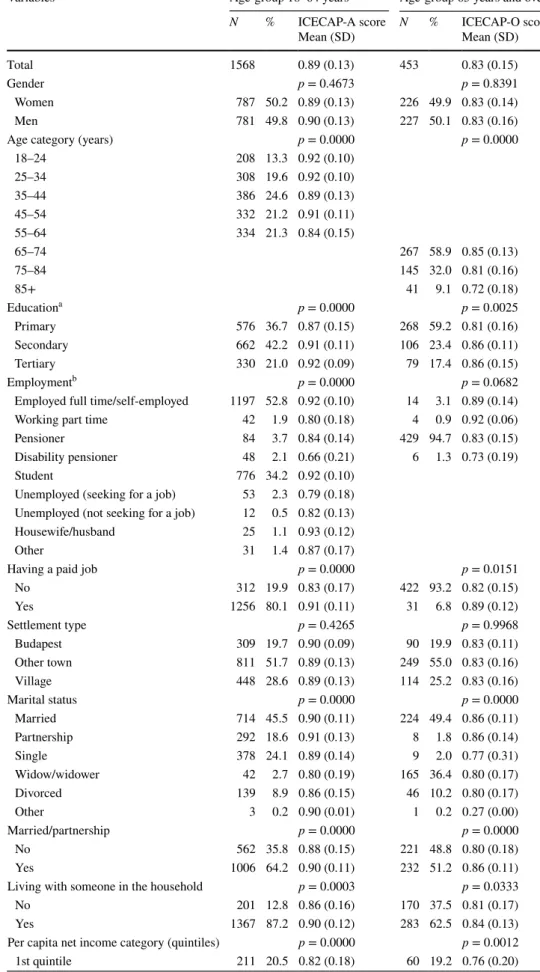
Table 1 Sample characteristics and population norms for the ICECAP-A and ICACAP-O scores by socio-demographic groups of the sample
Variables Age-group 18–64 years Age-group 65 years and over
N % ICECAP-A score
Mean (SD) N % ICECAP-O score
Mean (SD)
Total 1568 0.89 (0.13) 453 0.83 (0.15)
Gender p = 0.4673 p = 0.8391
Women 787 50.2 0.89 (0.13) 226 49.9 0.83 (0.14)
Men 781 49.8 0.90 (0.13) 227 50.1 0.83 (0.16)
Age category (years) p = 0.0000 p = 0.0000
18–24 208 13.3 0.92 (0.10)
25–34 308 19.6 0.92 (0.10)
35–44 386 24.6 0.89 (0.13)
45–54 332 21.2 0.91 (0.11)
55–64 334 21.3 0.84 (0.15)
65–74 267 58.9 0.85 (0.13)
75–84 145 32.0 0.81 (0.16)
85+ 41 9.1 0.72 (0.18)
Educationa p = 0.0000 p = 0.0025
Primary 576 36.7 0.87 (0.15) 268 59.2 0.81 (0.16)
Secondary 662 42.2 0.91 (0.11) 106 23.4 0.86 (0.11)
Tertiary 330 21.0 0.92 (0.09) 79 17.4 0.86 (0.15)
Employmentb p = 0.0000 p = 0.0682
Employed full time/self-employed 1197 52.8 0.92 (0.10) 14 3.1 0.89 (0.14)
Working part time 42 1.9 0.80 (0.18) 4 0.9 0.92 (0.06)
Pensioner 84 3.7 0.84 (0.14) 429 94.7 0.83 (0.15)
Disability pensioner 48 2.1 0.66 (0.21) 6 1.3 0.73 (0.19)
Student 776 34.2 0.92 (0.10)
Unemployed (seeking for a job) 53 2.3 0.79 (0.18) Unemployed (not seeking for a job) 12 0.5 0.82 (0.13)
Housewife/husband 25 1.1 0.93 (0.12)
Other 31 1.4 0.87 (0.17)
Having a paid job p = 0.0000 p = 0.0151
No 312 19.9 0.83 (0.17) 422 93.2 0.82 (0.15)
Yes 1256 80.1 0.91 (0.11) 31 6.8 0.89 (0.12)
Settlement type p = 0.4265 p = 0.9968
Budapest 309 19.7 0.90 (0.09) 90 19.9 0.83 (0.11)
Other town 811 51.7 0.89 (0.13) 249 55.0 0.83 (0.16)
Village 448 28.6 0.89 (0.13) 114 25.2 0.83 (0.16)
Marital status p = 0.0000 p = 0.0000
Married 714 45.5 0.90 (0.11) 224 49.4 0.86 (0.11)
Partnership 292 18.6 0.91 (0.13) 8 1.8 0.86 (0.14)
Single 378 24.1 0.89 (0.14) 9 2.0 0.77 (0.31)
Widow/widower 42 2.7 0.80 (0.19) 165 36.4 0.80 (0.17)
Divorced 139 8.9 0.86 (0.15) 46 10.2 0.80 (0.17)
Other 3 0.2 0.90 (0.01) 1 0.2 0.27 (0.00)
Married/partnership p = 0.0000 p = 0.0000
No 562 35.8 0.88 (0.15) 221 48.8 0.80 (0.18)
Yes 1006 64.2 0.90 (0.11) 232 51.2 0.86 (0.11)
Living with someone in the household p = 0.0003 p = 0.0333
No 201 12.8 0.86 (0.16) 170 37.5 0.81 (0.17)
Yes 1367 87.2 0.90 (0.12) 283 62.5 0.84 (0.13)
Per capita net income category (quintiles) p = 0.0000 p = 0.0012
1st quintile 211 20.5 0.82 (0.18) 60 19.2 0.76 (0.20)
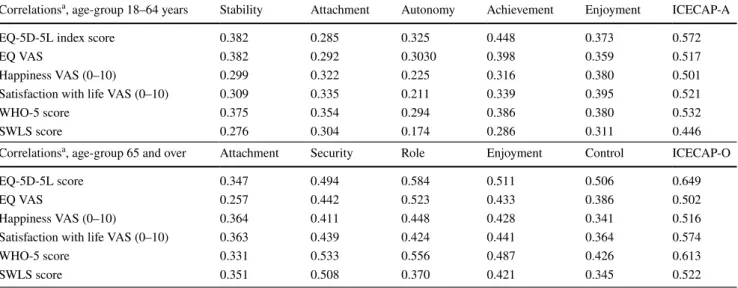
Convergent validity Correlation between indexes
Correlation coefficients between the ICECAP-A/-O scores, domains and the other standard measures are presented in Table 4. We observed strong correlation of the ICECAP measures with EQ-5D-5L index, EQ VAS, WHO-5 score, happiness and satisfaction with life VAS; moderate/strong correlation with SWLS score. Four ICECAP-A items had
moderate correlations with all the indexes, while Autonomy had only weak to moderate correlation. Correlation coef- ficients were slightly higher for the ICECAP-O instrument (Table 4).
Correlations between the domains of ICECAP‑A/‑O and other measures (EQ‑5D‑5L, WHO‑5, SWLS)
Correlation analysis between the ICECAP measures and EQ-5D-5L domains are provided in Online Resource 4.
ANOVA tests were applied
a Primary: no matriculation in high school; secondary: high school with matriculation; tertiary: professional training with diploma in higher education, BSc, MSc or PhD diploma
b In case of multiple employments (e.g. student and employed), respondents were asked to indicate the employment status that was the most characteristic for them
Table 1 (continued) Variables Age-group 18–64 years Age-group 65 years and over
N % ICECAP-A score
Mean (SD) N % ICECAP-O score
Mean (SD)
2nd quintile 250 24.2 0.89 (0.12) 77 24.7 0.85 (0.11)
3rd quintile 206 20.0 0.90 (0.11) 106 34.0 0.82 (0.16)
4th quintile 183 17.7 0.91 (0.10) 49 15.7 0.87 (0.10)
5th quintile 181 17.6 0.93 (0.09) 20 6.4 0.87 (0.10)
Table 2 ICECAP-A (age: < 65) and ICECAP-O (age: 65 and over) scores by health status
ANOVA tests were applied
Variables Age-group 18–64 years Age-group 65 years and over
N % ICECAP-A score
Mean (SD) N % ICECAP-O
Mean (SD)
Self-reported health p = 0.0000 p = 0.0000
Poor 24 1.5 0.63 (0.2) 44 9.7 0.65 (0.2)
Fair 155 9.9 0.74 (0.18) 207 45.7 0.8 (0.14)
Good 585 37.3 0.89 (0.11) 166 36.6 0.88 (0.11)
Very good 461 29.4 0.93 (0.08) 28 6.2 0.94 (0.07)
Excellent 343 21.9 0.95 (0.09) 8 1.8 0.97 (0.04)
Long standing illness p = 0.0000 p = 0.0000
No 1235 78.9 0.92 (0.1) 145 32.3 0.9 (0.09)
Yes 330 21.1 0.8 (0.17) 304 67.7 0.8 (0.16)
Global activity limitation
indicator (GALI) p = 0.0000 p = 0.0000
Severly limited 21 1.3 0.63 (0.21) 44 9.7 0.64 (0.22)
Limited, but not severly 153 9.8 0.74 (0.18) 176 38.9 0.79 (0.14)
Not limited 1393 88.9 0.92 (0.10) 232 51.3 0.89 (0.09)
Informal caregiver p = 0.6068 p = 0.8409
Yes 66 4.2 0.90 (0.13) 15 3.3 0.82 (0.14)
No 1502 95.8 0.89 (0.12) 438 96.7 0.83 (0.15)
Informal care recipient p = 0.0000 p = 0.0000
No 1496 95.9 0.9 (0.12) 343 76.2 0.86 (0.13)
No, but would need 7 0.4 0.69 (0.23) 6 1.3 0.69 (0.22)
Yes 57 3.7 0.76 (0.17) 101 22.4 0.74 (0.17)
Correlation of the ICECAP-A score was the strongest with the Pain/discomfort EQ-5D-5L domain (r = − 0.534) and lowest with the Self-care domain (r = − 0.389). Correlation of the ICECAP-O score was the strongest with the Usual activities domain (r = − 0.572). Correlation between the ICECAP-A items and the EQ-5D-5L domains were mod- erate/weak, whilst between the ICECAP-O items and the EQ-5D-5L domains were weak to strong.
For both the ICECAP-A and ICECAP-O scores, the strongest correlations were observed with the WHO-5 state- ment “I have felt cheerful and in good spirits.” (r = 0.498 and 0.550) (Online Resource 5). Nevertheless, ICECAP-O score had strong correlation with all the WHO-5 statements, except for the one “I woke up feeling fresh and rested.”
(r = 0.446). Correlation coefficient with ICECAP-A score was also the lowest for this statement (r = 0.377). Weak to moderate correlations were observed between the WHO-5 domains and the ICECAP-A items, whilst weak to strong correlations with the ICECAP-O items.
Regarding SWLS (Online Resource 6), both the ICECAP- A and the ICECAP-O had the strongest correlation with the statement “In most ways my life is close to my ideal.”
(r = 0.441 and r = 0.540). Correlations between the SWLS domains and the ICECAP-A items were weak to moderate, and weak to strong with the ICECAP-O items.
Test–retest reliability
Among the 63 respondents aged < 65 years and 55 respond- ents aged 65+ who participated in the follow-up interview, 62 and 53 respondents answered all the 5 questions of the ICECAP-A and ICECAP-O questionnaires, respectively in both interviews. The average of ICECAP-A score was 0.88 (SD = 0.11) on the original interview and 0.89 (SD = 0.10) on the follow-up. Mean ICECAP-O scores were 0.86 (SD = 0.09) for both occasions. Test–retest ratings were
Table 3 Sample summary statistics for age, EQ-5D-5L, EQ VAS, ICECAP-A, ICECAP-O, happiness and satisfaction
NA not applicable
a Calculated with value set for England [32]
Total Age-group 18–64 years Age-group 65 years and over
N Mean SD N Mean SD N Mean SD
Age, years 2023 48.72 17.88 1570 41.62 13.15 453 73.32 7.01
ICECAP-A (0–1) 1568 0.89 0.13 1568 0.89 0.13 NA NA NA
ICECAP-O (0–1) 453 0.83 0.15 NA NA NA 453 0.83 0.15
EQ-5D-5La (− 0.285 to 1) 2020 0.92 0.15 1567 0.95 0.12 453 0.80 0.20
EQ VAS (0–100) 2023 81.59 17.42 1570 85.74 14.92 453 67.21 17.83
Happiness (0–10) 2021 7.64 1.95 1568 7.91 1.81 453 6.71 2.13
Satisfaction (0–10) 2022 7.53 2.01 1570 7.76 1.90 452 6.75 2.16
WHO-5 (0–100) 2023 71.98 18.02 1570 74.29 16.79 453 63.98 19.78
SWLS (0–35) 2023 24.56 6.19 1570 24.65 6.18 453 24.26 6.24
010203040Percent
0 .2 .4 .6 .8 1
ICECAP-A score
Fig. 1 Distribution of ICECAP-A (age-group 18–64) scores
05101520Percent
0 .2 .4 .6 .8 1
ICECAP-O score
Fig. 2 Distribution of ICECAP-O (age-group 65+) scores
fully consistent for all five items for 46 respondents (74.2%) for the ICECAP-A and for 44 participants (83.0%) for the ICECAP-O.
The ICC for the ICECAP-A instrument was 0.94 (95%
confidence interval: 0.90–0.97), and 0.97 for the ICECAP-O instrument (95% confidence interval: 0.94–0.98), both indi- cating excellent agreement. On the ICECAP-A instrument, the agreement on item levels was the highest for Attachment (95.5%), lowest for Stability (85.5%), while it was 91.9%
for Autonomy and Achievement and 93.5% for Enjoyment.
Only 2 persons had larger than 1 level difference in ratings for Stability item and 1 person had larger than one level dif- ference for Achievement. Regarding the ICECAP-O instru- ment, Attachment, Security and Control had an agreement of 96.2%, followed Enjoyment (94.3%), and Role (90.6%).
Only 2 respondents had larger than 1 levels difference in the Role domain.
Discussion
The aim of the paper was to develop the Hungarian lan- guage version of the ICECAP-A and ICECAP-O instruments and assess their psychometric properties in relation to vari- ous health status, well-being and social support measures.
Moreover, we aimed to provide population norms with both instruments to be used as reference scores in further clini- cal and public health studies. Overall, the Hungarian ICE- CAP-A/-O versions showed good psychometric properties.
Main socio-demographic characteristics were not significant
determinants of the ICECAP-O and only a few associations were observed with the ICECAP-A.
In terms of the construct validity of the Hungarian ICE- CAP-A and ICECAP-O, associations were in line with intui- tive assumptions and previous literature findings [9, 11, 12, 14]. Positive associations with marital status, employment, income, health and some major life events were confirmed by the subgroup analysis (and in multivariate regression analysis for the ICECAP-A), indicating good construct validity. Cronbach’s alpha of both ICECAP measures (0.86) indicated good internal consistency and these were very sim- ilar to what has been found by Linton et al. for the German version (0.83) and for the UK version (0.85) [11].
With respect to convergent validity, we assessed correla- tions between ICECAP measures and other standard vali- dated health status and well-being measures such as EQ- 5D-5L, WHO-5 and SWLS. Before we discuss the findings, we have to highlight that even though most of these ques- tionnaires focus on some aspects of health and well-being, only the ICECAP measures build on the concept of capa- bility, while all the others rather address functioning. This important conceptual difference can partly explain possible (and to some extent expected) divergence between ICECAP and the other measures. In addition, these measures apply to slightly different time frames that might also induce some disparity.
Correlations between ICECAP-A/-O scores and EQ- 5D-5L index scores were strong, and also with EQ VAS.
On the domains’ level, correlations between EQ-5D-5L domains and Autonomy (independence) of ICECAP-A were found weak, whilst were moderate in case of Control
Table 4 Correlations of ICECAP-A and ICECAP-O scores and items with EQ-5D-5L, EQ VAS, happiness, satisfaction with life, WHO-5 and SWLS scores
a Pearson correlations with ICECAP-A/-O scores, and Spearman’s rank correlation with ICECAP-A/-O items For all correlations, p < 0.01
Correlationsa, age-group 18–64 years Stability Attachment Autonomy Achievement Enjoyment ICECAP-A
EQ-5D-5L index score 0.382 0.285 0.325 0.448 0.373 0.572
EQ VAS 0.382 0.292 0.3030 0.398 0.359 0.517
Happiness VAS (0–10) 0.299 0.322 0.225 0.316 0.380 0.501
Satisfaction with life VAS (0–10) 0.309 0.335 0.211 0.339 0.395 0.521
WHO-5 score 0.375 0.354 0.294 0.386 0.380 0.532
SWLS score 0.276 0.304 0.174 0.286 0.311 0.446
Correlationsa, age-group 65 and over Attachment Security Role Enjoyment Control ICECAP-O
EQ-5D-5L score 0.347 0.494 0.584 0.511 0.506 0.649
EQ VAS 0.257 0.442 0.523 0.433 0.386 0.502
Happiness VAS (0–10) 0.364 0.411 0.448 0.428 0.341 0.516
Satisfaction with life VAS (0–10) 0.363 0.439 0.424 0.441 0.364 0.574
WHO-5 score 0.331 0.533 0.556 0.487 0.426 0.613
SWLS score 0.351 0.508 0.370 0.421 0.345 0.522
(independence) of ICECAP-O. We assume that younger (and healthier) individuals consider primarily other aspects than health when they think of autonomy (e.g. financial independ- ence, autonomy in decision making).
Although most of the validity studies used the EQ-5D measures when assessing convergent validity of the ICECAP instruments [11, 14], only few of them are directly compa- rable to ours, as most of them used the three-response level (EQ-5D-3L) version [15, 18, 42], and focused on specific conditions or patient population rather than the general pop- ulation. Correlation coefficient found in our study between the ICECAP-A score and EQ-5D-5L index score (r = 0.57), is very close to the ones found by Linton et al. for a Ger- man sample (r = 0.62) and for a UK sample (r = 0.61) of mixed populations of healthy individuals and patients [11].
In our study, the Pearson correlation coefficient between the ICECAP-O and the EQ-5D-5L score was 0.65. Hackert et al.
found a very similar (Spearman) correlation coefficient of 0.63 on the sample of UK general population of elderly [24].
In both studies strongest correlations were observed between the Role item and the EQ-5D-5L domains, while lowest in the Attachment items and the EQ-5D-5L domains. Regard- ing ICECAP-O and EQ VAS scores, the corresponding coef- ficients were rather similar as well (0.58 vs 0.50).
With respect to the SWLS life-satisfaction measure, we found moderate/strong correlations between the ICECAP- A/O and SWLS scores, slightly lower than found in previous studies. Linton et al. reported stronger correlation between the SWLS and ICECAP-A scores (Germany: 0.66, the UK:
0.68) than between the EQ-5D-5L and ICECAP-A scores, indicating that ICECAP-A was more related to life satisfac- tion (SWLS) than to health-related quality of life. However, in our case, it was the opposite. Nevertheless, in both stud- ies, correlation coefficients between SWLS and ICECAP-A domains were the lowest for the Autonomy domain. Regard- ing ICECAP-O, Hackert et al. reported a correlation coef- ficient of 0.72 between the ICECAP-O and SWLS scores [24], while in our case it was slightly lower, 0.52.
According to our knowledge, this is the first study to assess the relationship between the WHO-5 mental well- being measure and the ICECAP-A/-O. Given that both are well-being measures, although with different approach, we expected strong association between these tools. Correla- tions between ICECAP-A/O scores and WHO-5 score were indeed strong (0.53 and 0.61, respectively), nonetheless their strength remained slightly under the level seen between the ICECAP-A/-O and the EQ-5D-5L health status index.
To assess test–retest reliability of the instruments, about 5% of the respondents were asked to fill in the ICECAP-A and -O questionnaires right after the interviews. So far, only two studies explored test–retest reliability of the ICECAP- A [43, 44], and another two of the ICECAP-O instrument [42, 45]. In these studies, the follow-up interview took place
1–2 weeks after the baseline interview, thus we expected and in fact found higher intra-class coefficients in our study indicating excellent agreement.
Multiple regression analysis revealed no significant asso- ciations between socio-demographic characteristics and ICECAP-O. For the ICECAP-A, only income and having a paid job showed significant positive associations, whilst living in Budapest resulted significantly worse ICECAP-A scores. In Australia, Couzner et al. found no strong relation- ship between ICECAP-O and socio-demographic status in age-group 65 and over, either [16]. In our study, EQ-5D-5L health status was significant determinant of both ICECAP measures. Among the items of MEHM, only the self-per- ceived health status scale was proved to be significantly cor- related with both ICECAP-A and -O (but the long-standing illness and GALI items were not). These results, on the one hand, enable estimates from one measure to another in the lack of observed data, nonetheless further research into exploring additional influencing factors of capabilities are suggested. On the other hand, our findings highlight and confirm previous studies regarding the remarkable differ- ence between health status and well-being capabilities. We believe that it is time to consider the use of preference-based capability measures alongside the health status measures (e.g. MEHM) in international standardized and routinely collected population health statistics.
Some limitations of our study are worth mentioning.
Because Hungarian tariffs for the ICECAP-A/-O and EQ- 5D-5L were not available at the time of the study, the tar- iffs for the UK and England were used, respectively. These might differ from the preferences of the Hungarian general population. Also, the English tariff for the EQ-5D-5L has been recently criticized in the literature [46]. Therefore, we analysed the correlations between these measures on the domains’ level as well which are independent from the national tariffs. Due to the cross-sectional nature of the study, we could not assess the responsiveness of the Hun- garian ICECAP instruments to changes. Further prospec- tive studies should be undertaken to tackle this issue. The time between the test and retest was short, therefore we can- not exclude some recall effects. This validation study has been carried out on a representative sample of the general population, which we think is one of the strengths of our research. Nevertheless, validity of the instruments should be tested also on patient populations for use in disease-specific studies.
Conclusion
To the best of our knowledge, this is the first study in Europe to present population norms with the ICECAP-A and ICECAP-O measures based on a large representative
sample. Being the first study in the Central and Eastern European region, our study contributes to the growing lit- erature exploring the psychometric validity of ICECAP measures across different cultural contexts. Our results proved that the Hungarian language versions of the ICE- CAP-A and ICECAP-O instruments are valid and reliable measures of capability among the general population. Our results provide a basis for estimating ICECAP-A/-O inputs for health economic analyses from regularly collected population health statistics (self-perceived health status scale and WHO-5) in the lack of observed data, although we encourage widespread direct measurements. Health is an important determinant of well-being capabilities, but main socio-demographic characteristics have no or only minor impact on ICECAP-O and ICECAP-A, respectively.
Other influencing factors deserve further investigation in future research.
Acknowledgements Open access funding provided by Corvinus Uni- versity of Budapest (BCE). The authors express their thanks to Dr.
Philip Kinghorn (University of Birmingham) for his help provided throughout the development process of the Hungarian language ver- sion of the ICECAP-A and ICECAP-O instruments.
Author contributions All authors contributed to the study conception and design. Material preparation, data collection and analysis were performed Petra Baji, Miklós Farkas, Ágota Dobos, Zsombor Zrubka, Valentin Brodszky, Fanni Rencz, László Gulácsi and Márta Péntek. The first draft of the manuscript was written by Petra Baji and Márta Péntek and all authors commented on previous versions of the manuscript. All authors read and approved the final manuscript.
Funding This research was supported by the Higher Education Insti- tutional Excellence Program of the Ministry of Human Capacities in the framework of the ’Financial and Public Services’ research project (20764-3/2018/FEKUTSTRAT) at Corvinus University of Budapest.
Data availability The data that support the findings of this study are available from the corresponding author upon reasonable request.
Compliance with ethical standards
Conflict of interest In connection with writing this article, Petra Baji, Miklós Farkas and Márta Péntek received grant support from the Higher Education Institutional Excellence Program of the Ministry for Innovation and Technology in the framework of the Financial and Public Services research project (NKFIH-1163-10/2019) at Corvinus University of Budapest. Other authors declare that they have no con- flict of interest.
Ethics approval All procedures performed in studies involving human participants were in accordance with the ethical standards of the national research committee (Hungarian Medical Research Council;
Approval No. 10058-3/2019/EKU) and with the 1964 Helsinki declara- tion and its later amendments or comparable ethical standards.
Informed consent Informed consent was obtained from all individual participants included in the study.
Open Access This article is licensed under a Creative Commons Attri- bution 4.0 International License, which permits use, sharing, adapta- tion, distribution and reproduction in any medium or format, as long as you give appropriate credit to the original author(s) and the source, provide a link to the Creative Commons licence, and indicate if changes were made. The images or other third party material in this article are included in the article’s Creative Commons licence, unless indicated otherwise in a credit line to the material. If material is not included in the article’s Creative Commons licence and your intended use is not permitted by statutory regulation or exceeds the permitted use, you will need to obtain permission directly from the copyright holder. To view a copy of this licence, visit http://creat iveco mmons .org/licen ses/by/4.0/.
References
1. Boncz, I., & Sebestyen, A. (2006). Financial deficits in the health services of the UK and Hungary. The Lancet, 368(9539), 917–
918. https ://doi.org/10.1016/S0140 -6736(06)69369 -0.
2. Smith, S., Brick, A., O’Hara, S., & Normand, C. (2014). Evi- dence on the cost and cost-effectiveness of palliative care: A lit- erature review. Palliative Medicine, 28(2), 130–150. https ://doi.
org/10.1177/02692 16313 49346 6.
3. Krol, M., Papenburg, J., & van Exel, J. (2015). Does including informal care in economic evaluations matter? A systematic review of inclusion and impact of informal care in cost-effective- ness studies. Pharmacoeconomics, 33(2), 123–135. https ://doi.
org/10.1007/s4027 3-014-0218-y.
4. Bulamu, N. B., Kaambwa, B., & Ratcliffe, J. (2015). A systematic review of instruments for measuring outcomes in economic evalu- ation within aged care. Health and Quality of Life Outcomes, 13, 179. https ://doi.org/10.1186/s1295 5-015-0372-8.
5. Mitchell, P. M., Roberts, T. E., Barton, P. M., & Coast, J. (2015).
Assessing sufficient capability: A new approach to economic evaluation. Social Science & Medicine, 139, 71–79. https ://doi.
org/10.1016/j.socsc imed.2015.06.037.
6. Al-Janabi, H., Flynn, T. N., & Coast, J. (2012). Development of a self-report measure of capability wellbeing for adults: The ICECAP-A. Quality of Life Research, 21(1), 167–176. https ://doi.
org/10.1007/s1113 6-011-9927-2.
7. Grewal, I., Lewis, J., Flynn, T., Brown, J., Bond, J., & Coast, J.
(2006). Developing attributes for a generic quality of life meas- ure for older people: Preferences or capabilities? Social Science
& Medicine, 62(8), 1891–1901. https ://doi.org/10.1016/j.socsc imed.2005.08.023.
8. Helter, T. M., Coast, J., Laszewska, A., Stamm, T., & Simon, J.
(2019). Capability instruments in economic evaluations of health- related interventions: A comparative review of the literature.
Quality of Life Research. https ://doi.org/10.1007/s1113 6-019- 02393 -5.
9. Proud, L., McLoughlin, C., & Kinghorn, P. (2019). ICECAP-O, the current state of play: A systematic review of studies report- ing the psychometric properties and use of the instrument over the decade since its publication. Quality of Life Research, 28(6), 1429–1439. https ://doi.org/10.1007/s1113 6-019-02114 -y.
10. Versteegh, M., Knies, S., & Brouwer, W. (2016). From good to better: New Dutch guidelines for economic evaluations in healthcare. Pharmacoeconomics, 34, 1071–1074. https ://doi.
org/10.1007/s4027 3-016-0431-y.
11. Linton, M.-J., Mitchell, P. M., Al-Janabi, H., Schlander, M., Richardson, J., Iezzi, A., et al. (2018). Comparing the German translation of the ICECAP-A capability wellbeing measure to the original english version: Psychometric properties across healthy samples and seven health condition groups. Applied Research in Quality of Life. https ://doi.org/10.1007/s1148 2-018-9681-5.
12. Coast, J., Peters, T. J., Natarajan, L., Sproston, K., & Flynn, T.
(2008). An assessment of the construct validity of the descrip- tive system for the ICECAP capability measure for older people.
Quality of Life Research, 17(7), 967–976. https ://doi.org/10.1007/
s1113 6-008-9372-z.
13. Flynn, T. N., Chan, P., Coast, J., & Peters, T. J. (2011). Assess- ing quality of life among British older people using the ICEPOP CAPability (ICECAP-O) measure. Applied Health Economics and Health Policy, 9(5), 317–329. https ://doi.org/10.2165/11594 150- 00000 0000-00000 .
14. Al-Janabi, H., Peters, T. J., Brazier, J., Bryan, S., Flynn, T. N., Clemens, S., et al. (2013). An investigation of the construct valid- ity of the ICECAP-A capability measure. Quality of Life Research, 22(7), 1831–1840. https ://doi.org/10.1007/s1113 6-012-0293-5.
15. Couzner, L., Crotty, M., Norman, R., & Ratcliffe, J. (2013). A comparison of the EQ-5D-3L and ICECAP-O in an older post- acute patient population relative to the general population. Applied Health Economics and Health Policy, 11(4), 415–425. https ://doi.
org/10.1007/s4025 8-013-0039-8.
16. Couzner, L., Ratcliffe, J., Lester, L., Flynn, T., & Crotty, M.
(2013). Measuring and valuing quality of life for public health research: Application of the ICECAP-O capability index in the Australian general population. International Journal of Public Health, 58(3), 367–376. https ://doi.org/10.1007/s0003 8-012-0407-4.
17. Davis, J. C., Liu-Ambrose, T., Richardson, C. G., & Bryan, S.
(2013). A comparison of the ICECAP-O with EQ-5D in a falls prevention clinical setting: are they complements or substitutes?
Quality of Life Research, 22(5), 969–977. https ://doi.org/10.1007/
s1113 6-012-0225-4.
18. Davis, J. C., Best, J. R., Dian, L., Khan, K. M., Hsu, C. L., Chan, W., et al. (2017). Are the EQ-5D-3L and the ICECAP-O responsive among older adults with impaired mobility? Evidence from the Vancouver Falls Prevention Cohort Study. Quality of Life Research, 26(3), 737–747. https ://doi.org/10.1007/s1113 6-016-1487-z.
19. Makai, P., Brouwer, W. B., Koopmanschap, M. A., & Nieboer, A. P. (2012). Capabilities and quality of life in Dutch psycho- geriatric nursing homes: An exploratory study using a proxy ver- sion of the ICECAP-O. Quality of Life Research, 21(5), 801–812.
https ://doi.org/10.1007/s1113 6-011-9997-1.
20. Makai, P., Beckebans, F., van Exel, J., & Brouwer, W. B. (2014).
Quality of life of nursing home residents with dementia: Valida- tion of the German version of the ICECAP-O. PLoS ONE, 9(3), e92016. https ://doi.org/10.1371/journ al.pone.00920 16.
21. Sarabia-Cobo, C. M., Parás-Bravo, P., Amo-Setién, F. J., Alcon- ero-Camarero, A. R., Sáenz-Jalón, M., Torres-Manrique, B., et al. (2017). Validation of the Spanish version of the ICECAP- O for nursing home residents with dementia. PLoS ONE, 12(1), e0169354. https ://doi.org/10.1371/journ al.pone.01693 54.
22. Gustafsson, S., Hörder, H., Hammar, I. O., & Skoog, I. (2018).
Face and content validity and acceptability of the Swedish ICE- CAP-O capability measure: Cognitive interviews with 70-year- old persons. Health Psychology Research, 6(1), 6496. https ://doi.
org/10.4081/hpr.2018.6496.
23. Tang, C., Xiong, Y., Wu, H., & Xu, J. (2018). Adaptation and assessments of the Chinese version of the ICECAP-A measure- ment. Health and Quality of Life Outcomes, 16(1), 45. https ://doi.
org/10.1186/s1295 5-018-0865-3.
24. Hackert, M. Q., van Exel, J., & Brouwer, W. B. (2019). Does the ICECAP-O cover the physical, mental and social functioning of older people in the UK? Quality of Life Research, 28(3), 761–770.
https ://doi.org/10.1007/s1113 6-018-2042-x.
25. Hungarian Central Statistical Office. (2016). Data of population by main characteristics of demography by region from Microcensus
2016. Retrieved April 8 2020, from https ://stati nfo.ksh.hu/Stati nfo/theme Selec tor.jsp?&lang=en.
26. Flynn, T. N., Huynh, E., Peters, T. J., Al-Janabi, H., Clemens, S., Moody, A., et al. (2015). Scoring the ICECAP-A capability instrument. Estimation of a UK general population tariff. Health Economics, 24(3), 258–269. https ://doi.org/10.1002/hec.3014.
27. Coast, J., Flynn, T. N., Natarajan, L., Sproston, K., Lewis, J., Lou- viere, J. J., et al. (2008). Valuing the ICECAP capability index for older people. Social Science & Medicine, 67(5), 874–882. https ://
doi.org/10.1016/j.socsc imed.2008.05.015.
28. Wild, D., Grove, A., Martin, M., Eremenco, S., McElroy, S., Verjee-Lorenz, A., et al. (2005). Principles of good practice for the translation and cultural adaptation process for patient-reported outcomes (PRO) measures: Report of the ISPOR Task Force for Translation and Cultural Adaptation. Value in Health, 8(2), 94–104. https ://doi.org/10.1111/j.1524-4733.2005.04054 .x.
29. Eurostat. (2013). European Health Interview Survey (EHIS wave 2) methodological manual. European Commission Publications Office of the European Union. Retrieved April 7 2020, from https ://ec.europ a.eu/euros tat/docum ents/38595 98/59267 29/KS-RA- 13-018-EN.PDF/26c7e a80-01d8-420e-bdc6-e9d5f 6578e 7c.
30. Herdman, M., Gudex, C., Lloyd, A., Janssen, M., Kind, P., Par- kin, D., et al. (2011). Development and preliminary testing of the new five-level version of EQ-5D (EQ-5D-5L). Quality of Life Research, 20(10), 1727–1736. https ://doi.org/10.1007/s1113 6-011-9903-x.
31. Rencz, F., Gulacsi, L., Drummond, M., Golicki, D., Prevolnik Rupel, V., Simon, J., et al. (2016). EQ-5D in central and eastern Europe: 2000–2015. Quality of Life Research, 25(11), 2693–2710.
https ://doi.org/10.1007/s1113 6-016-1375-6.
32. Devlin, N. J., Shah, K. K., Feng, Y., Mulhern, B., & van Hout, B. (2018). Valuing health-related quality of life: An EQ-5D-5L value set for England. Health Economics, 27(1), 7–22. https ://doi.
org/10.1002/hec.3564.
33. Topp, C. W., Østergaard, S. D., Søndergaard, S., & Bech, P.
(2015). The WHO-5 Well-Being Index: A systematic review of the literature. Psychotherapy and Psychosomatics, 84(3), 167–
176. https ://doi.org/10.1159/00037 6585.
34. WHO. (1998). Wellbeing measures in primary health care: The DepCare project: Report on a WHO meeting Stockholm. Copen- hagen: Health Documentation Services WHO Regional Office for Europe.
35. Kobau, R., Sniezek, J., Zack, M. M., Lucas, R. E., & Burns, A.
(2010). Well-being assessment: An evaluation of well-being scales for public health and population estimates of well-being among US adults. Applied Psychology: Health and Well-Being, 2(3), 272–297. https ://doi.org/10.1111/j.1758-0854.2010.01035 .x.
36. Diener, E., Emmons, R., Larsen, R., & Griffin, S. (1985). The satisfaction with life scale. Journal of Personality Assessment, 49, 71–75. https ://doi.org/10.1207/s1532 7752j pa490 1_13.
37. Prinsen, C. A., Mokkink, L. B., Bouter, L. M., Alonso, J., Pat- rick, D., de Vet, H., et al. (2018). COSMIN guideline for sys- tematic reviews of outcome measurement instruments. Quality of Life Research, 27(5), 1147–1157. https ://doi.org/10.1007/s1113 6-018-1798-3.
38. Tavakol, M., & Dennick, R. (2011). Making sense of Cronbach’s alpha. International Journal of Medical Education, 2, 53–55.
https ://doi.org/10.5116/ijme.4dfb.8dfd.
39. Bland, J. M., & Altman, D. G. (1997). Statistics notes: Cron- bach’s alpha. British Medical Journal, 314(7080), 572. https ://
doi.org/10.1136/bmj.314.7080.572.
40. Cohen, J. J. (1988). Set correlation and contingency tables.
Applied Psychological Measurement, 12(4), 425–434. https ://
doi.org/10.1177/01466 21688 01200 410.
41. Koo, T. K., & Li, M. Y. (2016). A guideline of selecting and reporting intraclass correlation coefficients for reliability research.
Journal of Chiropractic Medicine, 15(2), 155–163. https ://doi.
org/10.1016/j.jcm.2016.02.012.
42. van Leeuwen, K. M., Bosmans, J. E., Jansen, A. P., Hoogendijk, E.
O., van Tulder, M. W., van der Horst, H. E., et al. (2015). Compar- ing measurement properties of the EQ-5D-3L, ICECAP-O, and ASCOT in frail older adults. Value in Health, 18(1), 35–43. https ://doi.org/10.1016/j.jval.2014.09.006.
43. Al-Janabi, H., Flynn, T. N., Peters, T. J., Bryan, S., & Coast, J.
(2015). Test–retest reliability of capability measurement in the UK general population. Health Economics, 24(5), 625–630. https ://doi.org/10.1002/hec.3100.
44. Holst-Kristensen, A. W., Fonager, K., & Pedersen, K. M. (2019).
Test-retest reliability of ICECAP-A in the adult Danish popu- lation. Quality of Life Research. https ://doi.org/10.1007/s1113 6-019-02331 -5.
45. Hörder, H., Gustafsson, S., Rydberg, T., Skoog, I., & Waern, M.
(2016). A cross-cultural adaptation of the ICECAP-O: test–retest reliability and item relevance in Swedish 70-year-olds. Societies, 6(4), 30. https ://doi.org/10.3390/soc60 40030 .
46. National Institute for Health and Care Excellence. (2019). Position statement on use of the EQ-5D-5L value set for England (updated October 2019). Retrieved April 7 2020, from https ://www.nice.
org.uk/about /what-we-do/our-progr ammes /nice-guida nce/techn ology -appra isal-guida nce/eq-5d-5l.
Publisher’s Note Springer Nature remains neutral with regard to jurisdictional claims in published maps and institutional affiliations.