CERS-IE WORKING PAPERS | KRTK-KTI MŰHELYTANULMÁNYOK
INSTITUTE OF ECONOMICS, CENTRE FOR ECONOMIC AND REGIONAL STUDIES, BUDAPEST, 2021
Time patterns of precautionary health behaviours during an easing phase of the COVID-19 pandemic in Europe
ANIKÓ BÍRÓ – RÉKA BRANYICZKI – PÉTER ELEK
CERS-IE WP – 2021/7
January 2021
https://www.mtakti.hu/wp-content/uploads/2021/01/CERSIEWP202107.pdf
CERS-IE Working Papers are circulated to promote discussion and provoque comments, they have not been peer-reviewed.
Any references to discussion papers should clearly state that the paper is preliminary.
Materials published in this series may be subject to further publication.
ABSTRACT
Using data from the COVID-19 questionnaire of the Survey of Health, Ageing and Retirement in Europe (SHARE), we investigate the time patterns of precautionary health behaviours of individuals aged 50 and above during the summer of 2020, an easing phase of the COVID-19 pandemic in Europe. We also examine how these health behaviours differ by the presence of chronic conditions such as hypertension, high cholesterol level, heart disease, diabetes or chronic bronchitis, which can be considered as risk factors for COVID-19. Our results suggest that while on average, people became less precautious during our analysed time period, this is less so for those who are at higher risk. We also document large regional differences in precautionary health behaviours and show that higher risk individuals are on average more cautious in all regions. We conclude that people adjusted their health behaviours in line with the generally understood risk of the COVID-19 disease. At the same time, our results also point out divergences in the level of willingness to take different precautionary steps.
JEL codes: I10, I12, I18
Keywords: COVID-19, health risk, precautionary behaviours, SHARE data
Anikó Bíró
Health and Population Lendület Research Group, Centre for Economic and Regional Studies, 1097 Budapest, Tóth Kálmán u. 4.
e-mail: biro.aniko@krtk.hu Réka Branyiczki
Central European University and
TÁRKI
e-mail: reka.branyiczki@tarki.hu Péter Elek
Health and Population Lendület Research Group, Centre for Economic and Regional Studies, 1097 Budapest, Tóth Kálmán u. 4.
and
Institute of Economics, Corvinus University of Budapest
e-mail: elek.peter@krtk.hu
Az elővigyázatos egészségmagatartás időbeli mintázata a koronavírus-járvány egy enyhülő szakaszában Európában
BÍRÓ ANIKÓ – BRANYICZKI RÉKA – ELEK PÉTER
ÖSSZEFOGLALÓ
A SHARE (Survey of Health, Ageing and Retirement in Europe) felmérés COVID19 kérdőívének adatain vizsgáljuk a legalább 50 éves európai lakosság egészségügyi óvintézkedéseinek időbeli lefutását 2020 nyarán, a koronavírus-járvány egy enyhülő szakaszában. Azt is elemezzük, hogy ezek az elővigyázatos magatartásformák jellemzőbbek-e olyan krónikus betegségek jelenléte esetén, mint a magas vérnyomás, a magas koleszterinszint, a szívbetegség, a cukorbetegség vagy a krónikus tüdőbetegség, amelyek kockázati tényezőnek számítanak koronavírus-fertőzés esetén.
Eredményeink azt mutatják, hogy az elemzett időszakban az emberek átlagosan kevésbé elővigyázatossá váltak, de ez a tendencia kevésbé volt jellemző a magas kockázatú személyekre. Azt is látjuk, hogy jelentős regionális különbségek vannak Európában az egészségügyi óvintézkedések elterjedtségében, de a magas kockázatú személyek minden régióban átlagosan óvatosabbak. Arra következtetünk, hogy az emberek a COVID-19 általánosan ismert kockázataival összhangban hoznak meg egyéni egészségügyi óvintézkedéseket. Ugyanakkor eredményeink arra is felhívják a figyelmet, hogy az idősek a különböző típusú elővigyázatos magatartásformákat eltérő mértékben hajlandók követni.
JEL: I10, I12, I18
Kulcsszavak: COVID-19, egészségügyi kockázat, elővigyázatos magatartásformák,
SHARE adatok
Time patterns of precautionary health behaviours during an easing phase of the COVID-19 pandemic in Europe
Anik´ o B´ır´ o
∗, R´ eka Branyiczki
†, P´ eter Elek
‡Abstract
Using data from the COVID19 questionnaire of the Survey of Health, Ageing and Retire- ment in Europe (SHARE), we investigate the time patterns of precautionary health behaviours of individuals aged 50 and above during the summer of 2020, an easing phase of the COVID-19 pandemic in Europe. We also examine how these health behaviours differ by the presence of chronic conditions such as hypertension, high cholesterol level, heart disease, diabetes or chronic bronchitis, which can be considered as risk factors for COVID-19. Our results suggest that while on average, people became less precautious during our analysed time period, this is less so for those who are at higher risk. We also document large regional differences in precautionary health behaviours and show that higher risk individuals are on average more cautious in all regions. We conclude that people adjusted their health behaviours in line with the generally understood risk of the COVID-19 disease. At the same time, our results also point out divergences in the level of willingness to take different precautionary steps.
Keywords: COVID-19, health risk, precautionary behaviours, SHARE data
∗Centre for Economic and Regional Studies, Budapest, Hungary
†Central European University and T ´ARKI, Budapest, Hungary
‡Centre for Economic and Regional Studies, Hungary and Corvinus University of Budapest, Hungary
Acknowledgements
B´ır´o, Branyiczki and Elek were supported by the “Lend¨ulet” program of the Hungarian Academy of Sciences (grant number: LP2018-2/2018). Elek was supported by the J´anos Bolyai Research Scholarship of the Hungarian Academy of Sciences.
We thank Johanna Bristle and Thorsten Kneip for their useful comments.
This paper uses data from SHARE (Survey of Health, Ageing and Retirement in Europe). The SHARE data collection has been funded by the European Commission through FP5 (QLK6-CT- 2001-00360), FP6 (SHARE-I3: RII-CT-2006-062193, COMPARE: CIT5-CT-2005-028857, SHARE- LIFE: CIT4-CT-2006-028812), FP7 (SHARE-PREP: GA No211909, SHARE-LEAP: GA No227822, SHARE M4: GA No261982, DASISH: GA No283646) and Horizon 2020 (SHARE-DEV3: GA No676536, SHARE-COHESION: GA No870628, SERISS: GA No654221, SSHOC: GA No823782) and by DG Employment, Social Affairs & Inclusion. Additional funding from the German Ministry of Education and Research, the Max Planck Society for the Advancement of Science, the U.S.
National Institute on Aging (U01 AG09740-13S2, P01 AG005842, P01 AG08291, P30 AG12815, R21 AG025169, Y1-AG-4553-01, IAG BSR06-11, OGHA 04-064, HHSN271201300071C) and from various national funding sources is gratefully acknowledged (seewww.share-project.org).
1 Introduction
Until a vaccine becomes widely available, changing the behaviour of the population is key to contain the spread of COVID-19. Accordingly, some of our everyday activities have changed drastically since the outbreak of the pandemic as governments urged citizens to take precautionary steps, stemming from recommending hand sanitizing and mandating wearing a mask in public to staying at home, often forced by a curfew. Using data from the Survey of Health, Ageing and Retirement in Europe (SHARE), we investigate the time patterns of several precautionary health behaviours among the European population above age 50 during the summer (June and July) of 2020. We can consider this period as an easing phase of the COVID-19 pandemic since it falls between the “first wave” (spring of 2020) and the “second wave” (autumn of 2020). Although there were heterogeneities across countries, average death rates due to COVID-19 slightly decreased (WHO, 2020) and COVID-19-related policies became on average less stringent (University of Oxford, 2020) over this period.
We assess how precautionary health behaviours are shaped by the presence of chronic diseases across European regions. Do we see that cautious behaviour of older people is spreading or is it rather fading over time? Are there any differences based on health status in the precautionary steps they take and the time pattern of such steps? Given that the mortality risk is much higher for older people (90 percent of deaths occured among people aged above 60 years during the first wave of the pandemic in Europe, see OECD and European Union, 2020), especially for those suffering from chronic diseases, it is important to understand the dynamics of different health behaviours to curb the number of fatalities due to the virus.
Drivers of health behaviour are complex; ecological models provide a comprehensive framework of the multiple and interacting levels of factors that influence health behaviour, grouped into in- trapersonal, interpersonal, organizational, community, and public policy levels (Sallis et al., 2008;
Richard et al., 2011). Given the substantial negative externalities arising from irresponsible indi- vidual behaviour during a pandemic, governments introduced restrictions of individual behaviour in most European countries with varying levels of policy stringency (Hale et al., 2020). Apart from policy stringency, the likelihood of compliant behaviour also varies both across and within coun- tries. Accordingly, some of the recent scholarly attention has focused on understanding the factors behind adhering to cautious health behaviour under COVID-19. The assessed factors are diverse, and the results are mixed, some found that in the US partisanship is the single most consistent fac- tor that differentiates health behaviours (Gadarian et al., 2020), others found no effect of politically relevant variables and named simply the fear of COVID-19 as the predictor of positive behaviour change (i.e. social distancing and improved hand hygiene) (Harper et al., 2020). Wise et al. (2020) also reported that the strongest predictor of social distancing was the perceived likelihood of per- sonally being infected. A Japanese study highlights the importance of awareness and knowledge as being informed about COVID-19 was associated with a more precautious behaviour (Shiina et al., 2020). Clark et al. (2020) observed that belief in the effectiveness of health precautions against COVID-19 and prioritizing one’s health in general made a difference. Similarly, Bourassa et al.
(2020) demonstrated that social distancing is associated with conventional health behaviours and healthier habits in general.
The rapidly expanding COVID-literature has yet collected less evidence specifically about the behaviour of older people, though Clark et al. (2020) found that age was generally unrelated to voluntary compliant behaviours during the pandemic. In general, the public discourse during the pandemic characterized older people as a rather homogeneous vulnerable group that society needs to protect even at the cost of sacrificing much of their social life and that of other generations as well (Klusmann and Kornadt, 2020). However, the ageing process and older people are diverse, their health status, attitudes and behaviour vary (Thøgersen-Ntoumani et al., 2011). For instance,
not only actual age but positive views on ageing in general and a younger subjective age (or a more youthful identity) are often associated with health-promoting activities, such as walking (Kornadt et al., 2020; Montepare, 2020). Similarly, self-efficacy, in other words perceived competency has a beneficial effect on health behaviour, and it may explain part of the relationship between socio- economic status and health status (Grembowski et al., 1993). Apart from diverging attitudes, the health status of older people varies as well. For example, there are profound disparities in the prevalence of chronic diseases in the European Union by socio-economic status (OECD and European Union, 2020). Thus, it is worth studying the heterogeneities of the older age group to better understand their behaviour.
Our simple theoretical framework of individual level drivers of health behaviour covers the per- ceived probability of getting infected and the perceived health risk of an infection, which together influence the general level of risk aversion related to COVID-19. Then deciding about each precau- tionary step involves a subjective cost-benefit analysis of the behaviour-shift, which might include an altruistic motive. Note, that some precautionary behaviours, such as wearing a mask, can have positive externalities by reducing the risk of infecting others (Salani´e and Treich, 2020). Here, we assume that people take into account only the subjective cost and benefit of each precautionary step. We suspect that the perceived health risk is influenced by objective (or well-established) risk factors, such as age, chronic diseases, and being a male that are all positively related to the health risk imposed by COVID-19, and by the knowledge and awareness of these risk factors, which are usually associated with educational level. Regarding the individual level cost-benefit analysis of changing a behaviour, we have several considerations. First, some precautionary steps are in general less costly than others (i.e. hand washing vs. not meeting family) and thus we expect them to be more widespread. Second, the same precautionary step may impose different levels of costs to different people. For example, we expect that those who are employed and those who live alone
are less likely to stay at home and to give up personal social interactions as that would mean a larger sacrifice from them.
We contribute to the existing literature about health behavioural responses to a pandemic by focusing on the risk group of older people and the role of their health status. Given the large sample size and variation in interview times, we are also able to demonstrate time trends of average levels of precaution, and we show regional differences in precautionary behaviour across Europe, indicative of the role of the cultural and policy context.
Our paper is structured as follows. First, we briefly introduce the data and the health behaviour, health status and control variables we use. Then we show the time patterns of different health behaviours over the summer, both together and separately for individuals with and without a chronic condition. We also demonstrate regional differences of health behaviour, while keeping the decomposition by chronic condition. Finally, we turn to our linear probability models of the different health behaviour changes, where next to the baseline associations some of the regressions allow differing time trends of behaviour by health status and age. We conclude with discussing our results.
2 Methods
2.1 Data
Our analysis is primarily based on the SHARE-COVID19 data (B¨orsch-Supan, 2020a,b).1 We restrict the SHARE-COVID19 sample to those observations that were recorded during the eight weeks between June 8, 2020 and August 2, 2020. Thus, we exclude the last three weeks of the SHARE-COVID19 fieldwork when relatively few interviews were conducted (omitting 2,593 obser-
1We use SHARE Waves 7 and 8 (DOIs: 10.6103/SHARE.w7.711, 10.6103/SHARE.w8cabeta.001), see B¨orsch-Supan et al. (2013); Scherpenzeel et al. (2020) for methodological details.
vations, or 4.5% of the SHARE-COVID19 sample). Also, the education indicator – which comes from the SHARE wave 7 data, see below – is missing for 7,496 observations. Taking into account the small number of item non-response, the final sample size used in the analyses is 46,040 from 26 European countries and Israel (the Netherlands cannot be included in the analysis due to not participating in SHARE wave 7).
The variables that are in the focus of our analysis are eight indicators of health behaviour from the SHARE-COVID19 survey. These indicators capture how people changed their health behaviours in response to the outbreak of the COVID-19 pandemic. To ease the interpretation of the results, we dichotomise all eight indicators as follows. (1)No walks equals one if someone has not left home since the outbreak or responds “not any more” to the question whether he/she went out for a walk since the outbreak, zero otherwise. (2) No shopping equals one if someone has not left home since the outbreak or responds “not any more” to the question about going shopping since the outbreak, zero otherwise. (3) No meeting with family equals one if someone has not left home since the outbreak or responds “not any more” to the question about visiting other family members since the outbreak, zero otherwise. (4)No meeting with others equals one if someone has not left home since the outbreak or responds “not any more” to the question about meeting more than 5 people outside the household since outbreak, zero otherwise. (5)Distance to others equals one if someone responds “always” to the question about keeping distance from others in public.
(6) Wearing mask equals one if someone responds “always” to the question about wearing a face mask in public. (The latter two variables are not defined for those who have not left home since the outbreak, around 18% of the sample.) (7)More hand washing equals one if someone responds
“yes” to the question about washing hands more than usual. (8) More hand sanitising equals one if someone responds “yes” to the question about using hand sanitiser or disinfection fluids more than usual.
To capture the health status and COVID-19 risk of individuals, we use binary indicators of drugs taken regularly for high blood cholesterol, high blood pressure, heart disease (including coronary or cerebrovascular diseases and other heart diseases), diabetes and chronic bronchitis. These are well-established risk factors of COVID-19 severity and mortality (see e.g. the meta-analyses Nandy et al., 2020, Ssentongo et al., 2020, Zaki et al., 2020 – there is some disagreement on the effect of chronic bronchitis but its presence definitely increases the perceived risk). We classify a respondent as high-risk (66.5% of the sample) if he/she takes drugs regularly for any of the above listed conditions.
We also use a few demographic and socio-economic indicators in our analysis. We use gender and age, the latter split into four similar sized categories (age up to 63, 64-70, 71-76 and above 76), or simply into two categories (cut at 70 years) in some analyses (47.6% of the sample is above 70 years). We generate a binary indicator of being employed (including self-employment) at the time of the COVID-19 outbreak and a binary indicator of living alone (i.e. of the household size being equal to one, which was asked in wave 8, and is imputed from wave 7 if it is missing there). Finally, based on ISCED-97 (International Standard Classification of Education) codes in the SHARE wave 7 data, we create three categories of education level: primary, secondary and tertiary education (ISCED-97 levels 0-1, 2-4 and 5-6, respectively). Table 1 shows descriptive statistics of the demographic, socio-economic and health indicators.
2.2 Analytic approach
As a starting point, we display the weekly averages of the eight indicators of health behaviour during the eight examined weeks. In doing so, we net out country effects because different countries conducted the survey at different pace during the summer. Afterwards, we show the weekly averages separately for those with and without the presence of at least one chronic condition.
Table 1: Descriptive statistics
mean standard deviation
female 0.585 0.493
age 70.52 9.39
lives alone 0.241 0.427
employed 0.207 0.405
education level
primary 0.175 0.380 secondary 0.601 0.490 tertiary 0.224 0.417 drugs taken regularly for
high blood cholesterol 0.300 0.458 high blood pressure 0.525 0.499 heart disease 0.254 0.435 diabetes 0.148 0.355 chronic bronchitis 0.046 0.210
Note: Sample size: 46,040.
Data: SHARE Wave 7 Release 7.1.1, Wave 8 Release 0.0.1 beta.
Next, to illustrate the regional differences in health behaviour during our analysed period, we split the European SHARE countries into three country groups: West and North (Austria, Belgium, Denmark, Finland, Germany, Luxembourg, Sweden, Switzerland), South (Cyprus, France, Greece, Italy, Malta, Portugal, Spain) and East (Bulgaria, the Czech Republic, Croatia, Estonia, Hungary, Latvia, Lithuania, Poland, Romania, Slovakia, Slovenia). Based on WHO statistics (WHO, 2020), the COVID-19 cumulative mortality rate up until June 1, 2020 was around nine times higher in the West and North (0.338 per 1,000 population) and South (0.316 per 1,000 population) than in the East (0.037 per 1,000 population). For each country group, we show the average of the eight indicators of health behaviour separately for those with and without the presence of at least one chronic condition.
A limitation of the descriptive approach is that the interview date is not random, thus the observed time patterns might partly be driven by composition changes of the respondents. To address this issue, we apply regression models, controlling for a rich set of individual characteristics
that might be related both to health behaviours and to interview timing. We fit linear probability models of the eight health behaviour indicators using a linear time trend, the presence of the five specific chronic conditions, gender, age, education level, employment status at the time of the outbreak, the binary variable of living alone and country indicators (fixed effects) as explanatory variables. The results do not change qualitatively if logit models are used instead.
To examine the presence of differential time trends across health status, we also estimate linear probability models that contain the interaction term between having (at least one) chronic condition and the time trend. Besides, to analyse specifically whether the different time trends by health status arise from the relatively older or the younger population, we also estimate models with three-way interaction terms between the presence of chronic conditions, the time trend and the binary indicator of being above 70 years old.
All analyses were performed with Stata Statistical Software: Release 16. College Station, TX:
StataCorp LLC.
3 Results
3.1 Time patterns of health behaviours
According to Figure 1, on average, around 85% of respondents washed hands and the same propor- tion used hand sanitiser or disinfection fluids more than usual after the start of the pandemic. Also, if leaving their home, 76% always kept distance and 59% always wore a face mask in public. 53%
of respondents stayed at home or did not visit other family members and 63% did not meet more than five people outside the household since the outbreak. (These two indicators will be referred to as “no meeting” indicators below.) Even the most substantial changes in health behaviour, never leaving home for walking and for shopping since the outbreak was reported by 31% and 27%,
respectively. A gradual loosening of the behavioural changes during the eight examined weeks is especially visible for the two “no meeting” and the “distance in public” indicators. Meanwhile, the proportion of those who always wear a mask in public or use sanitiser more often seem to increase.
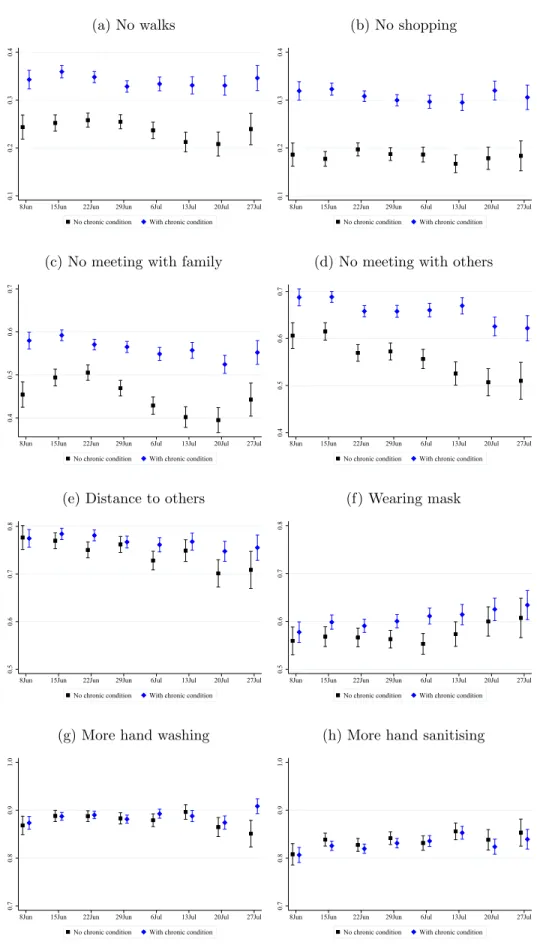
Figure 2 shows these descriptive time trends split by the health status of the respondents. For most indicators, people with chronic conditions were more cautious and – at least for the two “no meeting” measures – rather kept their cautiousness during the summer than healthy respondents.
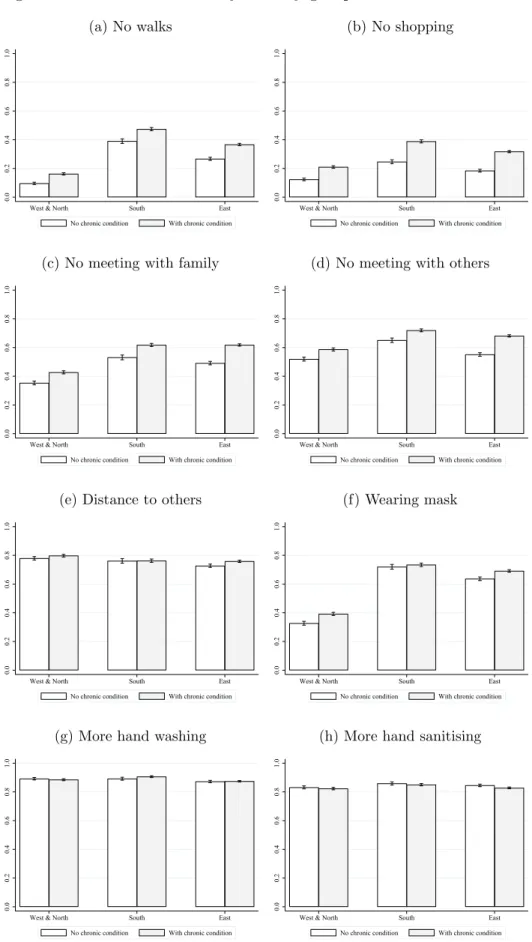
Figure 3 shows the average values of the health behaviour indicators by country groups and health status. In each country group and for each indicator, we again see that people with chronic conditions were more careful. The differences by health status are the strongest for the no walks, no shopping and the two “no meeting” indicators, while they are negligible for hand washing and hand sanitising. We also see that on average, people in Western and Northern Europe were the least cautious during the analysed period, especially in going for walks, shopping, meeting with family members and wearing masks. We do not see major differences in precautionary health behaviours between Southern and Eastern Europe.
Figure 1: Time patterns of health behaviours
(a) No walks
0.20.30.4
8Jun 15Jun 22Jun 29Jun 6Jul 13Jul 20Jul 27Jul
(b) No shopping
0.20.30.4
8Jun 15Jun 22Jun 29Jun 6Jul 13Jul 20Jul 27Jul
(c) No meeting with family
0.40.50.60.7
8Jun 15Jun 22Jun 29Jun 6Jul 13Jul 20Jul 27Jul
(d) No meeting with others
0.40.50.60.7
8Jun 15Jun 22Jun 29Jun 6Jul 13Jul 20Jul 27Jul
(e) Distance to others
0.50.60.70.8
8Jun 15Jun 22Jun 29Jun 6Jul 13Jul 20Jul 27Jul
(f) Wearing mask
0.50.60.70.8
8Jun 15Jun 22Jun 29Jun 6Jul 13Jul 20Jul 27Jul
(g) More hand washing
0.70.80.9
8Jun 15Jun 22Jun 29Jun 6Jul 13Jul 20Jul 27Jul
(h) More hand sanitising
0.70.80.9
8Jun 15Jun 22Jun 29Jun 6Jul 13Jul 20Jul 27Jul
Note: Mean with 95% confidence interval. Country effects are netted out. Data: SHARE Wave 8 Release 0.0.1 beta.
Figure 2: Health behaviours by chronic condition
(a) No walks
0.10.20.30.4
8Jun 15Jun 22Jun 29Jun 6Jul 13Jul 20Jul 27Jul
No chronic condition With chronic condition
(b) No shopping
0.10.20.30.4
8Jun 15Jun 22Jun 29Jun 6Jul 13Jul 20Jul 27Jul
No chronic condition With chronic condition
(c) No meeting with family
0.40.50.60.7
8Jun 15Jun 22Jun 29Jun 6Jul 13Jul 20Jul 27Jul
No chronic condition With chronic condition
(d) No meeting with others
0.40.50.60.7
8Jun 15Jun 22Jun 29Jun 6Jul 13Jul 20Jul 27Jul
No chronic condition With chronic condition
(e) Distance to others
0.50.60.70.8
8Jun 15Jun 22Jun 29Jun 6Jul 13Jul 20Jul 27Jul
No chronic condition With chronic condition
(f) Wearing mask
0.50.60.70.8
8Jun 15Jun 22Jun 29Jun 6Jul 13Jul 20Jul 27Jul
No chronic condition With chronic condition
(g) More hand washing
0.70.80.91.0
8Jun 15Jun 22Jun 29Jun 6Jul 13Jul 20Jul 27Jul
No chronic condition With chronic condition
(h) More hand sanitising
0.70.80.91.0
8Jun 15Jun 22Jun 29Jun 6Jul 13Jul 20Jul 27Jul
No chronic condition With chronic condition
Note: Mean with 95% confidence interval. Country effects are netted out. Data: SHARE Wave 8 Release 0.0.1 beta.
Figure 3: Health behaviours by country groups and chronic condition
(a) No walks
0.00.20.40.60.81.0
West & North South East
No chronic condition With chronic condition
(b) No shopping
0.00.20.40.60.81.0
West & North South East
No chronic condition With chronic condition
(c) No meeting with family
0.00.20.40.60.81.0
West & North South East
No chronic condition With chronic condition
(d) No meeting with others
0.00.20.40.60.81.0
West & North South East
No chronic condition With chronic condition
(e) Distance to others
0.00.20.40.60.81.0
West & North South East
No chronic condition With chronic condition
(f) Wearing mask
0.00.20.40.60.81.0
West & North South East
No chronic condition With chronic condition
(g) More hand washing
0.00.20.40.60.81.0
West & North South East
No chronic condition With chronic condition
(h) More hand sanitising
0.00.20.40.60.81.0
West & North South East
No chronic condition With chronic condition
Note: Mean with 95% confidence interval. Data: SHARE Wave 8 Release 0.0.1 beta.
3.2 Regression results
Turning to the regression results, we first note that our main health behaviour indicators will be the first four measures (“no walks”, “no shopping” and the “no meeting” indicators) because the
“distance” and the “mask” variables are only defined on the selected sample of those who responded that they left their home since the outbreak, while “hand washing” and “hand sanitising” seem the least costly interventions and were performed by the vast majority of respondents.
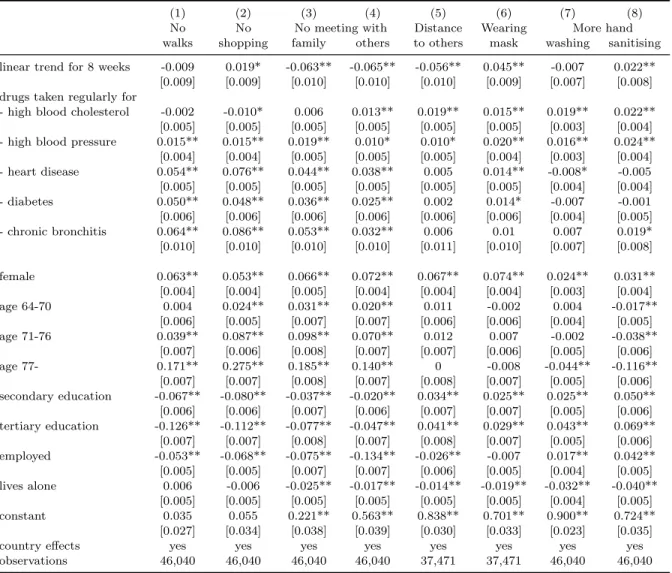
Table 2 displays the effect of specific chronic conditions and the time trend after controlling for individual characteristics and country indicators. Diagnosed hypertension and high blood choles- terol increase the prevalence of precautionary health behaviour measures generally by 1-2 %points, while the more severe conditions (heart disease, diabetes and chronic bronchitis) increase the first four (main) indicators by 3-9 %points but do not generally have a significant effect on the other four measures. In line with the descriptive graphs, the “no meeting” and the “distance” indicators decrease in time (by around 6 %points during the eight examined weeks), while the prevalence of wearing masks and more hand sanitising increases statistically significantly by 2-5 %points during the period.
The effects of the control variables are roughly in line with the theoretical framework presented in the Introduction. Older people are more severely affected by the disease and are more risk- averse, hence their health behaviour changed more substantially (at least for the main indicators).
Females, although face smaller objective risk, are more risk-averse, and their indicators are 2- 7 %points higher than those of males. The effect of the level of education is ambiguous as it decreases the main indicators and increases the others. Finally, since the employed have more social interactions in any case and people living alone need more social interactions to maintain their everyday activities, both groups changed their health behaviour less radically (apart from the
“hand washing” and “hand sanitising” indicators for the employed).
Table 2: Linear probability models of health behaviours
(1) (2) (3) (4) (5) (6) (7) (8)
No No No meeting with Distance Wearing More hand
walks shopping family others to others mask washing sanitising linear trend for 8 weeks -0.009 0.019* -0.063** -0.065** -0.056** 0.045** -0.007 0.022**
[0.009] [0.009] [0.010] [0.010] [0.010] [0.009] [0.007] [0.008]
drugs taken regularly for
- high blood cholesterol -0.002 -0.010* 0.006 0.013** 0.019** 0.015** 0.019** 0.022**
[0.005] [0.005] [0.005] [0.005] [0.005] [0.005] [0.003] [0.004]
- high blood pressure 0.015** 0.015** 0.019** 0.010* 0.010* 0.020** 0.016** 0.024**
[0.004] [0.004] [0.005] [0.005] [0.005] [0.004] [0.003] [0.004]
- heart disease 0.054** 0.076** 0.044** 0.038** 0.005 0.014** -0.008* -0.005 [0.005] [0.005] [0.005] [0.005] [0.005] [0.005] [0.004] [0.004]
- diabetes 0.050** 0.048** 0.036** 0.025** 0.002 0.014* -0.007 -0.001
[0.006] [0.006] [0.006] [0.006] [0.006] [0.006] [0.004] [0.005]
- chronic bronchitis 0.064** 0.086** 0.053** 0.032** 0.006 0.01 0.007 0.019*
[0.010] [0.010] [0.010] [0.010] [0.011] [0.010] [0.007] [0.008]
female 0.063** 0.053** 0.066** 0.072** 0.067** 0.074** 0.024** 0.031**
[0.004] [0.004] [0.005] [0.004] [0.004] [0.004] [0.003] [0.004]
age 64-70 0.004 0.024** 0.031** 0.020** 0.011 -0.002 0.004 -0.017**
[0.006] [0.005] [0.007] [0.007] [0.006] [0.006] [0.004] [0.005]
age 71-76 0.039** 0.087** 0.098** 0.070** 0.012 0.007 -0.002 -0.038**
[0.007] [0.006] [0.008] [0.007] [0.007] [0.006] [0.005] [0.006]
age 77- 0.171** 0.275** 0.185** 0.140** 0 -0.008 -0.044** -0.116**
[0.007] [0.007] [0.008] [0.007] [0.008] [0.007] [0.005] [0.006]
secondary education -0.067** -0.080** -0.037** -0.020** 0.034** 0.025** 0.025** 0.050**
[0.006] [0.006] [0.007] [0.006] [0.007] [0.007] [0.005] [0.006]
tertiary education -0.126** -0.112** -0.077** -0.047** 0.041** 0.029** 0.043** 0.069**
[0.007] [0.007] [0.008] [0.007] [0.008] [0.007] [0.005] [0.006]
employed -0.053** -0.068** -0.075** -0.134** -0.026** -0.007 0.017** 0.042**
[0.005] [0.005] [0.007] [0.007] [0.006] [0.005] [0.004] [0.005]
lives alone 0.006 -0.006 -0.025** -0.017** -0.014** -0.019** -0.032** -0.040**
[0.005] [0.005] [0.005] [0.005] [0.005] [0.005] [0.004] [0.005]
constant 0.035 0.055 0.221** 0.563** 0.838** 0.701** 0.900** 0.724**
[0.027] [0.034] [0.038] [0.039] [0.030] [0.033] [0.023] [0.035]
country effects yes yes yes yes yes yes yes yes
observations 46,040 46,040 46,040 46,040 37,471 37,471 46,040 46,040
Robust standard errors in brackets, ** p<0.01, * p<0.05. Linear trend starts on 8 June and corresponds to 8 weeks. Data:
SHARE Wave 7 Release 7.1.1, Wave 8 Release 0.0.1 beta.
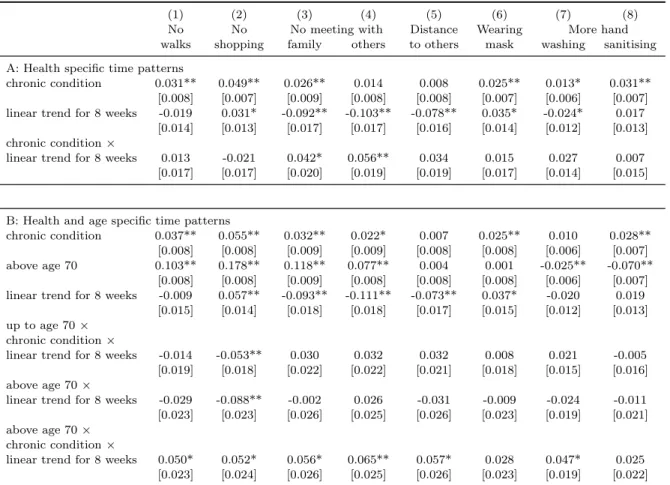
Table 3 displays the estimation results from models that allow differing time trends by health status. The two “no meeting” indicators show significant heterogeneities in their trends: they de- creased in the eight weeks by 9-10 %points for the healthy and only by 5 %points for the chronically ill population. As the lower panel of the table indicates, heterogeneity by health status is more substantial (and statistically significant for six out of the eight indicators) for the population aged 70 or above.
Table 3: Linear probability models of health behaviours with heterogeneous time patterns
(1) (2) (3) (4) (5) (6) (7) (8)
No No No meeting with Distance Wearing More hand
walks shopping family others to others mask washing sanitising A: Health specific time patterns
chronic condition 0.031** 0.049** 0.026** 0.014 0.008 0.025** 0.013* 0.031**
[0.008] [0.007] [0.009] [0.008] [0.008] [0.007] [0.006] [0.007]
linear trend for 8 weeks -0.019 0.031* -0.092** -0.103** -0.078** 0.035* -0.024* 0.017 [0.014] [0.013] [0.017] [0.017] [0.016] [0.014] [0.012] [0.013]
chronic condition×
linear trend for 8 weeks 0.013 -0.021 0.042* 0.056** 0.034 0.015 0.027 0.007 [0.017] [0.017] [0.020] [0.019] [0.019] [0.017] [0.014] [0.015]
B: Health and age specific time patterns
chronic condition 0.037** 0.055** 0.032** 0.022* 0.007 0.025** 0.010 0.028**
[0.008] [0.008] [0.009] [0.009] [0.008] [0.008] [0.006] [0.007]
above age 70 0.103** 0.178** 0.118** 0.077** 0.004 0.001 -0.025** -0.070**
[0.008] [0.008] [0.009] [0.008] [0.008] [0.008] [0.006] [0.007]
linear trend for 8 weeks -0.009 0.057** -0.093** -0.111** -0.073** 0.037* -0.020 0.019 [0.015] [0.014] [0.018] [0.018] [0.017] [0.015] [0.012] [0.013]
up to age 70× chronic condition×
linear trend for 8 weeks -0.014 -0.053** 0.030 0.032 0.032 0.008 0.021 -0.005 [0.019] [0.018] [0.022] [0.022] [0.021] [0.018] [0.015] [0.016]
above age 70×
linear trend for 8 weeks -0.029 -0.088** -0.002 0.026 -0.031 -0.009 -0.024 -0.011 [0.023] [0.023] [0.026] [0.025] [0.026] [0.023] [0.019] [0.021]
above age 70× chronic condition×
linear trend for 8 weeks 0.050* 0.052* 0.056* 0.065** 0.057* 0.028 0.047* 0.025 [0.023] [0.024] [0.026] [0.025] [0.026] [0.023] [0.019] [0.022]
Robust standard errors in brackets, ** p<0.01, * p<0.05. Linear trend starts on 8 June and corresponds to 8 weeks. All regressions include individual level control variables and country dummies. The sample sizes are the same as in Table 2. Data:
SHARE Wave 7 Release 7.1.1, Wave 8 Release 0.0.1 beta.
4 Discussion
We analysed the time patterns of precautionary health behaviours during eight weeks of an early easing phase of the COVID-19 pandemic in Europe. The number of COVID-19 related death cases per million population decreased from 0.31 in the first week of our observation period (June 8–14) to 0.14 in the fifth week, and only went up to 0.19 by the last week (July 27 – August 2) (WHO, 2020 statistics, weighted by our sample). At the same time, governments gradually eased the COVID-19 related policy restrictions during this time period, as shown by the stringency indicator of the University of Oxford (2020). Our results suggest that the time patterns of precautionary health behaviours differ by the costliness of the behaviours. We do not see major changes in the least adapted, most costly behaviours (not going out for walks or shopping). We see decreasing patterns in the costly but more widely adapted behaviours (not meeting with family members, with others and keeping distance in public places). Note, that the decreasing patterns might be the joint consequence of the easing of restrictive policy measures, of the decrease of COVID-19 related death cases and also of changing risk attitudes and risk perceptions of individuals. It is beyond the scope of this study to disentangle these various mechanisms. Finally, the least costly behaviours are found to be the most persistent, we even see increasing patterns in wearing mask and hand sanitising.
Our analysis also revealed that individuals with a higher health risk due to chronic conditions acted differently and were more likely to take even the costly precautionary steps over the summer across all three European regions. The presence of a chronic condition led to the maintenance of more cautious behaviours especially among those above age 70, highlighting how the interaction between different risk factors drive health behaviour.
Our study is subject to some limitations. The data used refer to a specific early phase of the COVID-19 pandemic, hence it remains for future research to analyse later changes in precautionary
behaviours. Also, the analysis is based on cross-sectional data, making use of variations in the timing of the interview. Therefore, we could not analyse individual level changes in precautionary behaviours throughout the COVID-19 pandemic. A further limitation is that the sample used is not a representative sample of the population partly due to item and unit non-response, partly due to the restriction of the sample to interviews conducted during the analysed eight weeks.
Nevertheless, as the sample restrictions are not based on individual characteristics and we include a rich set of control variables in our regression models, our results likely reveal patterns that are present in the entire population of Europe. Finally, to ease the interpretation of the regression results, we estimated linear time trends of health behaviours. Specification checks indicate that adding a quadratic term of interview week to the regression models does not have substantial effect on the results.
Our results point to the divergence in the level of willingness to take different precautionary steps since subjective costs of forgoing social interactions are higher than the individual level costs of increased personal hygiene. We also observe substantial heterogeneities among older people in the level and time trends of their health behaviour as objective risk factors such as a chronic condition or older age affect the level of precaution. From a policy point of view, it is reassuring that more vulnerable people take more efforts to avoid an infection, highlighting the importance of raising awareness about the risk factors related to the pandemic. At the same time, considering the positive externalities of precautionary behaviours, it can be desirable to maintain high levels of precautions even among the less vulnerable groups. Our findings also underline that some of the older people may need more assistance, for example to do the shopping or to fight the mental health implications of loneliness and increased stress during a lockdown.
References
B¨orsch-Supan, A., M. Brandt, C. Hunkler, T. Kneip, J. Korbmacher, F. Malter, B. Schaan, S. Stuck, and S. Zuber (2013). Data resource profile: the Survey of Health, Ageing and Retirement in Europe (SHARE). International Journal of Epidemiology 42(4), 992–1001. https://doi.org/
10.1093/ije/dyt088.
Bourassa, K., D. Sbarra, A. Caspi, and T. Moffitt (2020). Social distancing as a health behavior:
County-level movement in the United States during the COVID-19 pandemic is associated with conventional health behaviors. Annals of Behavioral Medicine 54(8), 548–556. https://doi.
org/10.1093/abm/kaaa049.
B¨orsch-Supan, A. (2020a). Survey of Health, Ageing and Retirement in Europe (SHARE) Wave 8. COVID-19 Survey 1 Interview Date. Release version: 0.0.1. beta. SHARE-ERIC. https:
//doi.org/10.6103/SHARE.w8caintdbeta.001.
B¨orsch-Supan, A. (2020b). Survey of Health, Ageing and Retirement in Europe (SHARE) Wave 8.
COVID-19 Survey 1. Release version: 0.0.1. beta. SHARE-ERIC. https://doi.org/10.6103/
SHARE.w8cabeta.001.
Clark, C., A. Davila, M. Regis, and S. Kraus (2020). Predictors of COVID-19 voluntary compliance behaviors: An international investigation. Global Transitions 2, 76–82. https://doi.org/10.
1016/j.glt.2020.06.003.
Gadarian, S. K., S. W. Goodman, and T. B. Pepinsky (2020). Partisanship, health behavior, and policy attitudes in the early stages of the COVID-19 pandemic. Working Paper. https:
//doi.org/10.2139/ssrn.3562796.
Grembowski, D., D. Patrick, P. Diehr, M. Durham, S. Beresford, E. Kay, and J. Hecht (1993). Self- efficacy and health behavior among older adults. Journal of Health and Social Behavior 34(2), 89–104.
Hale, T., A. Petherick, T. Phillips, and S. Webster (2020). Variation in government responses to COVID-19. Blavatnik School of Government Working Paper 32. https://www.bsg.ox.ac.uk/
research/publications/variation-government-responses-covid-19.
Harper, C. A., L. P. Satchell, D. Fido, and R. D. Latzman (2020). Functional fear predicts public health compliance in the COVID-19 pandemic. International Journal of Mental Health and Addiction. https://doi.org/10.1007/s11469-020-00281-5.
Klusmann, V. and A. E. Kornadt (2020). Current directions in views on ageing. European Journal of Ageing 17, 383–386. https://doi.org/10.1007/s10433-020-00585-4.
Kornadt, A. E., E.-M. Kessler, S. Wurm, C. E. Bowen, M. Gabrian, and V. Klusmann (2020).
Views on ageing: a lifespan perspective. European Journal of Ageing 17, 387–401. https:
//doi.org/10.1007/s10433-019-00535-9.
Montepare, J. M. (2020). An exploration of subjective age, actual age, age awareness, and engage- ment in everyday behaviors. European Journal of Ageing 17, 299–307. https://doi.org/10.
1007/s10433-019-00534-w.
Nandy, K., A. Salunke, S. K. Pathak, A. Pandey, C. Doctor, K. Puj, M. Sharma, A. Jain, and V. Warikoo (2020). Coronavirus disease (COVID-19): A systematic review and meta-analysis to evaluate the impact of various comorbidities on serious events. Diabetes & Metabolic Syndrome:
Clinical Research & Reviews 14(5), 1017–1025. https://doi.org/10.1016/j.dsx.2020.06.
064.
OECD and European Union (2020). Health at a glance: Europe 2020: State of health in the EU cycle. OECD Publishing, Paris. https://doi.org/10.1787/82129230-en.
Richard, L., L. Gauvin, and K. Raine (2011). Ecological models revisited: their uses and evolution in health promotion over two decades. Annual Review of Public Health 32, 307–326. https:
//doi.org/10.1146/annurev-publhealth-031210-101141.
Salani´e, F. and N. Treich (2020). Public and private incentives for self-protection. The Geneva Risk and Insurance Review 45(2), 104–113. https://doi.org/10.1057/s10713-020-00050-3.
Sallis, J. F., N. Owen, and E. Fisher (2008). Ecological models of health behavior. In K. Glanz, B. Rimer, and K. Viswanath (Eds.), Health behavior: Theory, research, and practice, pp. 465–
482. Jossey-Bass.
Scherpenzeel, A., K. Axt, M. Bergmann, S. Douhou, A. Oepen, G. Sand, K. Schuller, S. Stuck, M. Wagner, and A. B¨orsch-Supan (2020). Collecting survey data among the 50+ population dur- ing the COVID-19 outbreak: The Survey of Health, Ageing and Retirement in Europe (SHARE).
Survey Research Methods 14(2), 217–221. https://doi.org/10.18148/srm/2020.v14i2.7738.
Shiina, A., T. Niitsu, O. Kobori, K. Idemoto, T. Hashimoto, T. Sasaki, Y. Igarashi, E. Shimizu, M. Nakazato, K. Hashimoto, and M. Iyo (2020). Relationship between perception and anxiety about COVID-19 infection and risk behaviors for spreading infection: A national survey in Japan. Brain, Behavior, & Immunity-Health 6, 100101. https://doi.org/10.1016/j.bbih.
2020.100101.
Ssentongo, P., A. Ssentongo, E. Heilbrunn, D. Ba, and V. Chinchilli (2020). Association of cardio- vascular disease and 10 other pre-existing comorbidities with COVID-19 mortality: A systematic
review and meta-analysis. PLoS ONE 15(8), e0238215. https://doi.org/10.1371/journal.
pone.0238215.
Thøgersen-Ntoumani, C., V. Barkoukis, C. Grano, F. Lucidi, M. Lindwall, J. Liukkonen, L. Raud- sepp, and W. Young (2011). Health and well-being profiles of older European adults. European Journal of Ageing 8, 75. https://doi.org/10.1007/s10433-011-0186-4.
University of Oxford (2020). Coronavirus Government Response Tracker. https://bsg.ox.ac.uk/
research/research-projects/coronavirus-government-response-tracker/, last accessed:
December 16, 2020.
WHO (2020). WHO Coronavirus Disease (COVID-19) Dashboard data. https://covid19.who.
int/, last accessed: December 10, 2020.
Wise, T., T. D. Zbozinek, G. Michelini, C. C. Hagan, and D. Mobbs (2020). Changes in risk perception and protective behavior during the first week of the COVID-19 pandemic in the United States. Royal Society Open Science 7, 200742. https://doi.org/10.1098/rsos.200742.
Zaki, N., H. Alashwal, and S. Ibrahim (2020). Association of hypertension, diabetes, stroke, cancer, kidney disease, and high-cholesterol with COVID-19 disease severity and fatality: A systematic review. Diabetes Metabolic Syndrome: Clinical Research Reviews 14(5), 1133–1142. https:
//doi.org/10.1016/j.dsx.2020.07.005.