https://doi.org/10.1007/s10433-021-00636-4 ORIGINAL INVESTIGATION
Time patterns of precautionary health behaviours during an easing phase of the COVID‑19 pandemic in Europe
Anikó Bíró1 · Réka Branyiczki2 · Péter Elek3
Accepted: 22 June 2021
© The Author(s), under exclusive licence to Springer Nature B.V. 2021
Abstract
Using data from the COVID-19 questionnaire of the Survey of Health, Ageing and Retirement in Europe (SHARE), we investigate the time patterns of precautionary health behaviours of individuals aged 50 years and above during the summer of 2020, an easing phase of the COVID-19 pandemic in Europe. We also examine how these health behaviours differ by the pres- ence of chronic conditions such as hypertension, high cholesterol level, heart disease, diabetes or chronic bronchitis, which can be considered as risk factors for COVID-19. Our results suggest that while on average, people became less precautious during the analysed time period, this is less so for those who are at higher risk. We also document large regional differences in precautionary health behaviours and show that higher-risk individuals are on average more cautious in all regions. We conclude that people adjusted their health behaviours in line with the generally understood risk of the COVID-19 disease.
At the same time, our results also point out divergences in the level of willingness to take different precautionary steps.
Keywords COVID-19 · Health risk · Precautionary behaviours · SHARE data
Introduction
Until a sufficiently large share of the population becomes vaccinated, changing individual behaviour is key to contain the spread of COVID-19. Accordingly, some of our every- day activities have changed drastically since the outbreak of the pandemic as governments urged citizens to take precau- tionary steps, stemming from recommending hand sanitis- ing and mandating wearing a mask in public to staying at home, often forced by a curfew. Using data from the Survey of Health, Ageing and Retirement in Europe (SHARE), we investigate the time patterns of several precautionary health behaviours among the European population above age 50 years during the summer (June and July) of 2020. We can consider this period as an easing phase of the COVID-19
pandemic since it falls between the “first wave” (spring of 2020) and the “second wave” (autumn of 2020). Although there were heterogeneities across countries, average death rates due to COVID-19 slightly decreased (WHO 2020) and COVID-19-related policies became on average less stringent (Hale et al. 2021) over this period.
We assess how precautionary health behaviours are shaped by the presence of chronic diseases across European regions. Do we see that cautious behaviour of older people is spreading or is it rather fading over time? Are there any differences based on health status in the precautionary steps they take and the time pattern of such steps? Given the sub- stantially larger COVID-19 mortality risk of older people (it was 3.7 times higher in the age group above 60/65 years than in the general population; also, 90 per cent or more of reported COVID-19 deaths occurred in this age group dur- ing the first wave of the pandemic in European countries, see OECD and European Union 2020, p. 55.), especially of those suffering from chronic diseases, it is important to understand the dynamics of different health behaviours to curb the number of fatalities due to the virus.
Drivers of health behaviour are complex; ecological mod- els provide a comprehensive framework of the multiple and interacting levels of factors that influence health behaviour, grouped into intrapersonal, interpersonal, organisational,
Responsible Editor: Matthias Kliegel.
* Anikó Bíró biro.aniko@krtk.hu
1 Centre for Economic and Regional Studies, Budapest, Hungary
2 Central European University and TÁRKI, Budapest, Hungary
3 Centre for Economic and Regional Studies and Corvinus University of Budapest, Budapest, Hungary
community and public policy levels (Sallis et al. 2008; Rich- ard et al. 2011). Given the substantial negative externalities arising from irresponsible individual behaviour during a pandemic, governments introduced restrictions of individual behaviour in most European countries with varying levels of policy stringency (Hale et al. 2021). Apart from policy stringency, the likelihood of compliant behaviour also varies both across and within countries. Accordingly, some of the recent scholarly attention has focused on understanding the factors behind adhering to cautious health behaviour under COVID-19. The assessed factors are diverse, and the results are mixed, and some found that in the USA partisanship is the single most consistent factor that differentiates health behaviours (Gadarian et al. 2020), and others (Harper et al.
2020) found no effect of politically relevant variables and named simply the fear of COVID-19 as the predictor of posi- tive behaviour change, i.e. of improved hand hygiene and physical distancing (or, using the terminology of Harper et al. social distancing). Wise et al. (2020) also reported that the strongest predictor of physical distancing was the per- ceived likelihood of personally being infected. A Japanese study highlights the importance of awareness and knowledge as being informed about COVID-19 was associated with a more precautious behaviour (Shiina et al. 2020). Based on a sample of students in Switzerland, Franzen and Wöhner (2021) found that personal interests in staying at home (i.e.
having high-risk relatives) increased compliance. Clark et al.
(2020) observed that belief in the effectiveness of health pre- cautions against COVID-19 and prioritising one’s health in general made a difference. Similarly, Bourassa et al. (2020) demonstrated that physical distancing is associated with con- ventional health behaviours and healthier habits in general.
The rapidly expanding COVID literature has yet collected less evidence specifically about the behaviour of older peo- ple, though Clark et al. (2020) found that age was gener- ally unrelated to voluntary compliant behaviours during the pandemic. In general, the public discourse during the pandemic characterised older people as a rather homogene- ous vulnerable group that society needs to protect even at the cost of sacrificing much of their social life and that of other generations as well (Klusmann and Kornadt 2020).
Although the ageing process and older people are diverse, their health status, attitudes and behaviour vary (Thøgersen- Ntoumani et al. 2011). For instance, not only actual age but positive views on ageing in general and a younger subjec- tive age (or a more youthful identity) are often associated with health-promoting activities, such as walking (Kornadt et al. 2020; Montepare, 2020). Similarly, self-efficacy, in other words perceived competency, has a beneficial effect on health behaviour, and it may explain part of the rela- tionship between socio-economic status and health status (Grembowski et al. 1993). Apart from diverging attitudes, the health status of older people varies as well. For example,
there are profound disparities in the prevalence of chronic diseases in the European Union by socio-economic sta- tus (OECD and European Union 2020). Thus, it is worth studying the heterogeneities of the older age group to better understand their behaviour.
Our simple theoretical framework of individual-level drivers of health behaviour covers the perceived probability of getting infected and the perceived health risk of an infec- tion, which together influence the general level of risk aver- sion related to COVID-19. Then, deciding about each pre- cautionary step involves a subjective cost–benefit analysis of the behaviour shift. Note that some precautionary behav- iours, such as wearing a mask, can have positive externalities by reducing the risk of infecting others (Salanié and Treich 2020). Here, we assume that people take into account only the subjective cost and benefit of each precautionary step, which might include an altruistic motive. We suspect that the perceived health risk is influenced by objective (or well- established) risk factors, such as age, chronic diseases and being a male that are all positively related to the health risk imposed by COVID-19 (Ssentongo et al. 2020; O’Driscoll et al. 2021), and by the knowledge and awareness of these risk factors, which are usually associated with educational level. Regarding the individual-level cost–benefit analysis of changing a behaviour, we have several considerations.
First, some precautionary steps are in general less costly than others (i.e. hand washing vs. not meeting family) and thus we expect them to be more widespread. Second, the same precautionary step may impose different levels of costs to different people. For example, we expect that those who are employed and those who live alone are less likely to stay at home and to give up personal social interactions as that would mean a larger sacrifice from them.
We contribute to the existing literature about health behavioural responses to a pandemic by focusing on the risk group of older people and the role of their health status.
Given the large sample size and variation in interview times, we are also able to demonstrate time trends of average levels of precaution, and we show regional differences in precau- tionary behaviour across Europe, indicative of the role of the cultural and policy context.
Our paper is structured as follows. First, we briefly introduce the data and the health behaviour, health status and control variables we use. Then, we show the time pat- terns of different health behaviours over the summer, both together and separately for individuals with and without a chronic condition. We also demonstrate regional differences of health behaviour, while keeping the decomposition by chronic condition. Finally, we turn to our linear probability models of different health behaviour changes, where next to the baseline associations some of the regressions allow differing time trends of behaviour by health status and age.
We conclude with discussing our results.
Methods
DataOur analysis is primarily based on the SHARE-COVID-19 data (Börsch-Supan 2020a, b). We restrict the SHARE- COVID-19 sample to those observations that were recorded during the eight weeks between 8 June 2020 and 2 August 2020. Thus, we exclude the last three weeks of the SHARE-COVID-19 fieldwork when relatively few interviews were conducted (omitting 4.5% of the sample or 2593 observations, 61.9% of them being from a single country, Austria). Also, the education indicator—which comes from the SHARE Wave 7 data, see below—is miss- ing for 7496 observations. Taking into account the small number of item non-responses, the final sample size used in the analyses is 46,040 from 26 European countries and Israel. (The Netherlands cannot be included in the analysis due to not participating in SHARE Wave 7.) The included countries are Austria, Belgium, Bulgaria, Croatia, Cyprus, Czech Republic, Denmark, Estonia, Finland, France, Ger- many, Greece, Hungary, Israel, Italy, Latvia, Lithuania, Luxembourg, Malta, Poland, Portugal, Romania, Slovakia, Slovenia, Spain, Sweden and Switzerland.
The variables that are in the focus of our analysis are eight indicators of health behaviour from the SHARE- COVID-19 survey. They capture how people changed their health behaviours in response to the outbreak of the COVID-19 pandemic. To ease the interpretation of the results, we dichotomise all eight indicators as follows. (1) No walks equals one if someone has not left home since the outbreak or responds “not any more” to the question whether he/she went out for a walk since the outbreak, zero otherwise. (2) No shopping equals one if someone has not left home since the outbreak or responds “not any more” to the question about going shopping since the out- break, zero otherwise. (3) No meeting with family equals one if someone has not left home since the outbreak or responds “not any more” to the question about visiting other family members since the outbreak, zero otherwise.
(4) No meeting with others equals one if someone has not left home since the outbreak or responds “not any more” to the question about meeting more than five people outside the household since outbreak, zero otherwise. (5) Distance to others equals one if someone responds “always” to the question about keeping distance from others in public. (6) Wearing mask equals one if someone responds “always”
to the question about wearing a face mask in public. (The latter two variables are not defined for those who have not left home since the outbreak, around 18% of the sample.) (7) More hand washing equals one if someone responds
“yes” to the question about washing hands more than
usual. (8) More hand sanitising equals one if someone responds “yes” to the question about using hand sanitiser or disinfection fluids more than usual.
To capture the health status and COVID-19 risk of indi- viduals, we use binary indicators of drugs taken regularly for high blood cholesterol, high blood pressure, heart dis- ease (including coronary or cerebrovascular diseases and other heart diseases), diabetes and chronic bronchitis. These are well-established risk factors for COVID-19 severity and mortality (see e.g. the meta-analyses Nandy et al. 2020;
Ssentongo et al. 2020; Zaki et al. 2020; there is some disa- greement on the effect of chronic bronchitis but its pres- ence definitely increases the perceived risk). We classify a respondent as high risk (66.5% of the sample) if he/she takes drugs regularly for any of the above-listed conditions.
In addition, we use the risk factors for overweight (BMI 25–29.9) and obesity (BMI 30 and above) from SHARE Wave 7 as control variables.
The demographic and socio-economic control variables are the following. We use gender and age, the latter split into four similar sized categories (age up to 63, 64–70, 71–76 and above 76), or simply into two categories (cut at 70 years) in some analyses (47.6% of the sample is above 70 years). We generate a binary indicator of being employed (including self-employment) at the time of the COVID-19 outbreak and a binary indicator of living alone (i.e. of the household size being equal to one, which was asked in Wave 8 and is imputed from Wave 7 if it is missing there). Finally, based on ISCED-97 (International Standard Classification of Educa- tion) codes in the SHARE Wave 7 data, we create three cat- egories of education level: primary, secondary and tertiary education (ISCED-97 levels 0–1, 2–4 and 5–6, respectively).
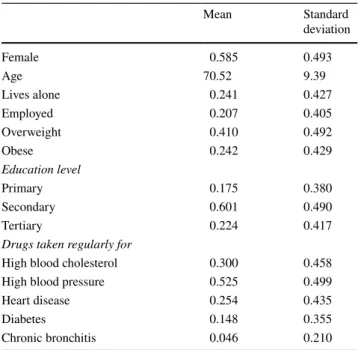
Table 1 shows descriptive statistics of the demographic, socio-economic and health indicators.
Analytic approach
As a starting point, we display the weekly averages of the eight indicators of health behaviour during the eight exam- ined weeks. In doing so, we net out country effects because different countries conducted the survey at different pace during the summer. Afterwards, we show the weekly aver- ages separately for those with at least one chronic condition and those without any.
Next, to illustrate the regional differences in health behaviour during our analysed period, we split the Euro- pean SHARE countries into three groups: West and North (Austria, Belgium, Denmark, Finland, France, Germany, Luxembourg, Sweden, Switzerland), South (Cyprus, Greece, Italy, Malta, Portugal, Spain) and East (Bulgaria, the Czech Republic, Croatia, Estonia, Hungary, Latvia, Lithuania, Poland, Romania, Slovakia, Slovenia). For each country group, we show the average of the eight indicators
of health behaviour separately for those with and without the presence of at least one chronic condition.
A limitation of the descriptive approach is that the interview date is not random; thus, the observed time pat- terns might partly be driven by composition changes of the respondents. To address this issue, we apply regression models, controlling for a rich set of individual characteris- tics that might be related both to health behaviours and to interview timing. We fit linear probability models of the eight health behaviour indicators using a linear time trend, the presence of the five specific chronic conditions, gen- der, age, education level, employment status at the time of the outbreak, the binary variable of living alone and coun- try indicators (fixed effects) as explanatory variables. The results do not change qualitatively if logit models are used instead. To check for the presence of nonlinear time trends, we re-estimate the regression models with replacing the linear time trend with bi-weekly interview week effects.
To examine the presence of differential time trends across health status, we also estimate linear probability models that contain the interaction term between hav- ing (at least one) chronic condition and the time trend.
Besides, to analyse specifically whether the different time trends by health status arise from the relatively older or the younger population, we also estimate models with three- way interaction terms between the presence of chronic conditions, the time trend and the binary indicator of being above 70 years old.
All analyses were performed with Stata Statistical Soft- ware: Release 16. College Station, TX: StataCorp LLC.
Results
Time patterns of health behaviours
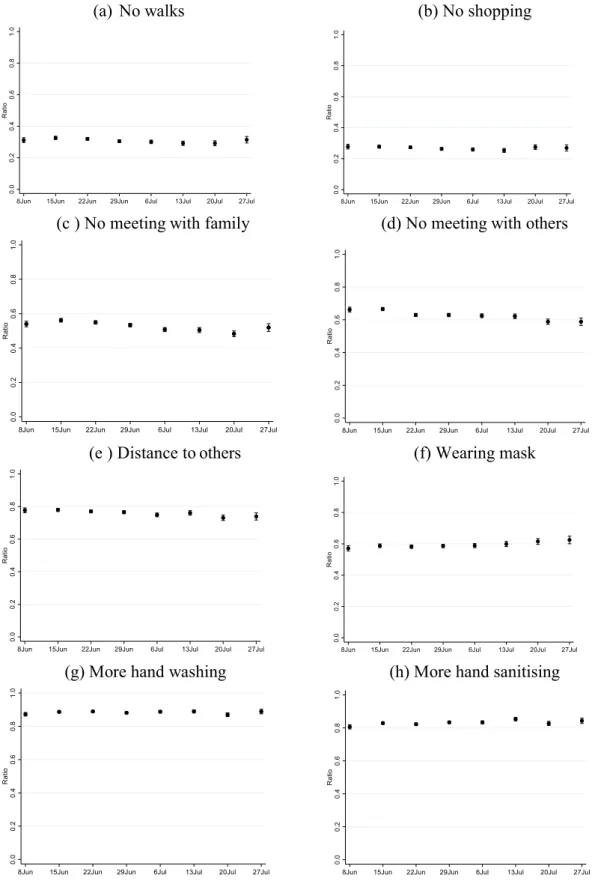
According to Fig. 1, on average, around 85% of respond- ents washed hands and the same proportion used hand san- itiser or disinfection fluids more than usual after the start of the pandemic. Also, if leaving their home, 76% always kept distance and 59% always wore a face mask in public.
Fifty-three per cent of respondents stayed at home or did not visit other family members and 63% did not meet more than five people outside the household since the outbreak.
(These two indicators will be referred to as “no meeting”
indicators below.) Even the most substantial changes in health behaviour—never leaving home for walking and for shopping since the outbreak—were reported by 31% and 27%, respectively. A gradual loosening of the behavioural changes during the eight examined weeks is especially visible for the two “no meeting” and the “distance in pub- lic” indicators. Meanwhile, the proportion of those who always wear a mask in public or use sanitiser more often seem to increase.
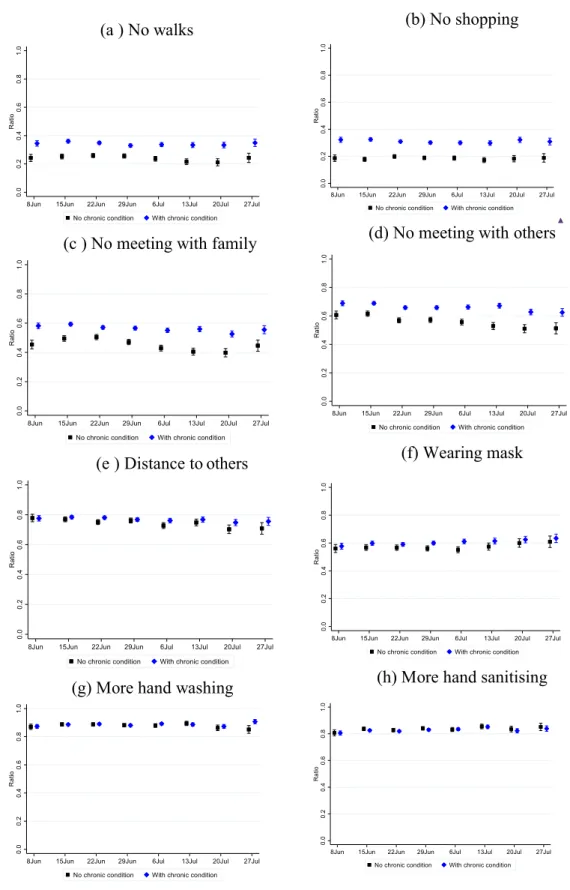
Figure 2 shows these descriptive time trends split by the health status of the respondents. People with chronic conditions were in general more cautious. The differences by health status are the strongest for the no walks, no shop- ping and the two “no meeting” indicators, while negligible for hand washing and hand sanitising. The graphs also indicate that regarding the two “no meeting” measures, people with chronic conditions—compared to healthy respondents—rather kept their cautiousness during the summer. For the other measures, we do not see clear evi- dence for diverging time patterns by health status.
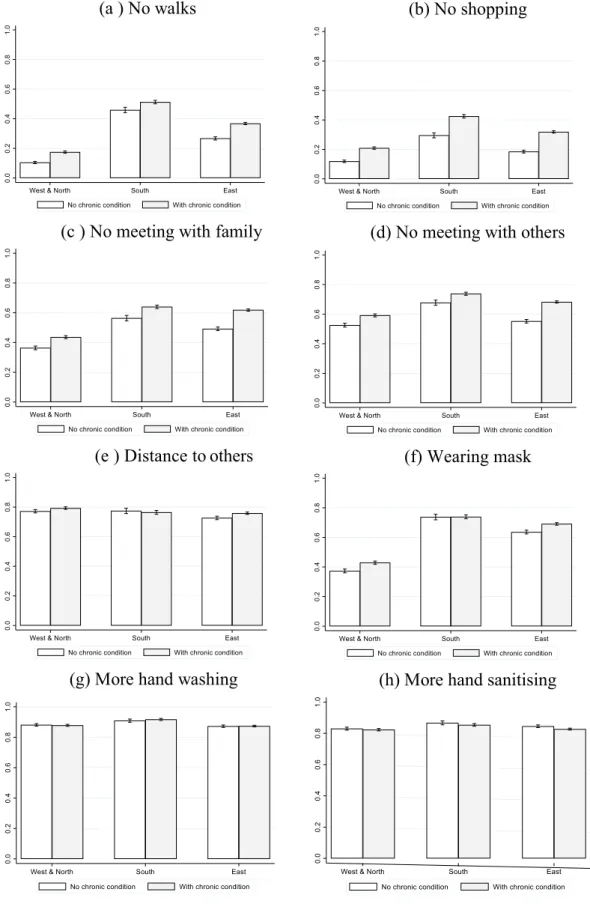
Figure 3 displays the average values of the health behaviour indicators by country groups and health sta- tus. Within each country group and for each indicator, we again see that people with chronic conditions were more careful. The differences by health status are the strongest for the no walks, no shopping and the two “no meeting”
indicators, while they are negligible for hand washing and hand sanitising. We also see that on average, people in Western and Northern Europe were the least cautious dur- ing the analysed period, especially about going for walks, shopping, meeting with family members and wearing masks. We do not see major differences in precautionary health behaviours between Southern and Eastern Europe, although some of them are slightly more prevalent in the South than in the East.
Table 1 Descriptive statistics
Sample size: 46,040. The age indicator ranges between 23 and 105 years, with 99.5% being 50 and above. The other variables are binary indicators with values 0 or 1. Data: SHARE Wave 7 Release 7.1.1 and Wave 8 Release 0.0.1 beta
Mean Standard
deviation
Female 0.585 0.493
Age 70.52 9.39
Lives alone 0.241 0.427
Employed 0.207 0.405
Overweight 0.410 0.492
Obese 0.242 0.429
Education level
Primary 0.175 0.380
Secondary 0.601 0.490
Tertiary 0.224 0.417
Drugs taken regularly for
High blood cholesterol 0.300 0.458
High blood pressure 0.525 0.499
Heart disease 0.254 0.435
Diabetes 0.148 0.355
Chronic bronchitis 0.046 0.210
(a) No walks (b) No shopping
(c ) No meeting with family (d) No meeting with others
(e ) Distance to others (f) Wearing mask
(g) More hand washing (h) More hand sanitising
Note: Mean with 95% confidence interval. Country effects are netted out. Data: SHARE Wave 8 Release 0.0.1 beta.
Fig. 1 Time patterns of health behaviours
(a ) No walks (b) No shopping
(c ) No meeting with family (d) No meeting with others
(e ) Distance to others (f) Wearing mask
(g) More hand washing (h) More hand sanitising
Note: Mean with 95% confidence interval. Country effects are netted out. Data: SHARE Wave 8 Release 0.0.1 beta.
Fig. 2 Health behaviours by chronic condition
(a ) No walks (b) No shopping
(c ) No meeting with family (d) No meeting with others
(e ) Distance to others (f) Wearing mask
(g) More hand washing (h) More hand sanitising
Note: Mean with 95% confidence interval. Data: SHARE Wave 8 Release 0.0.1 beta.
Fig. 3 Health behaviours by country groups and chronic condition
Regression results
Turning to the regression results, we first note that our main health behaviour indicators will be the first four measures (“no walks”, “no shopping” and the “no meeting” indica- tors) because the “distance” and the “mask” variables are only defined on the selected sample of those who responded
that they left their home since the outbreak, while “hand washing” and “hand sanitising” seem the least costly interventions and were performed by the vast majority of respondents.
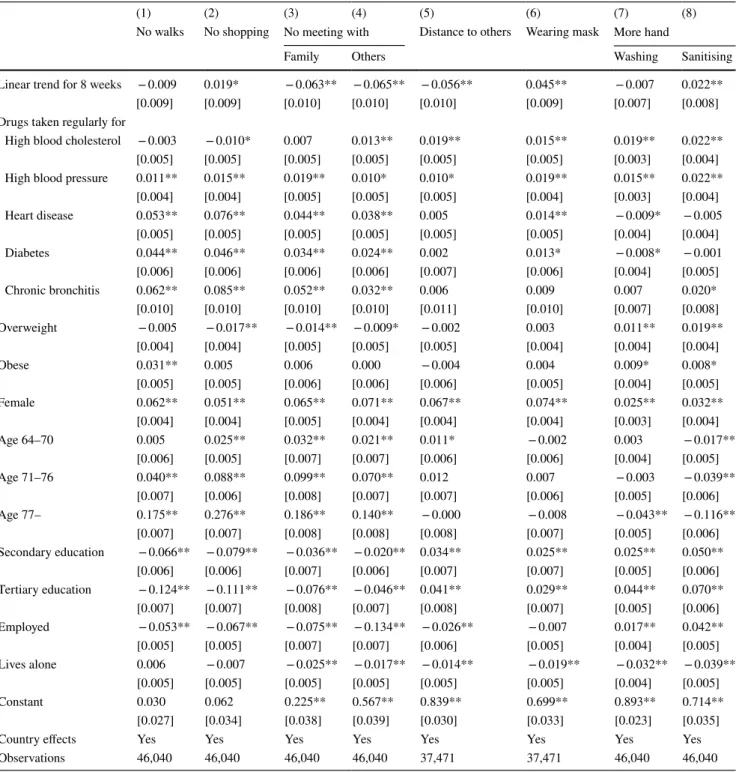
Table 2 displays the effect of specific chronic conditions and the time trend after controlling for individual character- istics and country indicators. Diagnosed hypertension and
Table 2 Linear probability models of health behaviours
Robust standard errors in brackets, **p < 0.01, *p < 0.05. Linear trend starts on 8 June and corresponds to 8 weeks. Data: SHARE Wave 7 Release 7.1.1 and Wave 8 Release 0.0.1 beta
(1) (2) (3) (4) (5) (6) (7) (8)
No walks No shopping No meeting with Distance to others Wearing mask More hand
Family Others Washing Sanitising
Linear trend for 8 weeks − 0.009 0.019* − 0.063** − 0.065** − 0.056** 0.045** − 0.007 0.022**
[0.009] [0.009] [0.010] [0.010] [0.010] [0.009] [0.007] [0.008]
Drugs taken regularly for
High blood cholesterol − 0.003 − 0.010* 0.007 0.013** 0.019** 0.015** 0.019** 0.022**
[0.005] [0.005] [0.005] [0.005] [0.005] [0.005] [0.003] [0.004]
High blood pressure 0.011** 0.015** 0.019** 0.010* 0.010* 0.019** 0.015** 0.022**
[0.004] [0.004] [0.005] [0.005] [0.005] [0.004] [0.003] [0.004]
Heart disease 0.053** 0.076** 0.044** 0.038** 0.005 0.014** − 0.009* − 0.005
[0.005] [0.005] [0.005] [0.005] [0.005] [0.005] [0.004] [0.004]
Diabetes 0.044** 0.046** 0.034** 0.024** 0.002 0.013* − 0.008* − 0.001
[0.006] [0.006] [0.006] [0.006] [0.007] [0.006] [0.004] [0.005]
Chronic bronchitis 0.062** 0.085** 0.052** 0.032** 0.006 0.009 0.007 0.020*
[0.010] [0.010] [0.010] [0.010] [0.011] [0.010] [0.007] [0.008]
Overweight − 0.005 − 0.017** − 0.014** − 0.009* − 0.002 0.003 0.011** 0.019**
[0.004] [0.004] [0.005] [0.005] [0.005] [0.004] [0.004] [0.004]
Obese 0.031** 0.005 0.006 0.000 − 0.004 0.004 0.009* 0.008*
[0.005] [0.005] [0.006] [0.006] [0.006] [0.005] [0.004] [0.005]
Female 0.062** 0.051** 0.065** 0.071** 0.067** 0.074** 0.025** 0.032**
[0.004] [0.004] [0.005] [0.004] [0.004] [0.004] [0.003] [0.004]
Age 64–70 0.005 0.025** 0.032** 0.021** 0.011* − 0.002 0.003 − 0.017**
[0.006] [0.005] [0.007] [0.007] [0.006] [0.006] [0.004] [0.005]
Age 71–76 0.040** 0.088** 0.099** 0.070** 0.012 0.007 − 0.003 − 0.039**
[0.007] [0.006] [0.008] [0.007] [0.007] [0.006] [0.005] [0.006]
Age 77– 0.175** 0.276** 0.186** 0.140** − 0.000 − 0.008 − 0.043** − 0.116**
[0.007] [0.007] [0.008] [0.008] [0.008] [0.007] [0.005] [0.006]
Secondary education − 0.066** − 0.079** − 0.036** − 0.020** 0.034** 0.025** 0.025** 0.050**
[0.006] [0.006] [0.007] [0.006] [0.007] [0.007] [0.005] [0.006]
Tertiary education − 0.124** − 0.111** − 0.076** − 0.046** 0.041** 0.029** 0.044** 0.070**
[0.007] [0.007] [0.008] [0.007] [0.008] [0.007] [0.005] [0.006]
Employed − 0.053** − 0.067** − 0.075** − 0.134** − 0.026** − 0.007 0.017** 0.042**
[0.005] [0.005] [0.007] [0.007] [0.006] [0.005] [0.004] [0.005]
Lives alone 0.006 − 0.007 − 0.025** − 0.017** − 0.014** − 0.019** − 0.032** − 0.039**
[0.005] [0.005] [0.005] [0.005] [0.005] [0.005] [0.004] [0.005]
Constant 0.030 0.062 0.225** 0.567** 0.839** 0.699** 0.893** 0.714**
[0.027] [0.034] [0.038] [0.039] [0.030] [0.033] [0.023] [0.035]
Country effects Yes Yes Yes Yes Yes Yes Yes Yes
Observations 46,040 46,040 46,040 46,040 37,471 37,471 46,040 46,040
high blood cholesterol increase the prevalence of precau- tionary health behaviour measures generally by 1–2%points, while the more severe conditions (heart disease, diabetes and chronic bronchitis) increase the first four (main) indica- tors by 2–9%points but do not generally have a substantial effect on the other four measures. On the other hand, apart from the hand washing and hand sanitising indicators, being overweight or obese does not unequivocally imply more cautiousness.
In line with the descriptive graphs, the “no meeting”
and the “distance” indicators decrease in time (by around 6%points during the eight examined weeks), while the preva- lence of wearing masks and more hand sanitising increases (statistically significantly at the 1% level) by 2–5%points during the period.
The effects of the control variables are roughly in line with the theoretical framework presented in “Introduction.”
Older people are more severely affected by the disease and are more risk averse; hence, their health behaviour changed more substantially for the main indicators. Compared to people aged 50–63 (plus a few individuals aged under 50), the no walks, no shopping and no meeting indicators are 0–3%points higher at ages 64–70, 4–10%points higher at ages 71–76 and 14–28%points higher at ages 77 and above.
We do not see such differences by age for the “distance”,
“mask” and “hand washing” indicators, while the preva- lence of hand sanitising even decreases with age. Females, although face smaller objective risk, are more risk averse, and their indicators are 2–7%points higher than those of males. The effect of the level of education is ambiguous as it decreases the main indicators and increases the others.
Finally, since the employed have more social interactions in any case and people living alone need more social inter- actions to maintain their everyday activities, both groups changed their health behaviour less radically (apart from the “hand washing” and “hand sanitising” indicators for the employed).
To assess nonlinear time effects, we include indicators of bi-weekly interview dates instead of the linear trend. Table 3 shows a gradual decrease of up to 4–6%points in the preva- lence of the “no meeting” and “distance” indicators and a gradual increase of up to 3.3%points in the prevalence of wearing masks. We see some evidence for nonlinear time patterns in the other four behavioural indicators; however, the magnitudes of the estimated time effects on these out- comes are small (at most 2.2%points).
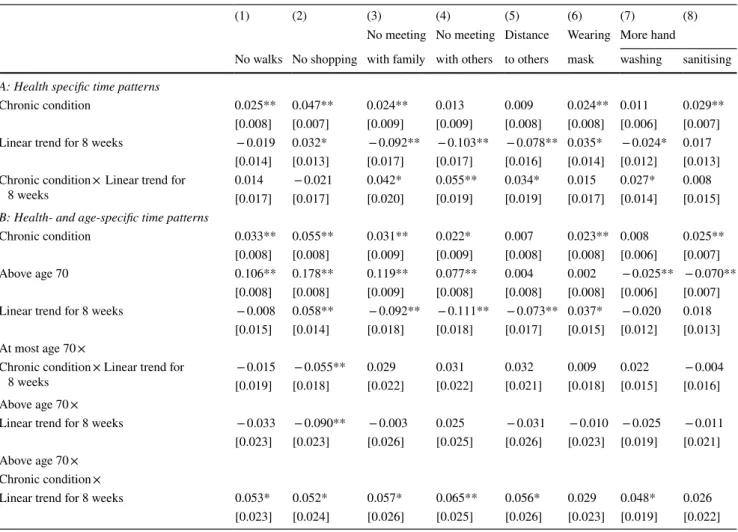
Table 4 displays the estimation results from models that allow differing time trends by health status. The two “no meeting” and the “distance to others” indicators show sig- nificant heterogeneities in their trends: they decreased by 8–10%points in the eight weeks for the healthy and only by 4–5% points for the chronically ill population. Also, hand washing became less prevalent only in the healthy group.
As the lower panel of the table indicates, heterogeneity by health status is more substantial (and statistically significant for six out of the eight indicators) for the population aged 70 years or above.
Discussion
We analysed the time patterns of precautionary health behaviours during eight weeks of an early easing phase of the COVID-19 pandemic in Europe. The number of COVID- 19-related death cases per million population decreased from 0.31 in the first week of our observation period (June 8–14) to 0.14 in the fifth week and only went up to 0.19 by the last week (July 27–August 2) (WHO, 2020 statistics, weighted by our sample). At the same time, governments gradually eased the COVID-19-related policy restrictions during this time period, as shown by the stringency indicator of the University of Oxford (Hale et al. 2021). Our results suggest that the time patterns of precautionary health behaviours differ by the costliness of the behaviours. We do not see
Table 3 Linear probability models of health behaviours with bi-weekly interview time effects
Robust standard errors in brackets, **p < 0.01, *p < 0.05. All regressions include the individual-level control variables and country dummies of Table 2. The sample sizes are the same as in Table 2. Data: SHARE Wave 7 Release 7.1.1 and Wave 8 Release 0.0.1 beta
(1) (2) (3) (4) (5) (6) (7) (8)
No meeting No meeting Distance Wearing More hand
No walks No shopping with family with others to others mask washing sanitising Reference interview dates: 8 June–21 June
22 June–5 July − 0.004 − 0.002 − 0.009 − 0.032** − 0.011 0.003 0.002 0.004
[0.005] [0.005] [0.006] [0.006] [0.006] [0.005] [0.004] [0.005]
6 July–19 July − 0.011 − 0.002 − 0.037** − 0.031** − 0.025** 0.012* 0.003 0.014**
[0.006] [0.006] [0.007] [0.006] [0.006] [0.006] [0.004] [0.005]
20 July–2 August − 0.003 0.022** − 0.043** − 0.060** − 0.045** 0.033** − 0.010 0.002
[0.007] [0.007] [0.008] [0.008] [0.008] [0.007] [0.006] [0.006]
major changes in the least adapted, most costly behaviours (not going out for walks or shopping). We see decreasing patterns in the costly but more widely adapted behaviours (not meeting with family members, with others and keeping distance in public places). Note that the decreasing patterns might be the joint consequence of the easing of restrictive policy measures, of the decrease of COVID-19-related death cases and also of changing risk attitudes and risk perceptions of individuals. It is beyond the scope of this study to disen- tangle these various mechanisms. Finally, the least costly behaviours are found to be the most persistent; we even see increasing patterns in wearing mask and hand sanitising.
Our analysis also revealed that individuals with a higher health risk due to chronic conditions acted differently and were more likely to take even the costly precautionary steps over the summer across all three European regions. On average, people in Western and Northern Europe were the least cautious during the analysed period. The regional dif- ferences cannot be explained by differences in the rate of
COVID-19-related death cases or policy stringency as, on average, Western and Northern Europe is characterised by similar cumulative COVID-19-related death rates (as meas- ured by WHO 2020) and stringency indicators (as measured by Hale et al. 2021) as Southern Europe. Also, precautionary behaviours were rather similar in the East and South, despite the lower COVID-19-related death rates and stringency in the East.
The presence of a chronic condition led to the mainte- nance of more cautious behaviours especially among those above age 70 years, highlighting how the interaction between different risk factors drives health behaviour.
Our study is subject to some limitations. The data used refer to a specific early phase of the COVID-19 pan- demic; hence, it remains for future research to analyse later changes in precautionary behaviours. Also, the analysis is based on cross-sectional data, making use of variations in the timing of the interview. Therefore, we could not ana- lyse individual-level changes in precautionary behaviours
Table 4 Linear probability models of health behaviours with heterogeneous time patterns
Robust standard errors in brackets, **p < 0.01, *p < 0.05. Linear trend starts on 8 June and corresponds to 8 weeks. All regressions include individual-level control variables and country dummies. The sample sizes are the same as in Table 2. Data: SHARE Wave 7 Release 7.1.1 and Wave 8 Release 0.0.1 beta
(1) (2) (3) (4) (5) (6) (7) (8)
No meeting No meeting Distance Wearing More hand
No walks No shopping with family with others to others mask washing sanitising A: Health specific time patterns
Chronic condition 0.025** 0.047** 0.024** 0.013 0.009 0.024** 0.011 0.029**
[0.008] [0.007] [0.009] [0.009] [0.008] [0.008] [0.006] [0.007]
Linear trend for 8 weeks − 0.019 0.032* − 0.092** − 0.103** − 0.078** 0.035* − 0.024* 0.017 [0.014] [0.013] [0.017] [0.017] [0.016] [0.014] [0.012] [0.013]
Chronic condition × Linear trend for
8 weeks 0.014 − 0.021 0.042* 0.055** 0.034* 0.015 0.027* 0.008
[0.017] [0.017] [0.020] [0.019] [0.019] [0.017] [0.014] [0.015]
B: Health- and age-specific time patterns
Chronic condition 0.033** 0.055** 0.031** 0.022* 0.007 0.023** 0.008 0.025**
[0.008] [0.008] [0.009] [0.009] [0.008] [0.008] [0.006] [0.007]
Above age 70 0.106** 0.178** 0.119** 0.077** 0.004 0.002 − 0.025** − 0.070**
[0.008] [0.008] [0.009] [0.008] [0.008] [0.008] [0.006] [0.007]
Linear trend for 8 weeks − 0.008 0.058** − 0.092** − 0.111** − 0.073** 0.037* − 0.020 0.018 [0.015] [0.014] [0.018] [0.018] [0.017] [0.015] [0.012] [0.013]
At most age 70 ×
Chronic condition × Linear trend for
8 weeks − 0.015 − 0.055** 0.029 0.031 0.032 0.009 0.022 − 0.004
[0.019] [0.018] [0.022] [0.022] [0.021] [0.018] [0.015] [0.016]
Above age 70 ×
Linear trend for 8 weeks − 0.033 − 0.090** − 0.003 0.025 − 0.031 − 0.010 − 0.025 − 0.011 [0.023] [0.023] [0.026] [0.025] [0.026] [0.023] [0.019] [0.021]
Above age 70 × Chronic condition ×
Linear trend for 8 weeks 0.053* 0.052* 0.057* 0.065** 0.056* 0.029 0.048* 0.026
[0.023] [0.024] [0.026] [0.025] [0.026] [0.023] [0.019] [0.022]
throughout the COVID-19 pandemic. A further limitation is that the sample used is not a representative sample of the population partly due to item and unit non-response, partly due to the restriction of the sample to interviews conducted during the analysed eight weeks. Nevertheless, as the sample restrictions are not based on individual char- acteristics and we include a rich set of control variables in our regression models, our results likely reveal pat- terns that are present in the entire population of Europe.
The main results are robust to the exclusion of the first two weeks of the fieldwork from the analysis, when some countries had not started the fieldwork yet. Also, specifica- tion checks indicate that estimating bi-weekly interview week effects instead of the linear time effect in our regres- sion models does not alter substantially the results.
Our findings point to the divergence in the level of will- ingness to take different precautionary steps since subjec- tive costs of forgoing social interactions are higher than the individual-level costs of increased personal hygiene.
We also observe substantial heterogeneities among older people in the level and time trends of their health behav- iour as objective risk factors such as a chronic condition or older age affect the level of precaution. From a policy point of view, it is reassuring that more vulnerable peo- ple take more efforts to avoid an infection, highlighting the importance of raising awareness about the risk factors related to the pandemic. At the same time, considering the positive externalities of precautionary behaviours, it can be desirable to maintain high levels of precautions even among the less vulnerable groups. Our findings also underline that some of the older people may need more assistance, for example to do the shopping or to fight the mental health implications of loneliness and increased stress during a lockdown.
Acknowledgements This paper uses data from SHARE Waves 7 and 8 (DOIs: https:// doi. org/ 10. 6103/ SHARE. w7. 711, https:// doi.
org/ 10. 6103/ SHARE. w8cab eta. 001), see Börsch-Supan et al. (2013) and Scherpenzeel et al. (2020) for methodological details. The SHARE data collection has been funded by the European Commis- sion through FP5 (QLK6-CT-2001-00360), FP6 (SHARE-I3: RII- CT-2006-062193, COMPARE: CIT5-CT-2005-028857, SHARE- LIFE: CIT4-CT-2006-028812), FP7 (SHARE-PREP: GA No211909, SHARE-LEAP: GA No227822, SHARE M4: GA No261982, DASISH:
GA No283646) and Horizon 2020 (SHARE-DEV3: GA No676536, SHARE-COHESION: GA No870628, SERISS: GA No654221, SSHOC: GA No823782) and by DG Employment, Social Affairs &
Inclusion. Additional funding from the German Ministry of Education and Research, the Max Planck Society for the Advancement of Sci- ence, the U.S. National Institute on Aging (U01_AG09740-13S2, P01_
AG005842, P01_AG08291, P30_AG12815, R21_AG025169, Y1-AG- 4553-01, IAG_BSR06-11, OGHA_04-064, HHSN271201300071C) and from various national funding sources is gratefully acknowledged (see www. share- proje ct. org).
Funding Bíró, Branyiczki and Elek were supported by the “Lend- ület” program of the Hungarian Academy of Sciences (grant number:
LP2018-2/2018). Elek was supported by the János Bolyai Research Scholarship of the Hungarian Academy of Sciences.
Declaration
Conflicts of interest The authors declare that they have no conflict of interest.
References
Börsch-Supan, A. (2020a). Survey of Health, Ageing and Retirement in Europe (SHARE) wave8. COVID-19 survey 1 interview date.
Release version: 0.0.1. beta. SHARE-ERIC. https:// doi. org/ 10.
6103/ SHARE. w8cai ntdbe ta. 001.
Börsch-Supan, A. (2020b). Survey of health, ageing and retirement in Europe (SHARE) wave 8. COVID-19 survey 1. Release ver- sion: 0.0.1. beta. SHARE-ERIC. https:// doi. org/ 10. 6103/ SHARE.
w8cab eta. 001.
Börsch-Supan A, Brandt M, Hunkler C, Kneip T, Korbmacher J, Malter F, Schaan B, Stuck S, Zuber S (2013) Data resource profile: the survey of health, ageing and retirement in europe (SHARE). Int J Epidemiol 42(4):992–1001. https:// doi. org/ 10. 1093/ ije/ dyt088 Bourassa K, Sbarra D, Caspi A, Moffitt T (2020) Social distancing as
a health behavior: County-level movement in the United States during the COVID-19 pandemic is associated with conventional health behaviors. Ann Behav Med 54(8):548–556. https:// doi. org/
10. 1093/ abm/ kaaa0 49
Clark C, Davila A, Regis M, Kraus S (2020) Predictors of COVID-19 voluntary compliance behaviors: an international investigation.
Glob Transit 2:76–82. https:// doi. org/ 10. 1016/j. glt. 2020. 06. 003 Franzen A, Wöhner F (2021) Coronavirus risk perception and compli-
ance with social distancing measures in a sample of young adults:
evidence from Switzerland. PLoS ONE 16(2):e0247447. https://
doi. org/ 10. 1371/ journ al. pone. 02474 47
Gadarian KS, Goodman SW, Pepinsky TB (2020) Partisanship, health behavior, and policy attitudes in the early stages of the COVID-19 pandemic. SSRN Electron J. https:// doi. org/ 10. 2139/ ssrn. 35627 96 Grembowski D, Patrick D, Diehr P, Durham M, Beresford S, Kay E,
Hecht J (1993) Self-efficacy and health behavior among older adults. J Health Soc Behav 34(2):89–104
Hale T, Angrist N, Goldszmidt R, Kira B, Petherick A, Phillips T, Tatlow H (2021) A global panel database of pandemic policies (Oxford COVID-19 Government Response Tracker). Nat Hum Behav. https:// doi. org/ 10. 1038/ s41562- 021- 01079-8
Harper CA, Satchell LP, Fido D, Latzman RD (2020) Functional fear predicts public health compliance in the COVID-19 pan- demic. Int J Ment Health Addict. https:// doi. org/ 10. 1007/
s11469- 020- 00281-5
Klusmann V, Kornadt AE (2020) Current directions in views on ageing. Eur J Ageing 17:383–386. https:// doi. org/ 10. 1007/
s10433- 020- 00585-4
Kornadt AE, Kessler E-M, Wurm S, Bowen CE, Gabrian M, Klusmann V (2020) Views on ageing: a lifespan perspective. Eur J Ageing 17:387–401. https:// doi. org/ 10. 1007/ s10433- 019- 00535-9 Montepare JM (2020) An exploration of subjective age, actual age, age
awareness, and engagement in everyday behaviors. Eur J Ageing 17:299–307. https:// doi. org/ 10. 1007/ s10433- 019- 00534-w Nandy K, Salunke A, Pathak SK, Pandey A, Doctor C, Puj K, Sharma
M, Jain A, Warikoo V (2020) Coronavirus disease (COVID-19):
A systematic review and meta-analysis to evaluate the impact of various comorbidities on serious events. Diabetes Metab Syndr:
Clin Res Rev 14(5):1017–1025. https:// doi. org/ 10. 1016/j. dsx.
2020. 06. 064
O’Driscoll M, Dos Santos GR, Wang L, Cummings DA, Azman AS, Paireau J, Salje H (2021) Age-specific mortality and immunity patterns of SARS-CoV-2. Nature 590(7844):140–145. https:// doi.
org/ 10. 1038/ s41586- 020- 2918-0
OECD and European Union (2020) Health at a glance: Europe 2020:
State of health in the EU cycle. OECD Publishing, Paris. https://
doi. org/ 10. 1787/ 82129 230- en
Richard L, Gauvin L, Raine K (2011) Ecological models revisited:
their uses and evolution in health promotion over two decades.
Annu Rev Pub Health 32:307–326. https:// doi. org/ 10. 1146/ annur ev- publh ealth- 031210- 101141
Salanié F, Treich N (2020) Public and private incentives for self-pro- tection. Geneva Risk Insur Rev 45(2):104–113. https:// doi. org/ 10.
1057/ s10713- 020- 00050-3
Sallis, J. F., N. Owen, and E. Fisher (2008). Ecological models of health behavior. In: K. Glanz, B. K. Rimer, K. Viswanath (eds.) Health behaviour and health education: Theory, research, and practice, pp. 465–482. Jossey-Bass.
Scherpenzeel A, Axt K, Bergmann M, Douhou S, Oepen A, Sand G, Schuller K, Stuck S, Wagner M, Börsch-Supan A (2020) Collect- ing survey data among the 50+ population during the COVID-19 outbreak: The Survey of Health, Ageing and Retirement in Europe (SHARE). Surv Res Methods 14(2):217–221. https:// doi. org/ 10.
18148/ srm/ 2020. v14i2. 7738
Shiina A, Niitsu T, Kobori O, Idemoto K, Hashimoto T, Sasaki T, Igarashi Y, Shimizu E, Nakazato M, Hashimoto K, Iyo M (2020) Relationship between perception and anxiety about COVID-19 infection and risk behaviors for spreading infection: a national
survey in Japan. Brain Behav Immun -Health 6:100101. https://
doi. org/ 10. 1016/j. bbih. 2020. 100101
Ssentongo P, Ssentongo A, Heilbrunn E, Ba D, Chinchilli V (2020) Association of cardiovascular disease and 10 other pre-existing comorbidities with COVID-19 mortality: a systematic review and meta-analysis. PLoS ONE 15(8):e0238215. https:// doi. org/
10. 1371/ journ al. pone. 02382 15
Thøgersen-Ntoumani C, Barkoukis V, Grano C, Lucidi F, Lindwall M, Liukkonen J, Raudsepp L, Young W (2011) Health and well-being profiles of older European adults. Eur J Ageing 8:75. https:// doi.
org/ 10. 1007/ s10433- 011- 0186-4
WHO (2020). WHO Coronavirus Disease (COVID-19) Dashboard data. https:// covid 19. who. int/, last accessed: December 10, 2020.
Wise T, Zbozinek TD, Michelini G, Hagan CC, Mobbs D (2020) Changes in risk perception and protective behavior during the first week of the COVID-19 pandemic in the United States. R Soc Open Sci 7:200742. https:// doi. org/ 10. 1098/ rsos. 200742 Zaki N, Alashwal H, Ibrahim S (2020) Association of hypertension,
diabetes, stroke, cancer, kidney disease, and high-cholesterol with COVID-19 disease severity and fatality: A systematic review. Dia- betes & Metab Syndr: Clin Res & Rev 14(5):1133–1142. https://
doi. org/ 10. 1016/j. dsx. 2020. 07. 005
Publisher’s Note Springer Nature remains neutral with regard to jurisdictional claims in published maps and institutional affiliations.