https://doi.org/10.1007/s10198-019-01069-8 ORIGINAL PAPER
A comparison of European, Polish, Slovenian and British EQ‑5D‑3L value sets using a Hungarian sample of 18 chronic diseases
Zsombor Zrubka1,2 · Zsuzsanna Beretzky1,2 · Zoltán Hermann3,4 · Valentin Brodszky1 · László Gulácsi1 · Fanni Rencz1,5 · Petra Baji1 · Dominik Golicki6 · Valentina Prevolnik‑Rupel7 · Márta Péntek1
Received: 10 March 2019 / Accepted: 15 April 2019 / Published online: 18 May 2019
© The Author(s) 2019
Abstract
Background In the Central and Eastern European region, the British EQ-5D-3L value set is used commonly in quality of life (QoL) studies. Only Poland and Slovenia have country-specific weights. Our study aimed to investigate the impact of value set choice on the evaluation of 18 chronic conditions in Hungary.
Methods Patients’ EQ-5D-3L index scores were calculated using the VAS-based Slovenian and European and the time-trade- off-based Polish and British value sets. We performed pairwise comparisons of mean index values by dimensions, diagnoses and age groups. We evaluated disease burden by comparing index values matched by age and gender in each condition with those of the general population of the CEE region in all four value sets.
Results Altogether, 2421 patients (55% female) were included in our sample with the average age of 55.87 years (SD = 17.75).
The average Slovenian, European, Polish and British EQ-5D-3L scores were 0.598 (SD = 0.279), 0.661 (SD = 0.257), 0.770 (SD = 0.261) and 0.644 (SD = 0.279), respectively. We found highly significant differences in most diagnoses, with the great- est difference between the Polish and Slovenian index values in Parkinson’s disease (0.265). Systematic pairwise comparison across all conditions and value sets revealed greatest differences between the time-trade-off (TTO) and VAS-based value sets as well as varying sensitivity of the disease burden evaluations of chronic disease conditions to the choice of value sets.
Conclusions Our results suggest that the choice of value set largely influences the health state utility results in chronic dis- eases, and might have a significant impact on health policy decisions.
Keywords EQ-5D-3L · Value set · Chronic disease · Quality of life · Disease burden · Hungary · Slovenia · Poland JEL classification I10
Introduction
The burden of chronic diseases is ever increasing as these conditions are the main causes of poor health, disabil- ity, and account for most the health care expenditures
Zsombor Zrubka and Zsuzsanna Beretzky contributed equally to the manuscript.
* Zsombor Zrubka
zsombor.zrubka@uni-corvinus.hu
1 Department of Health Economics, Corvinus University of Budapest, Fővám tér 8., Budapest 1093, Hungary
2 Doctoral School of Business and Management, Corvinus University of Budapest, Fővám tér 8., Budapest 1093, Hungary
3 Centre for Economic and Regional Studies, Hungarian Academy of Sciences, Tóth Kálmán u. 4, Budapest 1097, Hungary
4 Centre of Labour Economics, Corvinus University of Budapest, Fővám tér 8., Budapest 1093, Hungary
5 Premium Postdoctoral Research Program, Hungarian Academy of Sciences, Nádor u. 7, Budapest 1051, Hungary
6 Department of Clinical and Experimental Pharmacology, Medical University of Warsaw, Banacha 1B, Warsaw 02-097, Poland
7 Institute for Economic Research, Kardeljeva ploščad 17, 1109 Ljubljana, Slovenia
nowadays [1]. Chronic diseases are often lifelong con- ditions, which require constant treatment and cause sig- nificant burden not only on the individual but also on a societal level. The introduction of new therapies for the treatment of chronic conditions requires knowledge on the potential health gains in terms of life years gained or improved quality of life. Measuring health-related quality of life (HRQoL) in chronic diseases could aid the evalu- ation of healthcare interventions’ effectiveness and pro- vide information on the potential health gain that can be achieved. Information on potential health gains contributes to the better allocation of resources and provides input to decision-making.
Evidence on patient’s health-related quality of life can be obtained using patient-reported outcome measures, some of which are generic, meaning they cover a more general spectrum of health problems and are designed to be applicable for various health conditions [2]. The EQ- 5D-3L questionnaire is a generic measure of health, which is widely used in different countries in a variety of clinical areas. The EQ-5D-3L questionnaire can be used to derive Health Utility Index scores [3]. The utility values that are attached to the health states described by the question- naire can be used in health economic analysis to quantify the possible health gains expressed in quality-adjusted life years (QALYs) [4].
For the valuation of the EQ-5D-3L health profiles, dif- ferent value sets are applicable. However, not all coun- tries have their own value set: in the Central and Eastern European (CEE) regions, only Slovenia and Poland have country-specific value sets. In health economic analyses as well as the assessment of the health status of the general population, in other countries of the CEE region, usually, the British TTO value set is used [5–8]. The European value set was derived from six countries [9], to be used in multinational studies in Europe. However, it is not fre- quently used in the CEE region. [8].
Previous studies indicate that differences are present between results calculated with different value sets and that it may be attributed to societal and cultural differ- ences. The relative importance of the problems reported in the five EQ-5D dimensions differs by value sets [10], and certain conditions differ largely in the frequency of problems reported in the various EQ-5D dimensions.
Therefore, differences in the country-specific value sets may lead to significantly different EQ-5D index scores and thus differences in utility values among different disease conditions. As the utilities are often used in health eco- nomic analyses, the use of different value sets may lead to disparities and significant differences in health priority set- ting and decision-making. Comparative analyses have been conducted to determine how the choice of value sets might affect the assessment of population health [11], QALY
calculations in patient samples [12] or the assessment of health state transitions [13]. Furthermore, the measure- ment properties of EQ-5D-5L and 3L value sets from sev- eral countries have been compared in eight disease groups.
[14] However, we were not aware of studies exploring the systematic differences between value sets across multiple disease conditions and their potential impact on disease burden evaluations and health priority setting.
We aimed to compare the Slovenian, Polish, British and European EQ-5D-3L value sets, which are most commonly used or are potentially applicable for health economic evalu- ations in the CEE region. Our study was based on the com- parative analysis of patient-level data from cross-sectional surveys conducted in Hungary among patient populations in 18 different chronic conditions. We explored the differ- ences of the EQ-5D-3L index scores calculated with the four value sets by diagnosis, age group and disease severity. Fur- thermore, we analysed the potential impact of the choice of value sets on health priority setting by comparing the disease burden evaluations across different conditions using differ- ent value sets.
Methods
EQ‑5D‑3LThe EQ-5D-3L questionnaire is a health status measure that consists of two parts, a descriptive system and the EQ VAS. The descriptive system focuses on five dimensions of health: mobility (MO), self-care (SC), usual activities (UA), pain/discomfort (PD) and anxiety/depression (AD). In each dimension, there are three response categories (1, 2 or 3) representing: no problems—1, moderate problems (some problems in MO, SC and UA; moderate PD and AD)—2;
severe problems (unable MO, SC and UA, extreme PD and AD)—3. Respondents are asked to indicate for each dimen- sion the level of problem that best describes their current health status [5, 15]. The responses (1, 2 or 3) for the five dimensions can be combined into a five-digit number that describes the respondent’s health state (e.g. no problem in any of the five dimensions can be described as 11111;
some problems in Mobility but no problem in the other four dimensions is presented as 21111). The descriptive system can define 243 different health states. To each health state, an EQ-5D-3L index score can be attached according to a particular set of preference weights, also called value set.
The EQ-5D-3L index score (value) reflects the relative util- ity (desirability) of the health state and can be used for the calculation of quality-adjusted life years (QALY) in cost- utility analyses [4]. The second part of the questionnaire is a visual analogue scale (EQ VAS) ranging from 0 (represent- ing the worst imaginable health) to 100 (best imaginable
health state) on which respondents rate their current health state.
EQ‑5D‑3L value sets
EQ-5D-3L value sets have been developed in various coun- tries based on preferences of the general population using direct methods such as time-trade-off (TTO) and EQ-5D vis- ual analogue scale (EQ-VAS, hereinafter VAS) or both [16].
In the TTO exercise, respondents have to decide between two alternative outcomes. Generally, the question refers to whether they would be willing to exchange a certain life expectancy to a shorter one lived in perfect health [17]. In the VAS-based valuation, respondents have to locate the different health states as well as death on the 0–100 VAS, where 0 is the worst and 100 is the best imaginable health state. The differences between the positions of the health states marked on the VAS should correspond to the differ- ences in preference as perceived by the respondent.
In our study, we compared four value sets. The Brit- ish valuation study was conducted in 1993. From 6080 randomly selected addresses, 2997 respondents provided complete data for evaluation. The value set was determined by the valuation of 42 health states in a face-to-face TTO exercise in addition to “full health” (11111) and “death”.
Each respondent valued 13 health states. [7]. A VAS-based European value set was published in 2003 [9]. It was derived from 11 surveys carried out between 1991 and 1999 in Fin- land (one study), Germany (three studies), The Netherlands (one study), Spain (three studies), Sweden (two studies) and the UK (two studies), with a total of 6870 respondents [18–28]. The preference weights were estimated from the valuations of 44 EQ-5D health states. In the individual stud- ies, various combinations of the 44 health states were val- ued. However, most studies valued a core set of 13 health states in addition to full health and death, and each of the 44 states were valued in at least two studies. [9]. The Polish valuation study was performed in 2008 on a sample of 321 visitors of inpatients in eight hospitals using quotas to ensure a representative sample of the adult population of Poland.
The TTO exercise was conducted during face-to-face inter- views, and 45 health states were valued in addition to 11111 and “dead”. Each respondent valued 25 health states. [29].
The Slovenian value set was determined in 2000 in a postal survey. The survey involved 3000 adults randomly selected from the general population. After checking logical con- sistency, answers returned by 370 individuals (12.3%) were used in the valuation exercise. In addition to “dead” and
“unconscious”, each respondent valued the same 14 health states using the VAS [30]. The EQ-5D-3L index score range
of the four value sets are as follows: Slovenian − 0.225 to 1;
European − 0.074 to 1; Polish − 0.523 to 1; British − 0.594 to 1.
Sample
This current study is a secondary analysis of 18 previous surveys conducted by the Department of Health Economics of the Corvinus University of Budapest in the past 14 years [8, 31–48]. We selected those studies which used the vali- dated Hungarian version of the EQ-5D-3L questionnaire for the assessment of patients with chronic conditions. We only included those patients in our analysis, who had answers in all five EQ-5D-3L dimensions; hence EQ-5D-3L index scores could be calculated using the four different value sets.
The 18 datasets were combined into a pooled sample.
Statistical analysis
We applied descriptive methods and graphical representation of key findings. As sample sizes varied substantially across the datasets (min: N = 61, max: N = 249), analytical weights were constructed to make the pooled dataset a balanced sam- ple of the 18 diseases. The sum of weights was set to 100 by each condition. We calculated weighted mean and percent- age values when reporting characteristics of the pooled sam- ple totals. We compared the four value sets by (1) EQ-5D-3L dimensions, (2) by diagnosis, (3) by respondents’ subjec- tive health assessment (EQ VAS) and (4) by age group, according to the following. (1) When comparing value sets by EQ-5D-3L dimensions, we graphically represented indices of health states with moderate and severe levels of isolated problems in each dimension (e.g. 21111, 31111, etc.), as well as the combinations of moderate and severe problems (21122, 22222, 32233, 33333) against full health (11111). This comparison allows us to take into account the full disutility arising from the severity of problems and the dimension-specific preferences [10]. (2) Although the distribution of index values was not normal, the sample size was sufficiently large to allow the comparison of diagnosis subgroups using two-sided paired t tests [49]. (3) To assess the differences between value sets depending on disease severity, we plotted the four value sets against respondents’
subjective health assessment. We obtained EQ VAS scores from each patient in addition to the EQ-5D-3L health pro- files. To balance frequency peaks at round EQ VAS values, yet retain granularity, we divided patients into 36 quantiles based on EQ VAS scores, and represented visually mean index values of the four value sets in each EQ VAS quan- tile. (4) When comparing value sets across age groups, we
applied a weighted OLS regression model with standard errors clustered at the individual patient level.
Finally, for each value set, we calculated disease bur- den (DB) scores and the sensitivity of DB evaluations to the choice of value set. DB was defined as the difference between the average health status of the patient group and health state of the general population comparable by age and gender. For DB score calculations, we used the popula- tion norm values estimated from a joint database of Polish, Slovenian and Hungarian population studies (n = 6926), by calibrating to the 2011 European population census by age, gender and education [50]. We expressed DB scores as disutilities. For instance, a 0.2-point DB score over a year represents 0.2 QALY loss compared to the comparable gen- eral population.
From the 18 samples, we modelled the effect of the choice of the value set on DB evaluations. We calculated a sensi- tivity index according to the following procedure. First, we performed all pairwise DB comparisons for each condition using the four value sets. Each i condition was compared to the other 17 j conditions (i ≠ j). In each comparison with value set k (Slovenian, European, Polish or British), the dif- ference between DBi and DBj (ΔDBijk) could be significantly positive (+), non-significant (0) or significantly negative (−).
Second, we evaluated how consistent ΔDBij1···ΔDBijk were across the k value sets. In case of consistent difference, the pattern was identical for all four value sets (++++ , 0000 or −−−−). In case of inconsistent difference, the outcome was diverse (e.g. 0 + 00, or 00−−). When comparing value set pairs, then the pattern of difference was assessed on two ΔDBij pairs (k = 2). The pattern of consistent difference was ++, 00 or −−, while examples of inconsistent difference were 0 + , −0 or +−, etc. Finally, the sensitivity index was expressed as the proportion of diverse outcomes among all pairwise comparisons. We calculated sensitivity indices by comparing the four value sets for each diagnosis as well as for the total sample. These sensitivity indices can be inter- preted as a general measure of how sensitive the DB evalu- ations are to the choice of a value set. For each diagnosis, the general sensitivity index calculation was based on 17 diagnosis pairs and four value sets (DBij n = 17, k = 4). For the sample total, the general sensitivity index calculation was based on 153 diagnosis pairs and four value sets (ΔDBij
n = 18*17/2, k = 4). The pairwise sensitivity indices express for each diagnosis how sensitive the DB evaluations are to the choice between two particular value sets (DBij n = 17, k = 2), as well as how sensitive the sample total is to the choice between two particular value sets (DBij n = 18*17/2, k = 2). Table 3 summarises the sensitivity indices denot- ing the calculation methods. When interpreting the results, greater sensitivity index values represent a greater share of inconsistent comparisons or greater sensitivity to the value set choice.
Results
Sample characteristics
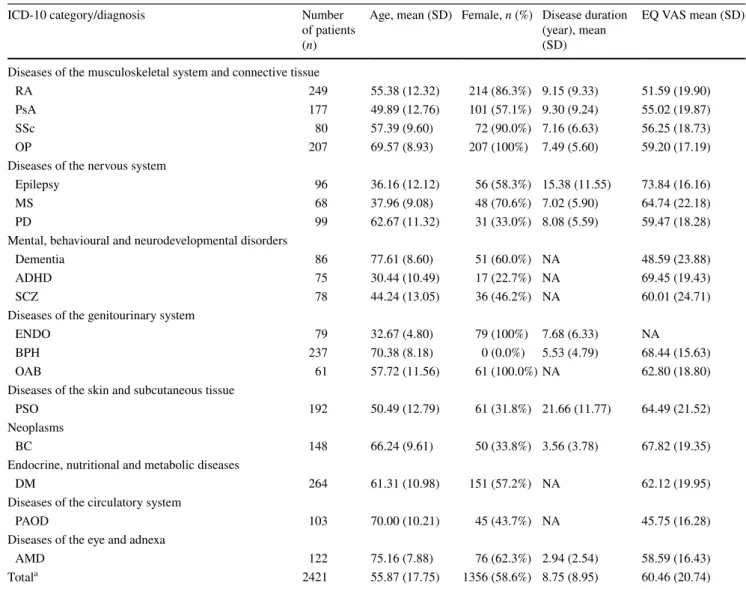
The 18 chronic conditions belonged to nine different ICD- 10 (International Statistical Classification of Diseases and Related Health Problems 10th Revision) groups. The total sample included 2421 patients with psoriatic arthritis (PsA) [31], age-related macular degeneration (AMD) [32], atten- tion-deficit/hyperactivity disorder (ADHD) [33], dementia [34], diabetes mellitus (DM) [35], endometriosis (ENDO) [36], epilepsy [37], bladder cancer (BC) [38], benign pros- tatic hyperplasia, (BPH) [39], osteoporosis (OP) [8], periph- eral arterial occlusive disease (PAOD) [40], Parkinson’s dis- ease (PD) [41], psoriasis (PSO) [42, 43], rheumatoid arthritis (RA) [44], overactive bladder (OAB) [45], systemic sclerosis (SSc) [46], multiple sclerosis (MS) [47] and schizophrenia (SCZ) [48]. The mean age of the patients was 55.87 years (SD = 17.75). More than half of patients were older than 70 years in dementia, AMD, BPH and PAOD. More than half of the patients were female (n = 1356, 58.6%) and it is worthy of note that some studies involved exclusively female (endometriosis, osteoporosis, OAB) or male (BPH) patients. The mean disease duration in our sample was 8.75 (SD = 8.95) years, with outstandingly high average disease duration in patients with psoriasis and epilepsy (Table 1).
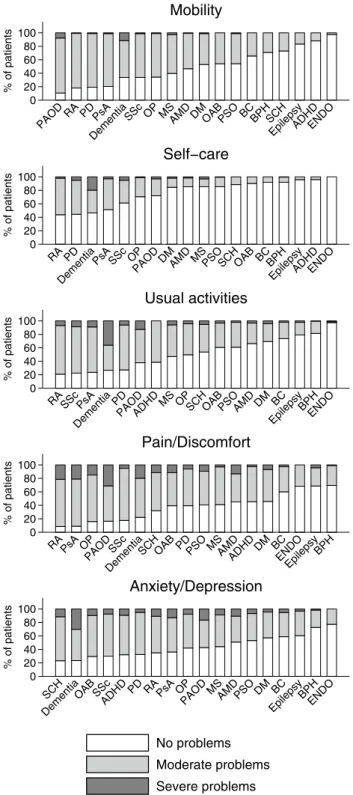
Problems reported in the five EQ‑5D‑3L dimensions In our sample, 519 patients (20.7%) did not report any problem in any of the five EQ-5D-3L dimensions, while 420 (16.1%) reported problems (of any level) in all the five dimensions. Severe problems in at least one dimen- sion were reported by 419 patients (17.6%), while 2002 patients (82.4%) did not report the severe problem in any of the five dimensions.
The distribution of patients by problem levels and diag- noses across the five EQ-5D-3L dimensions are presented in Fig. 1. Any problems were reported most frequently in dementia (96.5%), RA (95.2%), PAOD (95.2%) and AP (94.4%), while least frequently in endometriosis (44.3%), epilepsy (52.1%) and BPH (53.2%). Considering the total sample, the less affected health dimension was self-care with moderate and severe problems reported by 20.5% and 2.6% of respondents, respectively. Most problems were indicated in the pain/discomfort dimension followed by anxiety/depression, with moderate problems reported by 51.7% and 46.5%, and severe problems reported by 10.3%
and 9.0%, respectively.
The percentage of patients reporting any problems in mobility, self-care, usual activities, pain/discomfort
and anxiety/depression was greatest in PAOD (89.3%), RA (56.2%), RA (20.9%), RA (8.4%) and SCZ (76.9%), respectively. Patients with dementia reported severe prob- lems most frequently in the mobility (11.3%), self-care (19.7%), usual activities (36.1%) and anxiety/depression (30.2%) dimensions, while PAOD patients reported most frequently severe problems in the pain/discomfort dimen- sion (31.1%) (Fig. 1).
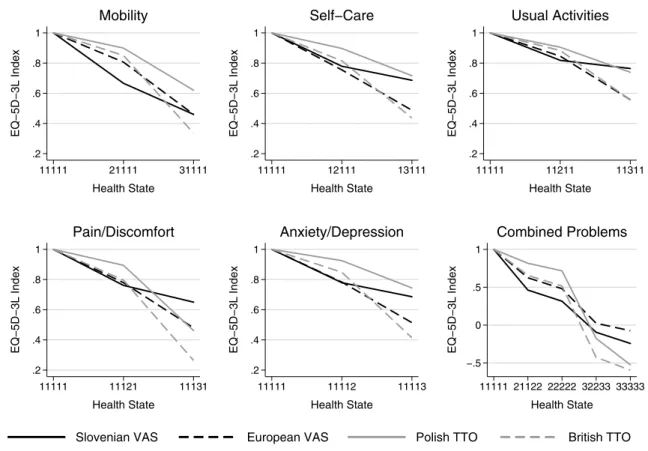
Comparison of value sets by EQ‑5D‑3L dimensions Figure 2 illustrates the relative importance of the EQ-5D-3L dimensions in the four value sets. Except for severe problems in the usual activities and pain/discomfort dimensions, the polish value set provided the highest values for health states
with moderate or severe problems in a single dimension. For moderate problems, the Slovenian, while for severe ones the British value set provided the lowest values. The disutility of moderate problems compared to full health tended to be relatively small in the Polish and British value sets, followed by a steep decline between moderate and severe problem levels. However, in the Slovenian value set, the disutility of moderate problems tended to be greater, followed by a mod- erate decline at severe problems. The differences between full health and moderate problems and between moderate and severe problems were similar in the European value set. The index values of health states with combined prob- lems showed that compared to the TTO-based value sets the VAS-based Slovenian and European value sets tended to have lower index values in milder health states, while the
Table 1 Main characteristics of the patient samples
ADHD attention-deficit/hyperactivity disorder, AMD age-related macular degeneration, BC bladder cancer, BPH benign prostatic hyperplasia, DM diabetes mellitus, ENDO endometriosis, NA not available, MS multiple sclerosis, OAB overactive bladder, OP osteoporosis, PAOD periph- eral arterial occlusive disease, PsA psoriatic arthritis, PSO psoriasis, RA rheumatoid arthritis, SCZ schizophrenia, SSc systemic sclerosis
a Weighted mean and percentage values using analytical weights summing up to 100 in each disease
ICD-10 category/diagnosis Number
of patients (n)
Age, mean (SD) Female, n (%) Disease duration (year), mean (SD)
EQ VAS mean (SD)
Diseases of the musculoskeletal system and connective tissue
RA 249 55.38 (12.32) 214 (86.3%) 9.15 (9.33) 51.59 (19.90)
PsA 177 49.89 (12.76) 101 (57.1%) 9.30 (9.24) 55.02 (19.87)
SSc 80 57.39 (9.60) 72 (90.0%) 7.16 (6.63) 56.25 (18.73)
OP 207 69.57 (8.93) 207 (100%) 7.49 (5.60) 59.20 (17.19)
Diseases of the nervous system
Epilepsy 96 36.16 (12.12) 56 (58.3%) 15.38 (11.55) 73.84 (16.16)
MS 68 37.96 (9.08) 48 (70.6%) 7.02 (5.90) 64.74 (22.18)
PD 99 62.67 (11.32) 31 (33.0%) 8.08 (5.59) 59.47 (18.28)
Mental, behavioural and neurodevelopmental disorders
Dementia 86 77.61 (8.60) 51 (60.0%) NA 48.59 (23.88)
ADHD 75 30.44 (10.49) 17 (22.7%) NA 69.45 (19.43)
SCZ 78 44.24 (13.05) 36 (46.2%) NA 60.01 (24.71)
Diseases of the genitourinary system
ENDO 79 32.67 (4.80) 79 (100%) 7.68 (6.33) NA
BPH 237 70.38 (8.18) 0 (0.0%) 5.53 (4.79) 68.44 (15.63)
OAB 61 57.72 (11.56) 61 (100.0%) NA 62.80 (18.80)
Diseases of the skin and subcutaneous tissue
PSO 192 50.49 (12.79) 61 (31.8%) 21.66 (11.77) 64.49 (21.52)
Neoplasms
BC 148 66.24 (9.61) 50 (33.8%) 3.56 (3.78) 67.82 (19.35)
Endocrine, nutritional and metabolic diseases
DM 264 61.31 (10.98) 151 (57.2%) NA 62.12 (19.95)
Diseases of the circulatory system
PAOD 103 70.00 (10.21) 45 (43.7%) NA 45.75 (16.28)
Diseases of the eye and adnexa
AMD 122 75.16 (7.88) 76 (62.3%) 2.94 (2.54) 58.59 (16.43)
Totala 2421 55.87 (17.75) 1356 (58.6%) 8.75 (8.95) 60.46 (20.74)
UK and Polish value sets provided the lowest values for the combination of severe problems (33333). Among all 243 EQ-5D-3L profiles, “worse than dead” health states with negative utility values were most prevalent in the British value set (35%), followed by the Polish (13%), the Slovenian (9%) and the European one (2%).
Considering severe problems, the Polish and British value sets provided the largest decrease of health state value in the pain/discomfort dimension. In contrast, severe problems in the mobility dimension had the highest negative impact on the EQ-5D-3L index value in the European and the Slove- nian value sets. Based on these findings, we expected that both the overall severity and the main problem domains of certain conditions would contribute to the utility differences demonstrated between the four value sets.
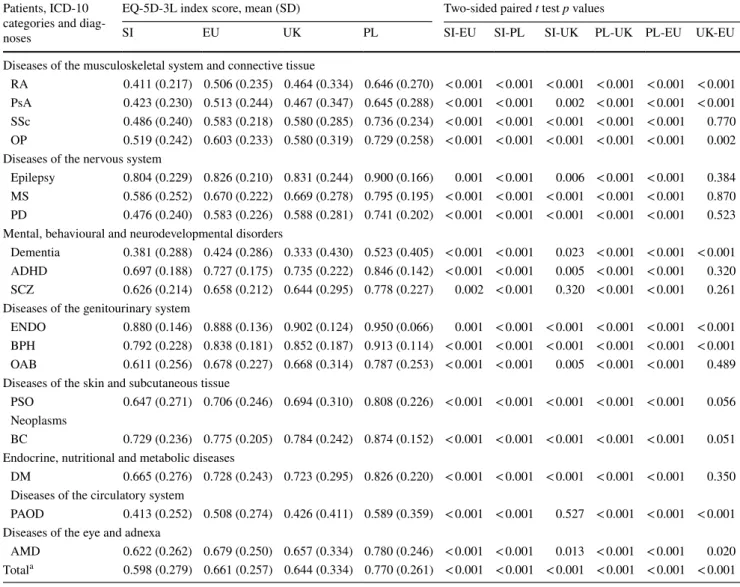
Comparison of value sets by diagnosis
To conduct our analysis by diagnosis, we calculated the EQ- 5D-3L index scores (mean, standard deviation) with all the four value sets for each diagnosis. The weighted mean EQ- 5D-3L index scores in our total sample were, respectively, 0.598 (SD = 0.279), 0.661 (SD = 0.257), 0.770 (SD = 0.261) and 0.644 (SD = 0.334) with the Slovenian, European, Polish and British value sets. All pairwise value set comparisons were significant (p < 0.001). Patients with endometriosis had the highest, while dementia patients had the lowest mean EQ-5D-3L scores in all four value sets. The most significant difference between any two value sets was found in PD: the difference between the Slovenian and Polish index values was 0.265. The pairwise comparisons of the four value sets by two-sided t tests showed highly significant differences in most diagnoses. In SCZ, the British value set did not differ significantly from the Slovenian and European value sets. In other diagnoses, five or six pairwise value set comparisons were significantly different. The British and European value sets did not differ significantly in 10, and the British and Slovenian in 2 out of the 18 diagnoses. All other value set comparisons showed significant differences in all diagnoses (Table 2).
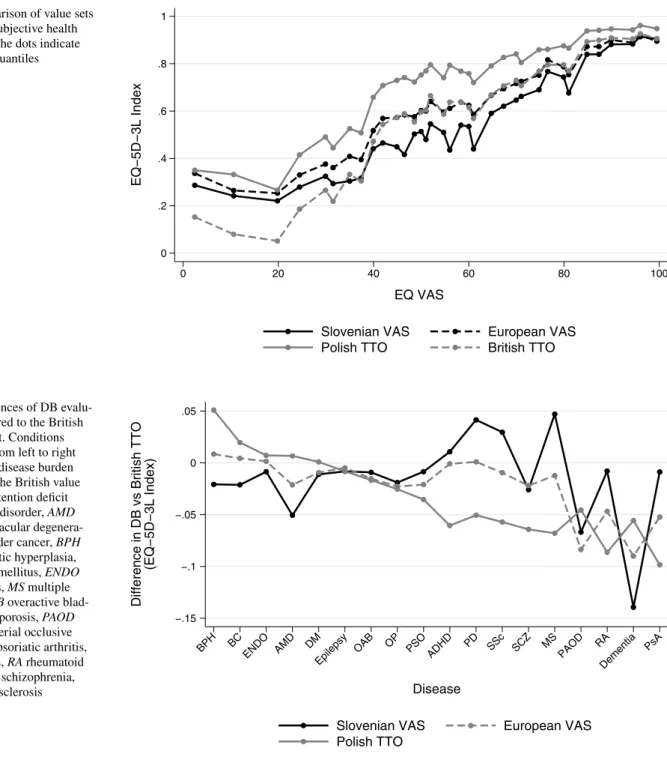
Comparison of value sets by patients’ subjective health assessment
We explored how disease severity influenced the differences between value sets. As a proxy for disease severity, we used subjective health assessments by the EQ VAS. We observed three distinct EQ VAS regions based on the pattern of value set differences (Fig. 3). Across the entire EQ VAS range, the Polish index values were highest. We observed greatest
0 20 40 60 80 100
% of patients
PAOD RA PDPsA Dementia
SSc
OP MSAMD DMOAB PSO BCBPH
SCH Epileps
y ADHDENDO
Mobility
0 20 40 60 80 100
% of patients
RA PD Dementia
PsA SSc
OPPAO
DDMAMD MSPSO SCH
OAB BCBPH EpilepsyADHDENDO
Self−care
0 20 40 60 80 100
% of patients
RA SSc PsA Dementi
aPD
PAODADHDMS OPSCHOAB
PSOAMDDM BC Epileps
yBPH ENDO
Usual activities
0 20 40 60 80 100
% of patients
RA PsA OP PAODSSc
Dementia SCH
OAB PDPSO MSAMD ADHDDM BC
ENDOEpileps yBPH
Pain/Discomfort
0 20 40 60 80 100
% of patients
SCH Dementia
OAB SSc
ADHDPD RA PsA OP PAODMSAMD
PSO DM BC Epilepsy
BPHENDO
Anxiety/Depression
No problems Moderate problems Severe problems
Fig. 1 Problems reported in the five EQ-5D-3L dimensions by diag- nosis. ADHD attention-deficit/hyperactivity disorder, AMD age- related macular degeneration, BC bladder cancer, BPH benign pros- tatic hyperplasia, DM diabetes mellitus, ENDO endometriosis, MS multiple sclerosis, OAB overactive bladder, OP osteoporosis, PAOD peripheral arterial occlusive disease, PsA psoriatic arthritis, PSO pso- riasis, RA rheumatoid arthritis, SCZ schizophrenia, SSc systemic scle- rosis
differences between the four value sets in the EQ VAS range between 40 and 80 (n = 437, 61.7%). In this range, the Slo- venian index values were lowest, while the European and British value sets provided nearly identical index values.
Differences were the smallest in the EQ VAS range between 80 and 100 (n = 437, 20.4%), and the pattern of value sets changed below EQ VAS levels of 40 (n = 437, 17.9%), where the Slovenian, European and Polish value sets converged, and the British value set provided the lowest index values.
Comparison of value sets by age groups
We aimed to analyse whether the EQ-5D-3L index scores calculated with the four value sets differed depending on the patients’ age. Three age groups were created: 18–34, 35–54 and 55+ years old. From the 2421 patients 16.3% belonged to the youngest (n = 275), 26.7% to the middle (n = 609) and 56.6% (n = 1525) to the oldest age group.
More than half of the patients belonged to the youngest age group in ADHD (69.3%), endometriosis (64.6%) and epilepsy (54.2%). In certain diseases that typically affect the elderly, most of the patients were over 55 years old. In AMD 100%, in dementia 96.5%, in BPH 95.8%, in PAOD 95.2% and in OP 93.7% of the patients belonged to the old- est age group.
The Slovenian, European, Polish and British index val- ues were 0.765 (SD = 0.214), 0.793 (SD = 0.190), 0.886 (SD = 0.140) and 0.804 (SD = 0.213) in the 18–34 age group, 0.601 (SD = 0.277), 0.662 (SD = 0.255), 0. 773 (SD = 0.251) and 0.644 (SD = 0.329) in the 35–54 age group, and 0.548 (SD = 0.277), 0.622 (SD = 0.262), 0.735 (SD = 0.281) and 0.598 (SD = 0.350) in the 55+ age group, respectively. All value set comparisons differed significantly (p ≤ 0.001). In all age groups, index values were lowest when measured with the Slovenian, followed by the European and the British value sets, while the Polish index values were highest. The difference between index values of the youngest and eldest age groups was biggest when using the Slovenian (0.217), followed by the British (0.206), the European (0.171) and the Polish (0.150) value sets. All age group comparisons were significant (p < 0.001).
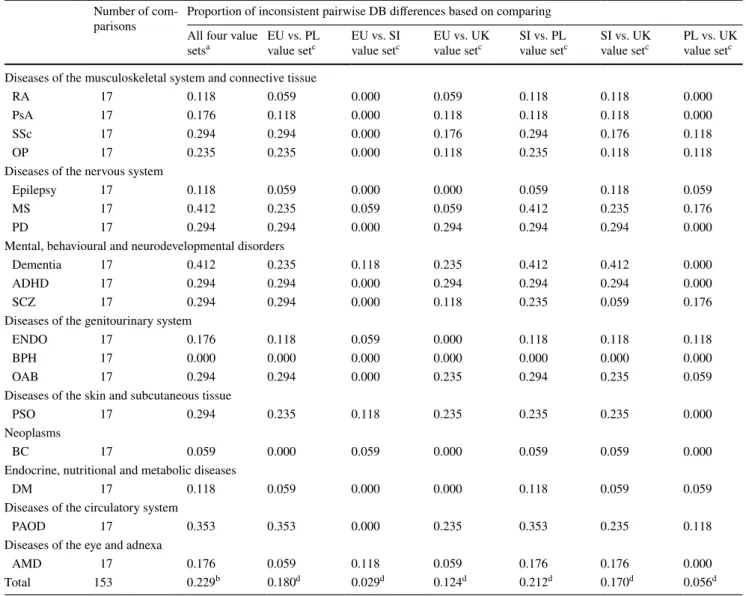
The sensitivity of disease burden evaluation to the choice of the value set
Although the British TTO value set is used most frequently for the evaluation of health outcomes in Hungary as well as the CEE region [8, 51], we explored how DB evalua- tions would be affected in the 18 conditions by choosing a different value set (Fig. 4). We observed differences in both positive and negative directions in certain conditions
.2 .4 .6 .8 1
EQ−5D−3L Index
11111 21111 31111
Health State
Mobility
.2 .4 .6 .8 1
EQ−5D−3L Index
11111 12111 13111
Health State
Self−Care
.2 .4 .6 .8 1
EQ−5D−3L Index
11111 11211 11311
Health State
Usual Activities
.2 .4 .6 .8 1
EQ−5D−3L Index
11111 11121 11131
Health State
Pain/Discomfort
.2 .4 .6 .8 1
EQ−5D−3L Index
11111 11112 11113
Health State
Anxiety/Depression
−.5 0 .5 1
EQ−5D−3L Index
11111 21122 22222 32233 33333 Health State
Combined Problems
Slovenian VAS European VAS Polish TTO British TTO
Fig. 2 EQ-5D-3L index scores for selected health states by the four different value sets
with all value sets, with most striking differences between the British and Slovenian ones. The DB score of dementia was nearly 0.15 index points lower, while for MS and PD nearly 0.05 index points higher when choosing the Slovenian value set instead of the British one. The Polish value set differed most from the British one in PsA, while the Euro- pean one in dementia. The difference was also substantial between the Polish and Slovenian value sets in MS and PD as well. The value sets performed nearly identically in DM, epilepsy, OAB and OP. The difference from the British value set tended to increase with the level of disease burden in all value sets.
As a general measure of sensitivity to the choice of the value set, we introduced the sensitivity index (Table 3).
Altogether, from the 153 pairwise comparisons of DB scores that were evaluated between the 18 conditions (n = 18*17/2), 22.9% provided diverse outcomes. Most of the diverse out- comes were combinations of non-significant differences and significant differences in one direction. Mainly due to the mod- est sample sizes of the disease subsamples, there were no pair- wise comparisons where alternative value sets provided statis- tically significant reverse DB rankings. (+ ΔDBij for one value set, but—for another.) The sensitivity index suggested that the disease conditions are not identically sensitive to the choice of the value set. The outcome of DB comparisons including con- ditions such as dementia, MS or PAOD depended strongly on the value set, while DB comparisons of other diseases, such as BPH and BC, were hardly affected. The sensitivity index also
Table 2 EQ-5D-3L index scores by diagnosis
ADHD attention-deficit/hyperactivity disorder, AMD age-related macular degeneration, BC bladder cancer, BPH benign prostatic hyperplasia, DM diabetes mellitus, ENDO endometriosis, EU European, NA not available, MS multiple sclerosis, OAB overactive bladder, OP osteoporosis, PAOD peripheral arterial occlusive disease, PL polish, PsA psoriatic arthritis, PSO psoriasis, RA rheumatoid arthritis, SCZ schizophrenia, SI Slovenian, SSc systemic sclerosis, UK British
a Weighted mean and percentage values using analytical weights summing up to 100 in each disease Patients, ICD-10
categories and diag- noses
EQ-5D-3L index score, mean (SD) Two-sided paired t test p values
SI EU UK PL SI-EU SI-PL SI-UK PL-UK PL-EU UK-EU
Diseases of the musculoskeletal system and connective tissue
RA 0.411 (0.217) 0.506 (0.235) 0.464 (0.334) 0.646 (0.270) < 0.001 < 0.001 < 0.001 < 0.001 < 0.001 < 0.001 PsA 0.423 (0.230) 0.513 (0.244) 0.467 (0.347) 0.645 (0.288) < 0.001 < 0.001 0.002 < 0.001 < 0.001 < 0.001 SSc 0.486 (0.240) 0.583 (0.218) 0.580 (0.285) 0.736 (0.234) < 0.001 < 0.001 < 0.001 < 0.001 < 0.001 0.770 OP 0.519 (0.242) 0.603 (0.233) 0.580 (0.319) 0.729 (0.258) < 0.001 < 0.001 < 0.001 < 0.001 < 0.001 0.002 Diseases of the nervous system
Epilepsy 0.804 (0.229) 0.826 (0.210) 0.831 (0.244) 0.900 (0.166) 0.001 < 0.001 0.006 < 0.001 < 0.001 0.384 MS 0.586 (0.252) 0.670 (0.222) 0.669 (0.278) 0.795 (0.195) < 0.001 < 0.001 < 0.001 < 0.001 < 0.001 0.870 PD 0.476 (0.240) 0.583 (0.226) 0.588 (0.281) 0.741 (0.202) < 0.001 < 0.001 < 0.001 < 0.001 < 0.001 0.523 Mental, behavioural and neurodevelopmental disorders
Dementia 0.381 (0.288) 0.424 (0.286) 0.333 (0.430) 0.523 (0.405) < 0.001 < 0.001 0.023 < 0.001 < 0.001 < 0.001 ADHD 0.697 (0.188) 0.727 (0.175) 0.735 (0.222) 0.846 (0.142) < 0.001 < 0.001 0.005 < 0.001 < 0.001 0.320 SCZ 0.626 (0.214) 0.658 (0.212) 0.644 (0.295) 0.778 (0.227) 0.002 < 0.001 0.320 < 0.001 < 0.001 0.261 Diseases of the genitourinary system
ENDO 0.880 (0.146) 0.888 (0.136) 0.902 (0.124) 0.950 (0.066) 0.001 < 0.001 < 0.001 < 0.001 < 0.001 < 0.001 BPH 0.792 (0.228) 0.838 (0.181) 0.852 (0.187) 0.913 (0.114) < 0.001 < 0.001 < 0.001 < 0.001 < 0.001 < 0.001 OAB 0.611 (0.256) 0.678 (0.227) 0.668 (0.314) 0.787 (0.253) < 0.001 < 0.001 0.005 < 0.001 < 0.001 0.489 Diseases of the skin and subcutaneous tissue
PSO 0.647 (0.271) 0.706 (0.246) 0.694 (0.310) 0.808 (0.226) < 0.001 < 0.001 < 0.001 < 0.001 < 0.001 0.056 Neoplasms
BC 0.729 (0.236) 0.775 (0.205) 0.784 (0.242) 0.874 (0.152) < 0.001 < 0.001 < 0.001 < 0.001 < 0.001 0.051 Endocrine, nutritional and metabolic diseases
DM 0.665 (0.276) 0.728 (0.243) 0.723 (0.295) 0.826 (0.220) < 0.001 < 0.001 < 0.001 < 0.001 < 0.001 0.350 Diseases of the circulatory system
PAOD 0.413 (0.252) 0.508 (0.274) 0.426 (0.411) 0.589 (0.359) < 0.001 < 0.001 0.527 < 0.001 < 0.001 < 0.001 Diseases of the eye and adnexa
AMD 0.622 (0.262) 0.679 (0.250) 0.657 (0.334) 0.780 (0.246) < 0.001 < 0.001 0.013 < 0.001 < 0.001 0.020 Totala 0.598 (0.279) 0.661 (0.257) 0.644 (0.334) 0.770 (0.261) < 0.001 < 0.001 < 0.001 < 0.001 < 0.001 < 0.001
provided information about how the choice between two value sets influenced DB evaluation results across the 18 conditions.
Overall, the Slovenian and Polish value sets provided the most divergent DB comparisons: in 21.2% of the DB comparisons, the choice between the Slovenian and Polish value sets pro- vided a divergent outcome. At the other extreme, the choice between the European and Slovenian value sets hardly affected the outcome of DB comparisons, just as the choice between the Polish and the British value sets.
Discussion
We analysed the systematic differences between four value sets and their potential impact on health priority setting across 18 chronic conditions [8, 31–48]. We chose value sets that are mostly used or potentially applicable to health economic evaluations in the CEE region [8]. Our analy- sis was conducted on a broad range of immune-mediated inflammatory diseases, neurological, mental, urological and other disorders from cross-sectional samples recruited
Fig. 3 Comparison of value sets by patients’ subjective health assessment. The dots indicate 36 EQ VAS quantiles
0 .2 .4 .6 .8 1
EQ−5D−3L Index
0 20 40 60 80 100
EQ VAS
Slovenian VAS European VAS Polish TTO British TTO
Fig. 4 Differences of DB evalu- ations compared to the British TTO value set. Conditions are ordered from left to right in increasing disease burden according to the British value set. ADHD attention deficit hyperactivity disorder, AMD age-related macular degenera- tion, BC bladder cancer, BPH benign prostatic hyperplasia, DM diabetes mellitus, ENDO endometriosis, MS multiple sclerosis, OAB overactive blad- der, OP osteoporosis, PAOD peripheral arterial occlusive disease, PsA psoriatic arthritis, PSO psoriasis, RA rheumatoid arthritis, SCZ schizophrenia, SSc systemic sclerosis
0
−.1
−.15
−.05 .05
Difference in DB vs British TTO (EQ−5D−3L Index)
PsA
PSO PAOD
AMD SSc RA
Dementia
ENDO DM OP
BC ADHD BPH
Epilep
sy OAB PD SCZ MS
Disease
Slovenian VAS European VAS Polish TTO
in Hungary [8, 31–48]. We compared patient-level utility values using the four value sets in each condition with individual-level data from a population-norm for the CEE region. Former studies compared different TTO and VAS- based EQ-5D-3L value sets among the general populations of different countries [11], TTO-based value sets from dif- ferent econometric models on a single patient population [12, 52], three TTO-based value sets in a single general population [53] and composite TTO (cTTO) and discrete- choice experiment (DCE) based value sets from six coun- tries across seven patient populations [54]. Numerous
studies compared value sets by each EQ-5D-3L profile [13, 29, 55]. Our study is unique in terms of comparing value sets derived by different methods (VAS and TTO) from populations with different cultural and economic background (CEE and Western Europe) across multiple patient populations. Although the 18 conditions were cho- sen arbitrarily, the breadth of disease areas, as well as the severity of conditions, allowed for a unique systematic comparison of disease burden estimates that allows the generalisation of our results beyond the boundaries of the Hungarian healthcare system.
Table 3 Sensitivity of DB comparisons to the choice of value set (sensitivity index)
ADHD attention-deficit/hyperactivity disorder, AMD age-related macular degeneration, BC bladder cancer, BPH benign prostatic hyperplasia, DM diabetes mellitus, ENDO endometriosis, EU European, NA not available, MS multiple sclerosis, OAB overactive bladder, OP osteoporosis, PAOD peripheral arterial occlusive disease, PL polish, PsA psoriatic arthritis, PSO psoriasis, RA rheumatoid arthritis, SCZ schizophrenia, SI Slovenian, SSc systemic sclerosis, UK British
a Calculated from 17×4 DB evaluations
b Calculated from 153×4 DB evaluations
c Calculated from 17×2 DB evaluations
d Calculated from 153×2 DB evaluations Number of com-
parisons Proportion of inconsistent pairwise DB differences based on comparing All four value
setsa EU vs. PL
value setc EU vs. SI
value setc EU vs. UK
value setc SI vs. PL
value setc SI vs. UK
value setc PL vs. UK value setc Diseases of the musculoskeletal system and connective tissue
RA 17 0.118 0.059 0.000 0.059 0.118 0.118 0.000
PsA 17 0.176 0.118 0.000 0.118 0.118 0.118 0.000
SSc 17 0.294 0.294 0.000 0.176 0.294 0.176 0.118
OP 17 0.235 0.235 0.000 0.118 0.235 0.118 0.118
Diseases of the nervous system
Epilepsy 17 0.118 0.059 0.000 0.000 0.059 0.118 0.059
MS 17 0.412 0.235 0.059 0.059 0.412 0.235 0.176
PD 17 0.294 0.294 0.000 0.294 0.294 0.294 0.000
Mental, behavioural and neurodevelopmental disorders
Dementia 17 0.412 0.235 0.118 0.235 0.412 0.412 0.000
ADHD 17 0.294 0.294 0.000 0.294 0.294 0.294 0.000
SCZ 17 0.294 0.294 0.000 0.118 0.235 0.059 0.176
Diseases of the genitourinary system
ENDO 17 0.176 0.118 0.059 0.000 0.118 0.118 0.118
BPH 17 0.000 0.000 0.000 0.000 0.000 0.000 0.000
OAB 17 0.294 0.294 0.000 0.235 0.294 0.235 0.059
Diseases of the skin and subcutaneous tissue
PSO 17 0.294 0.235 0.118 0.235 0.235 0.235 0.000
Neoplasms
BC 17 0.059 0.000 0.059 0.000 0.059 0.059 0.000
Endocrine, nutritional and metabolic diseases
DM 17 0.118 0.059 0.000 0.000 0.118 0.059 0.059
Diseases of the circulatory system
PAOD 17 0.353 0.353 0.000 0.235 0.353 0.235 0.118
Diseases of the eye and adnexa
AMD 17 0.176 0.059 0.118 0.059 0.176 0.176 0.000
Total 153 0.229b 0.180d 0.029d 0.124d 0.212d 0.170d 0.056d
We found remarkable differences across diagnoses, age groups or patients with different disease severity. For exam- ple, the mean EQ-5D-3L index difference was as high as 0.265 in PD and 0.187 in the 55 + age group. The systematic pairwise comparison of DB evaluations between all disease conditions revealed inconsistent results between value sets determined via the VAS and TTO valuation methodology.
The proportion of discrepant DB evaluations was 21.9%
when comparing the Slovenian VAS and Polish TTO value sets. However, value sets determined via the same method- ology provided rather consistent results. Only 2.9% of DB evaluations were discrepant when comparing the VAS-based Slovenian and European value sets, and 5.6% when compar- ing the TTO-based Polish and British value sets, despite the apparent cultural or economic differences between the populations whose preferences were valued. Our results confirm the findings of previous studies highlighting the methodology-driven differences between EQ-5D-3L value sets [11, 54].
The differences between EQ-5D-3L value sets can lead to significant differences in health gains in EQ-5D-3L-based cost-utility analyses. Taking the extremes, for example, if the health status of a patient is improved from ‘22222’ (moder- ate problems in all dimensions) to ‘11111’ (perfect health) over a year with a new treatment, the QALY gain will be 0.685 with the Slovenian, but only 0.284 with the Polish value set. Improvement from the worst possible health state (‘33333’) to a moderate health state (‘22222’) would result in 1.239 QALY gain with the Polish, but only 0.555 with the European value set. Results of the DB evaluations and the examples for the potential QALY-gain differences pinpoint that the value set chosen to calculate health state utilities in chronic diseases might significantly influence the results as well as the health policy and financing decisions. These findings deserve careful consideration in health economic analyses in the CEE, where local data are sparse, and eco- nomic analyses frequently need to rely on a variety of exter- nal sources. [56].
There is increasing interest in developing country-specific value sets. Local value sets could reflect better the health preferences of a given population (people’s beliefs about how particular problems in the EQ-5D dimensions impact their health-related quality of life) than value sets derived in a foreign country [57]. By feeding into further analyses, major utility score differences owing to the choice of value set can contribute to disparities in health policy and financ- ing decisions due to over- or underestimation of treatment outcomes or different prioritisation of diseases. Although populations’ preferences might be reflected better by coun- try-specific value sets, international comparisons of access differences, for example, are getting difficult to interpret and less useful for policymaking as it may be difficult to dis- entangle disparities between countries driven by different
evaluations of disease burden or treatment outcomes, or other factors related to the local healthcare system. Hence, using a single value set, adjusted [58] or even unweighted scores [59, 60] would aid cross-country comparisons by diminishing the effect of differences arising from different methodologies or health preferences.
The differences of the value sets might at least partly explain the differences between Poland and Hungary in terms of access to highly effective but costly biological drugs in chronic immune-mediated diseases. Several stud- ies were conducted involving these two countries in CEE to evaluate access to biologicals in rheumatoid arthritis, psoriatic arthritis, ankylosing spondylitis, Crohn’s disease, ulcerative colitis and psoriasis. [33, 61–63]. Although the access to biologicals correlated strongly with GDP per capita among European countries [64], substantial differ- ences were found in the uptake among countries with similar economic development such as Poland and Hungary [33].
Access to biologicals varies widely among CEE countries, and this difference could not be explained by epidemiologi- cal factors, drug prices or total health expenditure.
Variations of reimbursement policy may be one of the factors explaining the differences to a certain extent in Bul- garia, Latvia, Lithuania, and Poland, but the association with other possible.
Determinants (differences in prevalence and incidence, the price of biologicals, total expenditure on health, geo- graphical access, and cost-effectiveness results) were not proven. We assumed, nevertheless, in these papers that health deterioration linked to these diseases might be val- ued differently against other systemic inflammatory condi- tions in distinct countries and which may contribute to the immense diversity in the utilisation of biological drugs for immune-mediated chronic diseases. However, comparison of Hungary and Poland which have very similar total health expenditure refutes this assumption since in Hungary the exposure to biologicals used to be approximately ten times higher compared to Poland in inflammatory bowel diseases [51], despite the chronic financial deficits of the Hungarian healthcare system [65]. Similar differences were seen using biologics in psoriasis [63] and rheumatoid disorders [62, 66].In addition to the availability of patient-level data from 18 conditions, a unique strength of our study is that we could calculate disease burden scores with the four value sets using population norm database involving patient-level data of 6926 respondents. Our database contained 997 individuals in the 65+ age group, allowing for potentially more reliable DB estimates in older populations than the available local population norm values [4, 5]. However, our analysis has some limitations. The patients included in our sample may not be representative of the entire patient population in the given diagnosis. Further research including other diseases
could help to understand in condition-specific differences that can be detected in the EQ-5D-3L index values calcu- lated with different value sets. Comparison with other value sets could aid a better understanding of the factors influenc- ing the differences between national value sets coming from different regions.
As a conclusion, based on the analysis of a wide range of chronic conditions and a variety of value sets in terms of the population and method of valuation, our study highlights the potential impact of value set choice on health policy decisions.
Acknowledgements Open access funding provided by Corvinus Uni- versity of Budapest (BCE). This research was supported by the Higher Education Institutional Excellence Program of the Ministry of Human Capacities in the framework of the ‘Financial and Public Services’
research project (20764-3/2018/FEKUTSTRAT) at Corvinus Univer- sity of Budapest.
Compliance with ethical standards
Conflict of interest In connection with writing this article, ZB received grant support from the Higher Education Institutional Excellence Pro- gram of the Ministry of Human Capacities in the framework of the
‘Financial and Public Services’ research project (20764-3/2018/FE- KUTSTRAT) at Corvinus University of Budapest. DG and VPR are members of the EuroQol Research Foundation (the copyright hold- ers of the EQ-5D-3L) and have received grants from the EuroQol Re- search Foundation. ZZ, ZH, VB, LG, FR, PB, MP report no conflict of interest.
Ethical approval This study was a secondary analysis of anonymized patient data. No ethical approval was required for this research.
Open Access This article is distributed under the terms of the Crea- tive Commons Attribution 4.0 International License (http://creat iveco mmons .org/licen ses/by/4.0/), which permits unrestricted use, distribu- tion, and reproduction in any medium, provided you give appropriate credit to the original author(s) and the source, provide a link to the Creative Commons license, and indicate if changes were made.
References
1. Bauer, U.E., Briss, P.A., Goodman, R.A., Bowman, B.A.: Pre- vention of chronic disease in the 21st century: elimination of the leading preventable causes of premature death and disability in the USA. Lancet (Lond., Engl.) 384(9937), 45–52 (2014). https ://doi.org/10.1016/s0140 -6736(14)60648 -6
2. Devlin, N.J., Shah, K.K., Feng, Y., Mulhern, B., van Hout, B.: Val- uing health-related quality of life: an EQ-5D-5L value set for Eng- land. Health Econ. 27(1), 7–22 (2018). https ://doi.org/10.1002/
hec.3564
3. Torrance, N., Lawson, K.D., Afolabi, E., Bennett, M.I., Serpell, M.G., Dunn, K.M., Smith, B.H.: Estimating the burden of disease in chronic pain with and without neuropathic characteristics: does the choice between the EQ-5D and SF-6D matter? Pain 155(10), 1996–2004 (2014). https ://doi.org/10.1016/j.pain.2014.07.001 4. Szende, A., Németh, R.: Health related quality of life of the
Hungarian population [A magyar lakosság egészségi állapothoz
kapcsolódó éleminősége]. Orv. Hetil. 144(34), 1667–1674 (2003). (Hungarian)
5. Baji, P., Brodszky, V., Rencz, F., Boncz, I., Gulacsi, L., Pentek, M.: Health status of the Hungarian population between 2000–
2010. Orv. Hetil. 156(50), 2035–2044 (2015). https ://doi.
org/10.1556/650.2015.30288
6. EuroQolGroup: Measuring Self-Reported Population Health:
An International Perspective Based on EQ-5D. https ://euroq ol.org/wp-conte nt/uploa ds/2016/10/Measu ring_Self-Repor ted_Popul ation _Healt h_-_An_Inter natio nal_Persp ectiv e_based _on_EQ-5D.pdf (2019). Accessed 7 Jan 2019
7. Dolan, P.: Modeling valuations for EuroQol health states. Med.
Care 35(11), 1095–1108 (1997)
8. Rencz, F., Gulacsi, L., Drummond, M., Golicki, D., Prevolnik Rupel, V., Simon, J., Stolk, E.A., Brodszky, V., Baji, P., Zavada, J., Petrova, G., Rotar, A., Pentek, M.: EQ-5D in central and Eastern Europe: 2000–2015. Qual. Life Res. 25(11), 2693–2710 (2016). https ://doi.org/10.1007/s1113 6-016-1375-6
9. Greiner, W., Weijnen, T., Nieuwenhuizen, M., Oppe, S., Badia, X., Busschbach, J., Buxton, M., Dolan, P., Kind, P., Krabbe, P., Ohinmaa, A., Parkin, D., Roset, M., Sintonen, H., Tsuchiya, A., de Charro, F.: A single European currency for EQ-5D health states. Results from a six-country study. Eur. J. Health Econ. 4(3), 222–231 (2003). https ://doi.org/10.1007/s1019 8-003-0182-5
10. Szende, A., Janssen, B., Cabases, J.: Self-reported population health: an international perspective based on EQ-5D. Springer, Dordrecht (2014). https ://doi.org/10.1007/978-94-007-7596-1 11. Bernert, S., Fernandez, A., Haro, J.M., Konig, H.H., Alonso,
J., Vilagut, G., Sevilla-Dedieu, C., de Graaf, R., Matschinger, H., Heider, D., Angermeyer, M.C., Investigators, E.S.M.: Com- parison of different valuation methods for population health status measured by the EQ-5D in three European countries.
Value Health 12(5), 750–758 (2009). https ://doi.org/10.111 1/j.1524-4733.2009.00509 .x
12. Mozzi, A., Meregaglia, M., Lazzaro, C., Tornatore, V., Belf- iglio, M., Fattore, G.: A comparison of EuroQol 5-dimension health-related utilities using Italian, UK, and US preference weights in a patient sample. Clin. Econ. Outcomes Res. CEOR 8, 267–274 (2016). https ://doi.org/10.2147/CEOR.S9822 6 13. Kiadaliri, A.A.: A comparison of Iran and UK EQ-5D-3L value
sets based on visual analogue scale. Int. J. Health Pol. Manag.
6(5), 267–272 (2016). https ://doi.org/10.15171 /ijhpm .2016.131 14. Janssen, M.F., Bonsel, G.J., Luo, N.: Is EQ-5D-5L better than
EQ-5D-3L? A head-to-head comparison of descriptive systems and value sets from seven countries. Pharmacoeconomics 36(6), 675–697 (2018). https ://doi.org/10.1007/s4027 3-018-0623-8 15. EuroQolGroup: EuroQol–a new facility for the measurement
of health-related quality of life. Health Policy 16(3), 199–208 (1990)
16. EuroQolGroup: EQ-5D-3L|valuation. https ://euroq ol.org/eq- 5d-instr ument s/eq-5d-3l-about /valua tion/ (2019). Accessed 22 Jan 2019
17. Torrance, G.W.: Measurement of health state utilities for eco- nomic appraisal: a review. J. Health Econ. 5(1), 1–30 (1986) 18. Badia, X., Roset, M., Herdman, M., Kind, P.: A comparison of
United Kingdom and Spanish general population time trade-off values for EQ-5D health states. Med. Decis. Making 21(1), 7–16 (2001). https ://doi.org/10.1177/02729 89X01 02100 102
19. Gudex, C.: Are we lacking a dimension of energy in the EuroQol instrument? In: Björk, S. (ed.) EuroQol conference proceedings, Lund, pp. 61–82 (1992)
20. Ohinmaa, A., Eija, H., Sintonen, H.: Modelling EuroQol values of Finnish adult population. In: Badia, X., Herdman, M., Segura, A.
(eds.) EuroQol 1995 Barcelona Plenary Meeting 1996, pp. 67–76 (1996)