CHAPTER 6
Organic Constituents of Fish and Other Aquatic Animal Foods
R A Y M O N D J A C Q U O T
Centre National de la Recherche Scientifique, Laboratoire de Biochimie de la Nutrition, Bellevue ( S . & O . ) , France
I. Composition in General 146
II. Relevant Factors 1 46
A. Differences between Species 146 B. Individual Variations 147 C. Anatomical Differences 148 D. Physiological Factors 149 E. Sex Differences 149 F. Seasonal Changes 150 III. Nitrogenous Constituents 153
A. Nitrogen in Relation to Protein 153
B. Nonprotein Nitrogen 154 C. Protein Nitrogen 155 D. Nucleic Acid and Nucleoproteins 157
E. Amino Acids 158
IV. Lipids 164 A. Factors Influencing Nature of Lipids 165
B. General Characteristics of Fish Lipids 165
C. Special Features 166 V. Mineral Substances 174
A. Phosphorus 175 B. Sulfur 177 C. Miscellaneous 177
VI. Vitamins 178 A. Vitamin A 178 B. Vitamin D 183 C. Vitamin Ε 184 D. Vitamins F and Κ 184
Ε. Thiamine 185 F. Riboflavin 185 G. Niacin 186 H. Pantothenic Acid 186
I. Pyridoxine 187 J. Folic Acid and Biotin 188
Κ. Vitamin B1 2 189
L. Vitamin C 190
VII. Water 191 References 192
145
I. Composition in General
The chemical composition of sea food comes quite close to that of land animals. The principal constituents are: water, 66-84%; protein, 15-24%; lipids, 0.1-22%; and mineral substances, 0.8-2%. Certain mol- lusks such as mussels have an appreciable content of glycogen ( 1 - 3 % ) . Fish in a strict sense contains only very minute quantities of sugars. The amount of glycogen in the flesh of teleosteans is, at the maximum, 0.3%, which is much lower than that of livestock meat, which is in the order of 1% (Kilborne and McLeod, 1920). The insignificant quantities of ribose in nucleic acids have no nutritional importance. One finds, too, traces of various minerals, as well as numerous water- or fat-soluble vitamins.
The composition of aquatic animals is extremely varied. This is why efforts were made early to distinguish between different categories within what is termed sea food. The distinctions established in the Old Testament and maintained by the Talmud seem to be exclusively of a ritualistic nature (Ginsburg, 1946). On the other hand, the age-old distinction between fat and lean fish is still used in the dietetic field.
It would, however, be important to specify the significance of terms of the chemical composition.
II. Relevant Factors
The factors affecting chemical composition are numerous, being either of an intrinsic nature bearing upon genetics, morphology, and physiology, or environmental, relating to the living conditions, particularly the feed
ing.
A . D I F F E R E N C E S B E T W E E N S P E C I E S
There are differences in the composition between species, chiefly in the lipid content. In practice, a distinction is made between species with lean flesh and those with fat tissue as shown in the tabulation below.
Fatty Semifatty Lean
Herring Barracuda Coalfish
Mackerel Bass Cod
Pompano Mullet Haddock
Pike Perch Hake
Salmon Shark Plaice
Shad Smelt
Trout Tuna
6. O R G A N I C C O N S T I T U E N T S O F F I S H 147 The average content of crustaceans and mollusks comes closest to the group of semifat fishes (Table I ) .
One should not, however, draw too strict a line between the fat and the lean fishes because of the range within species and of individual variations. For instance, salmon contains between 0.35 and 1 4 % of lipids, depending on when it is caught. This fish is sometimes lean, some
times fat. The same applies to herring with a fat content from 2 to 2 2 % (Lovern and Wood, 1947).
Sprat in English waters vary in fat content from 5 to 1 8 % (John
stone, 1918). In halibut, the amount of fat ranges from 0.5% to 9.6%, while the protein content remains constant at close to 1 8 % . It is, there
fore, necessary to stress the independence between lipids and protein, in the sense that the variations in the amount of the former do not neces
sarily bring with them corresponding fluctuations in the latter. Excess fat is generally acquired at the cost of the water of the tissue (Jacquot and Creac'h, 1950).
The only distinction which can be made as to lipid content, has significance only in the practical field: a fish classified as fat may be lean, but the reverse is extremely rare.
B . I N D I V I D U A L V A R I A T I O N S
Some cases of variation within the species have already been dis
cussed along with the differences between species. A few general data may be added. In Atwater's analyses (1888), the figures shown in the tabulation below were given.
PERCENTAGE OF FRESH WEIGHT
Source Water Lipids Total Shad
Individual X 64.5 14.2 78.7 Individual XXXII 70.6 10.0 80.6 Mackerel
Individual VIII 78.6 2.2 80.8 Individual XXXIX 62.7 16.4 79.1
These values show the inverse relationship which exists between the degree of hydratation and the lipid content. Similar data have been pub
lished repeatedly—most recently for herring (Brandes, 1954). In this case, the relationship is so strong that a determination of the water content suffices to derive the fat content.
TABLE I
AVERAGE COMPOSITION OF SEA FOOD ( EDIBLE PARTS )
Water Protein Lipid Ash
Category ( % ) ( % ) ( % ) ( % )
Fat fish 6 8 . 6 2 0 1 0 1.4
Semifat fish 7 7 . 2 1 9 2 . 5 1.3
Lean fish 8 1 . 8 1 6 . 4 0 . 5 1.3
Crustacea 7 6 . 0 1 7 . 8 2 . 1 2 . 1
Mollusks 8 1 . 0 1 3 1 . 5 1 . 6
C . A N A T O M I C A L D I F F E R E N C E S
Within the body, and also between individual specimens, the com
position of the flesh tissue varies with the anatomical location. The red meat of the scombrids contains less nitrogen than the white meat.
Outside of this particular case, the variations apply chiefly to lipids.
Dontcheff and Legendre (1948) found that in the albacore the ventral
TABLE I I
COMPOSITION IN RELATION TO ANATOMICAL LOCATION
% of Fresh Weight
Fish Portion analyzed Protein Lipid
Skipjack White meat 2 1 . 9 1 5 . 4
Red meat 1 8 . 2 2 2 . 4
King salmon Close to the head 1 7 . 6 2 0 . 2
King salmon
Tail part 1 7 . 9 1 1 . 1
Yellowtail Dorsal muscle 2 2 - 2 3 . 5 1 . 8 - 2 . 8
(Northeast Pacific) Stomach 2 1 . 3 5 . 7 5
Lateral muscle 2 1 8 . 4 7
Below the backbone 2 1 . 6 - 2 4 1 . 2 - 2 . 8
Finback Regular red meat 2 2 . 9 1 2 . 3 5
Tail meat 2 2 1 4
Meat from ventral portion 2 4 6 . 6
Tongue 9 . 2 7 . 6
Lung 2 0 1.5
Heart 1 7 . 2 5 . 5
Liver 2 1 . 6 2 . 6
Kidney 1 6 . 1 2 . 7
Pancreas 1 7 . 9 4 . 8
Spleen
Blue whale Ordinary red meat 2 2 1 4 . 1
Meat from ventral portion
of flesh 2 1 . 8 6 . 2
6. O R G A N I C C O N S T I T U E N T S O F F I S H 149 meat is much richer in fat ( 2 6 % ) than that above ( 5 % ) or behind this section ( 4 % ) , or that of the red muscles ( 3 . 8 % ) . Braekkan (1956), on the other hand, reports that in tuna, halibut, and mackerel red flesh had a much higher fat content. Other similar examples are given in Table II, based upon various papers (Arai and Sakai, 1952; Pedersen, 1952; Jowett and Davies, 1938).
D. P H Y S I O L O G I C A L F A C T O R S
The halibut of the Pacific ordinarily has a glossy meat. Some speci
mens called "chalky halibuts" have an opaque, chalky appearance. This peculiarity is characterized by modifications in the contents of water and lipids, the concentration of lipids being higher, the more pro
nounced the chalky appearance is. This is borne out by Table I I I , based on the analyses of Bailey (1950).
T A B L E I I I
COMPOSITION OF HALIBUT F L E S H
Protein Oil Water
Type (%) ( % ) (%)
Normal 11.9-18.1 0.15-0.59 79.9-86.1
Medium chalky 19.8-20 1.22-1.73 77.1-78.5 Very chalky 16.9-21.6 2.6-5.79 70.1-78.0 Calories per pound 23O-360 390-430 41O-650 From the nutritional point of view, it is thus evident that "chalky halibut" is at least equal, if not superior, to normal halibut. Bailey also states that chalkiness does not seem to harm the wholesomeness of the meat.
E . S E X D I F F E R E N C E S
It is frequently maintained that the flesh of female specimens con
tains more protein than that of male fishes. Even if this opinion has been verified in the salmon (Jowett and Davies, 1938), it does not have a general application. Kordyl et al. (1951) indicate that the flesh of female cod contains less protein and more water than that of males, regardless of the state of sexual maturity. These authors contend, on the contrary, that no relationship exists between the composition of the meat of the Baltic herring and sex. Lücke (1949) arrived at the same conclusions regarding cod, haddock, and coalfish. According to Jowett and Davies (Table I V ) , there is no notable difference between male and female
barracudas and, in the immature stage, the male Australian sea mullet contains more protein than the female.
In certain species, on the other hand, the highest figures for protein content of the female is not a year-round phenomenon but characterizes a certain physiological stage. From research by Arevalo (1948), it can be deduced that the female horse mackerel is, at the beginning of the sexual cycle, richer in protein than the male, while the reverse is ob
served after spawning. Thus, differences due to sex do not exhibit a constant pattern but are subject to seasonal variations.
F . S E A S O N A L C H A N G E S
The significance of the seasonal variations is complex, and it is almost impossible to distinguish surely between the effect of the many factors which play a part. The principal ones are the stage of sexual develop
ment and feeding conditions. Several studies have been devoted to sea
sonal variations (see tabulation below).
Fish South African fish Fishes along the
coast of Spain Icelandic fish (cod,
haddock, and coalfish) North Sea herring Pacific herring
(Sakhalin) Baltic herring and
cod (annual cycle) Saury (Pacific)
Reference van Wyk, 1944 Arevalo, 1948 del Riego, 1948 Lücke, 1949
Mygind, 1949 Levanidov, 1950 Kordyl, 1951 Tsuchiya et al, 1953
Fish Reference Fish from Danish Bramsnaes et al,
waters (herring, 1954 sprat, and
mackerel) Anchovy Fresh-water fish Oysters
Shellfish Mussels
Fraga, 1955 Karrick et al, 1956 Krvaric, 1953 Venkataraman and
Chari, 1951a Fraga, 1956
Appreciable variations are sometimes encountered. According to Goncalves Ferreira (1951), the Atlantic sardine contains 2 % of lipids in the spring and 8.6% in the fall. Del Riego (1948) also stresses that in this same species the protein content varies between 1 6 % in March and 20.6% in July. Similar variations are found in many pelagic deep-sea fishes that get their nourishment from plankton, the abundance and composition of which vary greatly.
Investigations on the cultivated carp have brought into evidence the decisive effect of feed composition on its value. By improving dietary
6. ORGANIC CONSTITUENTS OF FISH 151 conditions, the percentage of edible parts was increased from 55 to 67%, the lipid content went from 0.4 to 4 . 9 % , and that of protein from 14.8 to 19.5%. Hornell and Ramaswami Naidu (1924), working with the Indian sardine, found that the change in fat content can be attributed to the presence or absence of two classes of plankton, the dinoflagellates and the copepods. Venkataraman and Chari (1951b), studying the an
nual cycle of the composition of Indian mackerel migrating from Mala
bar, state that the period during which the fish contains most fat coin
cides with the period when plankton is most abundant. In another work (1953), these same authors compare the composition of the flesh of mackerel and that of plankton. The amount of fat in the fish follows closely that of the plankton, which at certain times of the year may reach 10%.
TABLE I V
T H E INFLUENCE OF SEX ON THE COMPOSITION OF FISH F L E S H0
Species
Stage of the
sexual glands Sex
Protein
% fresh weight
Australian salmon Immature Μ 20.6-21.2
F 22.8
Mature Μ 20
F 20.6
Barracuda At maturity Μ 22.5
F 21.8-22.2
Sea mullet Immature Μ 20.5
F 18.4
a Jowett and Davies, 1938.
The growth of oysters (Krvaric, 1953) and mussels (Fraga, 1956) varies with the quantity of available feed (plankton). But their com
position also depends upon other factors, such as the temperature of the sea water, its salinity, and ocean currents. The moon has no influence in this respect. No difference is found in the composition of oysters and clams during days of full moon as compared to periods of new moon.
The sexual stage of development influences the composition of fish.
Legendre (1938) remarks that during the first two years of life, when the sardine is immature, its fat content remains around 3 % , while at the end of the third year, when it reproduces, it oscillates between 5 and 1 5 % , depending upon the season. In the female of horse mackerel, the protein content falls regularly from 18 to 1 6 % during the sexual cycle.
This phenomenon is not encountered in the male. Frequently, though
not always, the flesh attains its maximum fat content prior to spawning.
This is particularly the case with salmon and shad traveling upstream to spawn. The meat then is excellent. When returning, they have lost considerable weight, sometimes more than half, and the meat is of poor quality. It is difficult to distinguish between the influence of the sexual stage and that of the feeding, as the spawning of these species takes place with stomachs empty.
Briefly stated, the seasonal effects are evident in many species where they condition the fat and protein content. This is, however, not an ab
solute rule. A whitefish like Merluccius capensis maintains a practically stable nitrogen content all through the year (van Wyk, 1944).
It should be kept in mind that the chemical composition of fish can be expected to vary largely from one species to another, within the same species, and within the same individual specimen. Objectivity requires that a record be kept of extreme values, the maximum and minimum. A great number of analytical results are compiled in comprehensive nutri
tional tables such as: König (1903); Alquier (1906); Grossfeld et al.
(1919); Quagliariello (1936); McCance and Widdowson (1940); Ran
dom et al. (1947); Jean-Blain (1948); Taylor and MacLeod (1949);
Watt and Merrill (1950); Tremolieres et al. (1955); Love et al (1959).
Other data are available in innumerable papers: Reay et al. (1943) for the United Kingdom; Giraud (1953) for Cape Verde, Africa; van Wyk (1944) for the Union of South America; Jowett and Davies (1938) for Australia; Carteni and Aloi (1934, 1935) and Costabello (1935) for Italy; Lopez-Benito (1956) for Spain; Goncalves-Ferreira (1951) and Rodriguez de la Heras and Mendez-Isla (1952, 1953) for Portugal; El Saby (1934) for Egypt; Atwater (1888) and Clark and Almy (1918) for the United States; Bailey (1942) for Canada; Carvalho Rios (1954) for Brazil; Schmidt-Hebell (1950) for Chile; Leung et al. (1952) for the Far East; Venkataraman and Chari (1951a) for Bengal (India); Tani- kawa and Suno (1952) for Japan. See also de Gouveia (1951) for shell
fish; Salgues (1934), Hinard (1923), and Carvalho Rios (1950) for eggs, roe, and milt. Various official documents also provide information in this respect as for the United Nations (FAO, 1949, 1954), Canada (Anonymous, 1934), the United States (Stansby, 1953), and France (Anonymous, 1950). The reader is referred to their studies for detailed figures. A recent ambitious undertaking, a world-wide collecting of ana
lytical results as to fish composition, was initiated in 1956 by Kühnau.
His first paper covers vitamins. The biochemistry of fishes was recently reviewed by Tarr (1958).
6. O R G A N I C C O N S T I T U E N T S O F F I S H 153 III. Nitrogenous Constituents
A. N I T R O G E N I N R E L A T I O N T O P R O T E I N
In general, the protein content is calculated by multiplying the amount of total nitrogen with the coefficient 6.25. This procedure has been criticized with regard to fish, but we are far from agreement as to which coefficient to adopt, van de Velde (1946) estimated that the con
version factor should be in the neighborhood of 8. Fraga (1956) fixes it at 7 for mussels. On the other hand, Causeret (1950) considers the value of 6.25 to be too high, the nitrogen of fish not being completely built into protein molecules. In the same vein, Dietrich (1953) proposes use of the coefficient 5.72. As a matter of fact, a general rule cannot be established. Certain fish proteins include more than 1 6 % nitrogen (milt). Others contain less than 1 5 % , e.g., the flesh of cod, herring, and white spring salmon (Deas and Tarr, 1949).
Recently it was suggested by Mitra (1956) to apply the AAN method, used for a great number of food products, to fish. The albuminoid am- moniacal nitrogen (AAN) is analyzed, and total protein obtained by multiplying AAN by 2.06 and the usual 6.25. Good correspondence was obtained between these calculations and direct analysis for a number of Indian fishes.
As regards quantity, protein nitrogen is by far the most important fraction, as Table V indicates (Causeret, 1950):
T A B L E V
DISTRIBUTION OF NITROGEN IN FISH F L E S H
Species
A. Total nitrogen
(%)
B. Protein nitrogen
(%) Ratio A/B References Cod, Atlantic 2.83 2.47 0.87 Reay et al (1943) Herring, Atlantic 2.90 2.53 0.87 Boury (1936)
Sardine 3.46 2.97 0.86 Boury (1936)
Haddock 2.85 2.48 0.87 Reay et al (1943)
Lobster 2.72 2.04 0.75 Campbell (1935)
As a rule, the nonprotein nitrogen, which is more abundant in the cartilaginous fishes, can reach 2 6 % of the total nitrogen in certain sharks (Kondo et al, 1941). This figure is considerably higher than that found in the meat of slaughter animals.
Β . N O N P R O T E I N N I T R O G E N
This fraction includes: free amino acids; volatile nitrogen bases, particularly ammonia; certain bases, such as trimethylamine-oxide, which after death is reduced to trimethylamine; creatine, which occurs in almost the same amount in all classes of fish but is absent in crusta
ceans; taurine, of which a high content is claimed to exist in flesh and liver (Asikari et al, 1938; Minato, 1949; Jones, 1954b); the betaines, more abundant in the flesh of teleost fish than in the elasmobranchs;
glycine betaine is the most common form; γ-butyrobetaine was identified in the eel, homarine and N-methylpyridine in crustaceans and mollusks;
uric acid, more abundant in elasmobranchs than in teleosteans; anserine and carnosine in certain species (anserine in the cod and the conger eel, carnosine in fresh-water eel; histamine, identified in the scombrids (tunas and mackerels) by Igarasi (1938), Johnston and Johnston (1940).
From the biochemical point of view, it is interesting to find that the creatinophosphate (phosphagen), adenosine diphosphate ( A D P ) , ade
nosine triphosphate ( A T P ) , and myoadenylic acid are found in the fishes as well as in the mammals in the fraction of the muscle, extractable with acetic acid. On the other hand, the crustaceans contain not phos- phocreatine, but a combination of arginine and phosphoric acid.
Free amino nitrogen varies with the season and storage conditions.
In the Atlantic cod, a balance seems to be struck between the free basic amino acids which increase after death (glutamic acid, methylhistidine) and those which diminish in relative quantity (lysine, leucine), while a third group (glycine) remains constant (Hodgkiss and Jones, 1955).
Shewan (1955) stressed the predominance of the free basic amino acids, particularly histidine, in the meat of deep-sea species of the type "her
ring, mackerel, tuna," and attributes the taste of these fishes to histidine.
As a matter of fact, the flatfishes have chromatograms which are quite different from those of pelagic fishes. In this latter group the order of the breakdown of these components as follows: glutathione, aspartic acid, threonine, serine, glutamic acid, proline, glycine, alanine, valine, histidine, lysine. The proteolytic activities of fish muscles are at present intensely studied, particularly by Japanese scientists (see among others Saito and Sameshima, 1958-59). White muscles appear to show the same rate of proteolytic changes, independently of species, while dark muscles vary greatly in this respect. This latter group, however, in general shows breakdown rates of 3-3.5 times those of white muscles. Of particular interest is the fact that tyrosine is formed more readily in dark muscles.
6. O R G A N I C C O N S T I T U E N T S O F F I S H 155 Free amino nitrogen is found in large quantities in fish sun-dried in the African fashion. Adrian (1957), when analyzing dried fish from An
gola, found 1.6-4.7% of the total nitrogen in the form of free amino nitrogen. In the small-sized fishes dried whole with the viscera, the percentage amounted to 1 1 % (Abobi, from Togo), which indicates an advanced autolysis. In fermented fish sauces of the nuoc-man type, the formol titratable nitrogen reaches close to 5 0 % of the total nitrogen. In crayfish, monoamino nitrogen dominates, glycine being predominant.
Simidu and Hujita (1954) established a relationship between the con
tent of free monoamino nitrogen and the flavor of shrimp. This fraction diminishes proportionately to the deterioration of taste during storage.
In the same way, Endo et al. (1954) discovered that the amount of monoamino nitrogen, and particularly of glycine, is dominant in the flavor of the flesh of octopus. These compounds are low in less aro
matic mollusks with less intense flavor, and high in species which have a highly appreciated taste. Furthermore, Yamanishi and Matzuzaka
(1955) conclude that the characteristic odor of boiled octopus is due to a sulfur-containing amine with a piperidine nucleus.
Trimethylamine oxide is found in considerable quantities in ocean fish, especially in the elasmobranchs. Significant seasonal variations in content are thought to explain why fresh-water fish do not contain this compound at certain periods (Lintzel et al., 1939). In any case, the con
tent is obviously much smaller than in marine fishes.
The relative contents of fixed and volatile nitrogen bases furnish precious indications as regards the freshness of fish. In living fish, a cer
tain equilibrium is established between trimethylamine oxide and tri
methylamine. After death, the alterations in the tissues are accompanied by a considerable increase in the di- and trimethylamine forms as a con
sequence of the reduction of oxide into free bases.
The nonprotein constituents of fish are discussed in quite some detail by Simidu in Chapter 11 of this volume. That chapter also carries a comprehensive table of selected analytical results in this particular area.
The chemical changes taking place during spoilage have been studied in a general way by Boury and Schvinte (1935) and Boury (1936).
C. P R O T E I N N I T R O G E N
Ritthausen's method with copper hydrate is still mostly used to deter
mine protein nitrogen. Various methods of extraction (Dyer et al., 1950) or electrophoresis (H.M.S.O., 1952-53) have been applied in order to
identify and separate various fish proteins. This work had the practical aim of establishing right cold-storage conditions, techniques for filleting (Ironside, 1956), and conditions for extracting pure proteins (Shenstone, 1953; Ambe and Sohonie, 1957a, b; Valanju and Sohonie, 1957).
Anatomically, the fillets are composed of segments of muscular tissue separated by fiber septae, so-called myosepts. These are in the internal part of the flesh, thicker, and in proportion to the size of the individual specimen. There exists in fish as well as in meat, extracellular protein [collagen or connective tissue; elastine (as stroma or septae)], as well as intracellular protein. But the analogy is not complete. Only a few cartilaginous fishes have a high content of connective tissue. Reay et al.
(1943) found 7% in the catfish and 1 1 % in the dogfish. Such amounts come close to that of the flesh of terrestrial mammals: 1 5 % in the rabbit, 8-20% in cattle (Bate-Smith, 1942), 7% in the muscle of the white rat (Reay, 1936). On the contrary, the flesh of bone fishes contains only little connective tissue: 2 % for halibut, 3 - 5 % for haddock, 5 % for cod (Reay, 1939). This small amount in the most widely consumed species explains why consumers find fish more tender than meat. Intracellular protein consists of actomyosin, which in turn is built by actin and myosin, myogen of albumin type, globulin, and myoalbumin (Table V I ) .
TABLE V I
COMPOSITION OF INTRACELLULAR PROTEIN OF FLESH TISSUE IN PERCENTAGE OF FRESH WEIGHT
Form of protein Rabbit* Rabbit** Haddock0 Cod<*
Myosin 39 65 67 76
Globulin X 22 19
—
8Myogen 22 10 18 6
Myoalbumin
—
1—
7<* Weber and Mayer (1933).
*> Smith (1934).
ο Reay and Kuchel (1937).
d Dyer et al. (1950).
The characteristics of fish protein structure have been extensively studied by Hamoir (1954) and Dyer. The modern concepts in this field are presented by Dyer and Dingle in Chapter 9 of this volume, where also numerous additional references may be found.
Gelatins are manufactured industrially from the collagen of the swim bladder of sturgeon, from that of the vertebrae of cod, and of the col
lagen of shark skin. The amino acid composition was determined by Eastor (1957).
6. O R G A N I C C O N S T I T U E N T S O F F I S H 157 Myosin, in mammals as well as in fish, is the most abundant fraction.
It is interesting that, so far, in the muscle of carp, only actinomyosin, not real myosin, could be identified (Roth, 1947).
Only large species of fish are bled, sometimes incompletely. The flesh then very often contains blood proteins and pigments. These proteins contain one albumin and several globulins. While in mammals the albu
min-globulin ( A / G ) relationship is more than 1, it is generally less than 0.5 in fish (Demenier, 1934).
With Dyer et al (1950), it may, therefore, be said that, on an aver
age, the muscular proteins of fish (haddock type) can be classified in the following way: 95-97% of intracellular proteins comprise 6 5 - 7 5 % of the myosin and 1 0 % of the myogen; 3 - 5 % of the extracellular pro
teins is constituted of collagen and elastine, 0.5% of nucleoproteins and hemoglobins, etc.
The protein fractions in fish eggs remain but little known. Older studies tend to make a distinction between specific albumins [ichthin, ichthulin, ichthidine (Galippe, 1906)] and clupeovine, etc. (Hugounenq, 1904). The egg membrane appears to combine a protein related to a pseudo-keratin (Young and Imman, 1938).
Finally, it should be stated that the skin of fishes is rich in collagen (Green, 1899; Tressler, 1921). The scales, except the gadoid scales of the sturgeon, are composed of a scleroprotein belonging to the keratin group, to which Mörner (1898) gave the name ichthylepidin. This sub
stance is particularly well provided with cystine, but, according to Green and Tower (1901), its content of total sulfur varies within wide limits with species. The amino acid composition of herring scales was analyzed by Ney et al (1950).
Ichthyocol has been isolated from the swim bladder of the cod by extraction with citrate solutions of pH 3-4. An aminogram covering 18 amino acids was worked out. The level of hydroxyproline was found to be 4 . 5 % of the total nitrogen and considerably higher in that of col
lagenous fish proteins. Ichthyocol is strictly comparable with "procol
lagen" of mammalian connective tissues (Young and Astrup, 1957).
D. N U C L E I C A C I D S A N D N U C L E O P R O T E I N S
The flesh of lean fish is noted for a low content of purine and pyrimi- dine nitrogen. For this reason these foods are found on the diets of persons suffering from gout. Admittedly, the distribution of rubonucleic acid and deoxyribonucleic acid ( D N A ) in fish muscles follows the usual
pattern specific to these compounds, DNA being essentially embodied in the cell nucleus. Love (1954) took advantage of this characteristic to study the most favorable conditions for the freezing of fillets, which sometimes when defrosted exude a liquid containing DNA. It is to ribose built into the nucleic acids that the Maillard reaction is attributed which causes a browning of the fish meat when overprocessed for steri
lizing. In milt, characteristic nucleoproteins are encountered which when hydrolyzed give rise to nucleic acids and a protamine.
Milt of salmon contains in dry weight 4 9 % nucleic acid and 2 7 % protein (Miescher, 1895). A more recent study by Pollister and Mirsky
(1946) showed that the nuclear protamine of trout milt represents 81.6% of the total dry and defatted product. It is interesting to note the specificity of the protamines. This explains how sturine was isolated a long time ago from the milt of sturgeon. Similarly, scombrine from mackerel, clupeine from herring, crenilabrine from gilthead, percine from lake perch, cyprine from carp, salmine from salmon, katsuworine from skipjack, plecoglossaline from "ayu" (Inafuku, 1951). Electropho- retic techniques have permitted the isolation of some protamines in a pure and homogeneous state (Brock et al, 1949; Rauen, 1952; Ui and Watanabe, 1953; Monier and Jutisz, 1954). The amino acid composition has been determined for clupeine (Block et al., 1949; Felix et al., 1950;
Sorm and Sormova, 1951; Ando et al., 1953) and for salmine (Block et al, 1949; Velick and Udenfriend, 1951; Corfield and Robson, 1953).
All these basic proteins differ from each other in nature, content, and position of the amino acids. They seem, furthermore, to include only a limited number, among which arginine largely dominates.
Particular importance has been attached to the end structure of these protamins with reference to individual amino acids. Felix and Krekels
(1953) established that the following protamines: iridine from rainbow trout, truttine from sea trout, fontinine from brook trout, as well as salmine and clupeine are built up by polypeptide chains, all ending with proline. Sturine has two amino acids at the tail end of its molecule, namely alanine and glutamic acid.
E . A M I N O A C I D S
The composition of amino acids in fish proteins exhibits some varia
tions. They are partly due to varietal characteristics and in some cases to the experimental techniques employed. Only through recent methods was it feasible to measure satisfactorily the total content of amino acids.
6. ORGANIC CONSTITUENTS OF FISH 159 Some results obtained with such old methods were eliminated when preparing Table VII, reporting the content of essential amino acids in various fishes, fish products, and other sea food calculated on the basis of 1 6 % nitrogen. This method of evaluation is used to allow a compari
son as to the balance of amino acids, regardless of their nitrogen content.
For a long time it was believed that the flesh of fish differed from that of mammals essentially in the absence of glycine, the most simple amino acid. This conception, brought forth by Osborne et al. (1909) and Okuda (1919), needs a complete revision. The measurements by micro
biological methods by Dunn et al. (1949) give, as a matter of fact, a glycine content varying from 4 . 5 % in tuna to 7.5% in mackerel. The percentages of aspartic and glutamic acids are also comparable to those of mammalian meat, as presented in the studies of Dunn et al. Generally the amino acid composition of fish muscle protein coincides with that of meat.
The composition of milt reflects that of their specific protamine. Our analysis (herring and salmon) shows as chief characteristics a high content of arginine and low values in lysine. This does not necessarily imply a general rule because other protamines such as sturine and cyprinine are rich in lysine; the content of lysine in sturine is 7.5%, and in cyprinine, the extraordinary amount of 2 9 % . It would therefore be of greatest interest to acquire more knowledge about the balance of amino acids in various milts.
The same could be said about the eggs (roe). Those that we have analyzed come rather close to that of flesh except in lysine. In crusta
ceans, the distribution of amino acids comes close to that of fish. Finally, the mollusks contain somewhat less lysine.
Summing up, there doubtless exist variations in the contents of amino acids in the flesh of various fishes, but the deviations are espe
cially evident for arginine (which is only semiindispensable), histidine (relatively unimportant), and tryptophan. The relative amounts of other amino acids are for more homogeneous (Table V I I ) . The figure 1 4 % for lysine is actually unique. All other values oscillate between 6 and 8%. A fact of great importance is the following: It is known through the investigation by Neilands et al. (1949) and through those by Dunn et al. that the content of essential amino acids remains unchanged in both cooking and canning (see also Volume II, Chapter 6, by Tarr).
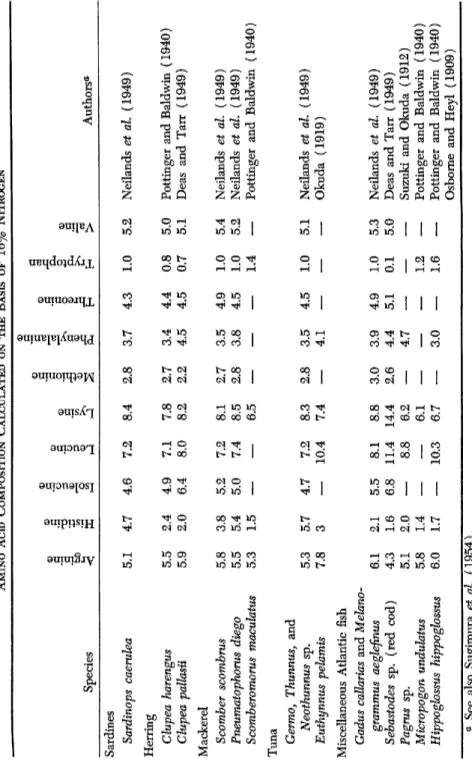
TABLE VII AMINO Aero COMPOSITION CALCULATED ON THE BASIS OF 16% NITROGEN Species
0 Ö 3 EP
<
§ s
0
·!
0 ι—I Ο ΧΛ I—I1
1
.0
ο .9 Ö •Μ 0 S
0 Ö '2 &· 0
0 .9 Ö
I
a •s.
Ο ·+-> α.
fr Η
3
Authors* Sardines Sardinops caerulea 5.1 4.7 4.6 7.2 8.4 2.8 3.7 4.3 1.0 5.2 Neilands et al. (1949) Herring Clupea harengus Clupea pallasii 5.5 5.9 2.4 2.0 4.9 6.4 7.1 8.0 7.8 8.2 2.7 2.2 3.4 4.5 4.4 4.5 0.8 0.7 5.0 5.1 Pottinger and Baldwin (1940) Deas and Tarr (1949) Mackerel Scomber scombrus Pneumatophorus diego Scomberomorus macuhtus5.8 5.5 5.3
3.8 5.4 1.5
5.2 5.0 7.2 7.4 8.1 8.5 6.5
2.7 2.8 3.5 3.8 4.9 4.5 1.0 1.0 1.4
5.4 5.2 Neilands et al (1949) Neilands et al (1949) Pottinger and Baldwin (1940) Tuna Germo, Thunnus, and Neothunnus sp. Euthynnus pehmis 5.3 7.8 5.7 3 4.7 7.2 10.4 8.3 7.4 2.8 3.5 4.1 4.5 1.0 5.1 Neilands et al (1949) Okuda (1919) Miscellaneous Atlantic fish Gadus caUarias and Melano grammus aeglefinus Sebastodes sp. (red cod) Pagrus sp. Micropogon undulatus Hippoglossus hippoglossus
6.1 4.3 5.1 5.8 6.0
2.1 1.6 2.0 1.4 1.7
5.5 6.8 8.1 11.4 8.8 10.3
8.8 14.4 6.2 6.1 6.7
3.0 2.6 3.9 4.4 4.7 3.0
4.9 5.1 1.0 0.1 1.2 1.6
5.3 5.0 Neilands et al. (1949) Deas and Tarr (1949) Suzuki and Okuda (1912) Pottinger and Baldwin (1940) Pottinger and Baldwin (1940) Osborne and Heyl (1909) a See also Sugimura et al. (1954).
TABLE VII (continued) Species
.a Ö u <
ο .3 -ö V
s
.3 u
1 •
ο ο.a &
I
s<D Ö "8 "öS
1
υ Ö 'S
1
a
Ί
4-» 1 > Authors0 Lutianus bhckfordii 6.2 1.6— —
6.7— — —
1.2—
Pottinger and Baldwin (1940) Osborne and Heyl (1909) Mugil sp. 5.8 1.6— —
6.7:— — —
1.4—
Pottinger and Baldwin (1940) Osborne and Heyl (1909) Alosa sapidissima Salmon4.5 1.1
—
6.4 1.2 Pottinger and Baldwin (1940) Osborne and Heyl (1909) Oncorhynchus tschawytscha Oncorhynchus keta Oncorhynchus kisutch5.8 5.5 5.7
2.6 1.3 1.9
4.9 7.3 8.0 5.7 6.6 3.0 3.7 4.4 0.9 1.3 1.4
5.6 Neilands et al (1949) Pottinger and Baldwin (1940) Pottinger and Baldwin (1940) Trout Cynoscion regalis Cristivomer namaycush 5.9 5.7 1.4 1.4
— —
6.8 7.1— — —
1.0 1.2 Pottinger and Baldwin (1940) Pottinger and Baldwin (1940) Indian fish Rastrelliger kanagurta Stromateus niger Sardinella fimbriata Sardinella longiceps Zygaena blochii Leiognathus bindus Cynoglossus semifasciatus6.8 8.2 6.2 7.0 6.3 13.5 19.2
1.9 0.7 0.8 1.7 3.1 3.9 2.6
11 18.4 12.4 13.4 9.1 5.5 6.6
6.5 3.7 6.1 8.0 5.1 6.4 7.4
4.3 4.7 2.9 3.8 3.1
4.2 6.2 4.8 6.1 5.4 5.4 3.8
5.5 6.4 4.9 4.7 4.7 5.8 5.6
1.1 1.8 traces traces 2.1 2.1 1.9
6.0 6.4 8.8 5.9 5.6
Venkataraman and Chari (1957) Venkataraman and Chari (1957) Venkataraman and Chari (1957) Venkataraman and Chari (1957) Venkataraman and Chari (1957) Venkataraman and Chari (1957) Venkataraman and Chari (1957)
6. ORGANIC CONSTITUENTS OF FISH 161
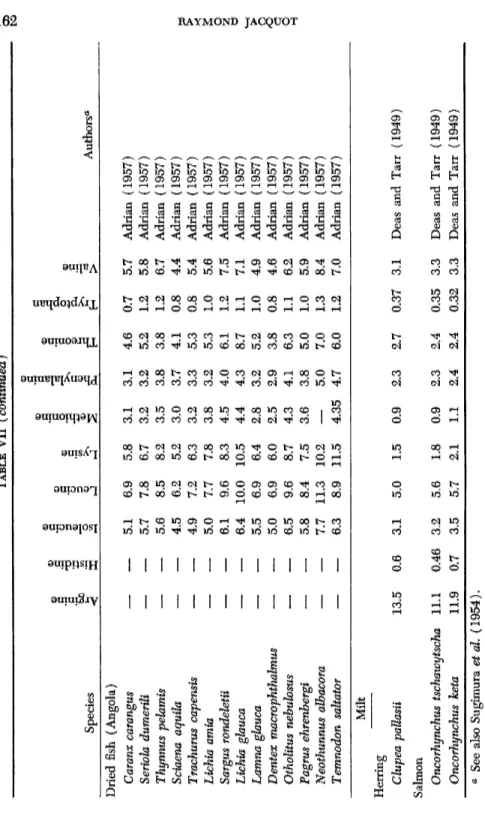
TABLE VII (continued) Species
© .3 .S bJO
<
G CO
c "o
1
J) 'o <D C/305 .a </> >^
1
sg
ο S
1
P-l ο ΗI >
Authors* Dried fish (Angola) Caranx carangus Seriola dumerili Thynnus pehmis Sciaena aquila Trachurus capensis Lichta amia Sargus rondeletii Lichta glauca Lamna glauca Dentex macrophthalmus Otholitus nehulosus Pagrus ehrenbergi Neothunnus albacora Temnodon saltator— —
5.1 5.7 5.6 4.5 4.9 5.0 6.1 6.4 5.5 5.0 6.5 5.8 7.7 6.3
6.9 7.8 8.5 6.2 7.2 7.7 9.6 10.0 6.9 6.9 9.6 8.4 11.3 8.9
5.8 6.7 8.2 5.2 6.3 7.8 8.3 10.5 6.4 6.0 8.7 7.5 10.2 11.5
3.1 3.2 3.5 3.0 3.2 3.8 4.5 4.4 2.8 2.5 4.3 3.6 4.35
3.1 3.2 3.8 3.7 3.3 3.2 4.0 4.3 3.2 2.9 4.1 3.8 5.0 4.7
4.6 5.2 3.8 4.1 5.3 5.3 6.1 8.7 5.2 3.8 6.3 5.0 7.0 6.0
0.7 1.2 1.2 0.8 0.8 1.0 1.2 1.1 1.0 0.8 1.1 1.0 1.3 1.2
5.7 5.8 6.7 4.4 5.4 5.6 7.5 7.1 4.9 4.6 6.2 5.9 8.4 7.0
Adrian (1957) Adrian (1957) Adrian (1957) Adrian (1957) Adrian (1957) Adrian (1957) Adrian (1957) Adrian (1957) Adrian (1957) Adrian (1957) Adrian (1957) Adrian (1957) Adrian (1957) Adrian (1957) Milt Herring Clupea pallasii Salmon Oncorhynchus tschawytscha Oncorhynchus keta
13.5 11.1 11.9
0.6 0.46 0.7
3.1 3.2 3.5
5.0 5.6 5.7
1.5 1.8 2.1
0.9 0.9 1.1
2.3 2.3 2.4
2.7 2.4 2.4
0.37 0.35 0.32
3.1 3.3 3.3
Deas and Tarr (1949) Deas and Tarr (1949) Deas and Tarr (1949) a See also Sugimura et al. (1954).
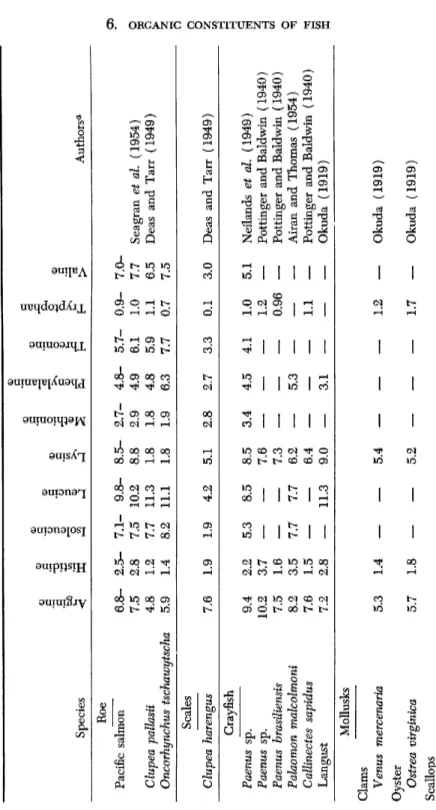
TABLE VII (continued) Species
Arginine Histidine Isoleucine Leucine Lysine Methionine Phenylalanine Threonine Tryptophan Valine
Authors** Roe Pacific salmon 6.8-2.5-7.1-9.8-8.5-2.7-4.8-5.7-0.9-7.0- 7.5 2.8 7.5 10.2 8.8 2.9 4.9 6.1 1.0 7.7 Seagran et al. (1954) Clupea pallasii 4.8 1.2 7.7 11.3 1.8 1.8 4.8 5.9 1.1 6.5 Deas and Tarr (1949) Oncorhynchus tschawytscha 5.9 1.4 8.2 11.1 1.8 1.9 6.3 7.7 0.7 7.5 Scales Clupea harengus 7.6 1.9 1.9 4.2 5.1 2.8 2.7 3.3 0.1 3.0 Deas and Tarr (1949) Crayfish Paenus sp. 9.4 2.2 5.3 8.5 8.5 3.4 4.5 4.1 1.0 5.1 Neilands et al. (1949) Paenus sp. 10.2 3.7
— —
7.6— — —
1.2—
Pottinger and Baldwin (1940) Paenus hrasiliensis 7.5 1.6— —
7.3— — —
0.96—
Pottinger and Baldwin (1940) Palaomon malcolmoni 8.2 3.5 7.7 7.7 6.2—
5.3— — —
Airan and Thomas (1954) Callinectes sapidus 7.6 1.5— —
6.4— — —
1.1—
Pottinger and Baldwin (1940) Langust 7.2 2.8—
11.3 9.0—
3.1— — —
Okuda (1919) Mollusks Clams Venus mercenaria 5.3 1.4— —
5.4— — —
1.2—
Okuda (1919) Oyster Ostrea virginica 5.7 1.8_
5.2 1.7 Okuda (1919) Scallops Pecten sp. 7.3 2.0—
8.7 5.7—
4.9— — —
Osborne and Jones (1909)6. ORGANIC CONSTITUENTS OF FISH 163
IV. Lipids
The liver and viscera (the pyloric caecum and mesenteria) constitute in all species the location for fat deposits. Sinnhuber and Law (1947) contribute in this respect the figures shown in the tabulation.
Oil percentages
Fish Liver Viscera
Halibut (Pacific) 11-27 3.6
Japanese smelt 12.2 5.3
Black cod 9.4 1.4
Bluefin tuna 9-35 2.5-39
King salmon 8-10 6.5
Shad 7.5 9
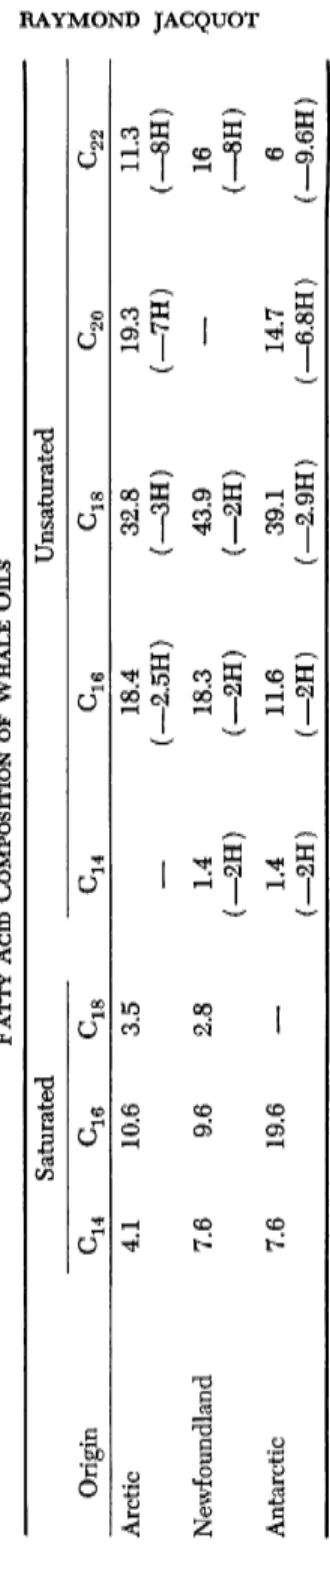
But fats are also encountered in the muscle tissue, the skin, milt, and roe. In whales, finbacks, and others, fats are found only in the connec
tive tissues, the highest proportion being localized in the flesh of the tail ( 2 0 % in the common finback and 3 7 % in the blue whale). The dorsal flesh does not contain more than 3 - 6 % fat and the ventral muscles 5-17%. In flatfishes, it was found that the skeleton and the liver are rich in fats, while viscera and flesh were poor in this respect (Morawa, 1957). The skeleton has been too little studied in this respect.
As indicated above various factors influence the degree of fattening.
Acquaintance of these is important, as the fat content frequently is a quality factor, and therefore related to price. For instance, the sprat of the Baltic is a choice product when caught in the month of November, when it has a lipid content of 14-18%. It is a mediocre food in June, when spawning has depleted the fat reserves and the fat content of the flesh falls below 1.5-5% (Lühmann, 1952). It is also stated that fish caught in bay areas, being better nourished, generally have a higher fat content than fish caught out at sea. Besides these quantitative variations, there are changes in the nature of the lipids.
A comprehensive review of this field was recently published by Kauf
mann and Miyakawa (1958). In tables they list, among other basic rela
tionships as to fat content, interesting examples showing the fat varia
tions in herring caught in different catching areas of the Channel, North Sea, and the Baltic; fluctuations in sea perch with season and in herring with sex and stage of maturity (age). See also Creac'h (1955).
6. O R G A N I C C O N S T I T U E N T S O F F I S H 165
A. F A C T O R S I N F L U E N C I N G N A T U R E O F L I P I D S
According to Lovern (1950), the causes for variation in the com
position of lipids in aquatic animals can be summed up as follows:
( a ) Species. There are genetic factors causing profound differences in the types of fat. Certain species reveal no specificity in this respect.
( b ) Diet. Although not as obvious as certain genetic factors, the influence of the diet may sometimes be important. The general tendency is to deposit fat with a composition similar to that of the feed. This factor becomes essential only when the diet contains appreciable pro
portions of fat.
( c ) Temperature. The lower the temperature, the higher is the de
gree of nonsaturation of the fatty acids. This effect is not too pro
nounced.
( d ) Salinity. The fat composition of fresh water fish is different from that of marine species. Salinity seems to be a critical factor in this respect. These conditions seem to have a similar effect upon lower links of the food chain such as crustaceans and plankton, and may consequently be important as a dietary influence on species further along in the food chain.
( e ) Selective Mobilization. Smaller lipid molecules are more readily utilized when the depot fat is metabolized. This influences the composition of the remaining fats and oils. Probably this factor is not too important.
(f) Selective Distribution. The fat is distributed to all parts of the body and their organs with a certain pattern. Sometimes this selective process operates on almost a molecular basis, causing notable modifica
tions in composition.
The above-mentioned six factors may, of course, be active in almost all kinds of combinations.
Taking into consideration only saturated fatty acids, certain basic differences are evident between ocean fishes and fresh-water fishes (see tabulation).
Types Percentage of unsaturated acids
C1 8 ^ 2 0 ^ 2 2
Ocean fishes 10 25 25 15
Fresh-water fishes 20 40 13 2.5
B . G E N E R A L C H A R A C T E R I S T I C S O F F I S H L I P I D S
The following common characteristics are encountered in fish oils:
( a ) As to saturated fatty acids, palmitic acid is always present to
10-18% of the total quantity of fatty acids; myristic and stearic acids occur in lesser quantities, the latter rarely exceeding 1-2%.
(b) As to highly unsaturated components present in essential quan
tities, in sea-water fish fatty acids with 18, 20, 22 carbon atoms are most abundant but with a varying degree of saturation. In fresh-water fish, fatty acids carry predominantly 16 ( 3 0 % of the total) and 18 carbon atoms. Contrary to animal fats and vegetable oils, fish lipids contain little or mostly no linolenic acid (see Chapter 7 ) .
(c) As to the structure of the glyceride molecules, the three alcohol sites may be esterified either by the same fatty acid or by different ones.
The most common unsaturated fatty acids are the following:
( 1 ) Monoenoic acids: palmitooleic acid with C i6; gadoleic acid with C2o; cetoleic acid with C2 2; selacoleic acid with C24 (abundant in shark oil but not encountered so far among the teleosteans).
( 2 ) Polyenoic acids: clupanodonic acid with C2 2, which is most abundant and contains five double bonds; arachidonic acid with C2o and four double bonds; hiragonic acid with C i6 and three double bonds;
minisic and thynnic acids with C2 4, the composition of which so far is not well established in spite of numerous studies.
C. S P E C I A L F E A T U R E S
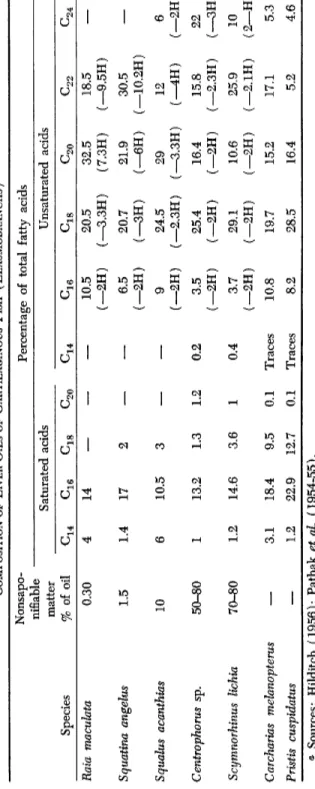
1. Elasmobranchs
In the liver oil of these species, the content of saturated fatty acids is relatively high, while the proportion of unsaturated fatty acids with Ci8 is above the average for other families of marine animals (Table V I I I ) .
Some of the oils have a highly specific composition, viz., in the shark group. Liver oil from Scymnorhinus lichia contains much alkoxyglycer- ides and squalene (Lovern, 1950). Therefore, various efforts have been made to classify in categories the liver oils from elasmobranchs. Pathak et al. (1954-55) distinguish four categories as to the content of un
saturated fatty acids and the degree of saturation. The first three groups contain around 2 0 % saturated fatty acids, the fourth group contains more. In this latter group are classified the liver oils of the following sharks: Carcharias melanopterus ( 3 1 % saturated fatty acids), Pristis cuspidatus ( 3 7 % ) , Galeocerdo tigrinus ( 4 0 % ) . Tsujimito (1927-28) made the following observations with regard to the unsaponifiable matter:
( 1 ) . When low ( 1 - 2 % ) , it consists chiefly of cholesterol.
TABLE VIII COMPOSITION OF LIVER OILS OF CARTILAGINOUS FISH ( ELASMOBRANCHS ) a Nonsapo-
•£»1 1
Percentage of total fatty acids ninable matter Saturated acids Unsaturated acids Species % of oil ^16 C18 G16 G18 ^22 G24 Rata macuhta 0.30 4 14—
10.5 (-2H) 20.5 (—3.3H) 32.5 (7.3H) 18.5 (—9.5H) Squatina angelus 1.5 1.4 17 2—
6.5 (-2H) 20.7 (-3H) 21.9 (-6H) 30.5 (—10.2H) Squalus acanthias 10 6 10.5 3—
9 (-2H) 24.5 (—2.3H) 29 (—3.3H) 12 (-4H) 6 (—2H) Centrophorus sp. 50-80 1 13.2 1.3 1.2 0.2 3.5 (-2H) 25.4 (-2H) 16.4 (-2H) 15.8 (—2.3H) 22 (-3H) Scymnorhinus lichia 70-80 1.2 14.6 3.6 1 0.4 3.7 (—2H) 29.1 (-2H) 10.6 (-2H) 25.9 (-2.1H) 10 (2—H) Carcharias mehnopterus—
3.1 18.4 9.5 0.1 Traces 10.8 19.7 15.2 17.1 5.3 Pristis cuspidatus—
1.2 22.9 12.7 0.1 Traces 8.2 28.5 16.4 5.2 4.6 « Sources: Hilditch (1956); Pathak et al (1954-55).CM ^20 Gl. ^20
( 2 ) . When average ( 1 0 - 3 5 % ) , it contains, besides cholesterol, large quantities of long-chain alcohols, saturated or unsaturated (selachylic, chimylic, and batylic alcohols). Lovern observed that the presence of these alcohols in sufficient quantity brings with it a marked diminution of the proportion of nonsaturated fatty alcohols. The content of saturated alcohols increases and the glycerides are practically absent. This is the case in liver oil of the rabbit fish.
( 3 ) . When considerable, it is represented particularly by a highly unsaturated terpenic hydrocarbon called squalene (C3oH5o) (Tsujimito, 1935). In the liver of Formosa sharks, the proportion of unsaponifiable matter reaches 87.5% and that of hydrocarbons reaches 8 4 % (Hata and Kunisaki, 1940). Hamm (1950) offers a number of analytical data re
garding physical and chemical qualities of certain liver oils of elasmo
branchs, apparently belonging to the Tsujimito group 1 or 2 above.
These values differ considerably from those found for sharks caught in other oceans, such as Hexanchus griseus (Hilditch, 1956).
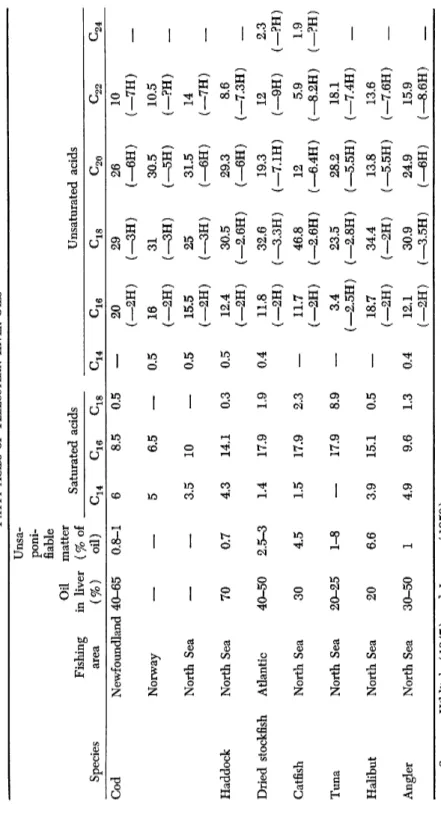
2. Teleosteans
It is necessary to distinguish between liver and body oils.
Table I X has been compiled on the basis of data available in Hilditch (1947) and Lovern (1950).
The variations in the composition of the liver oils are obvious, not only between species but also within one and the same species.
Body oils of teleosteans have been particularly studied as to yield of oil, its composition, and physical and chemical characteristics. In this connection, reference should be made to the following studies: Black and Schwartz (1950b), Krvaric and Muzinic (1950) on the pilchard and horse mackerel; Chidambram et al. (1952) on the Indian mackerel;
Wilber and del Porno (1949) on arctic stickleback and guppy, etc. In addition come the fundamental studies by Hilditch (1947), Deuel
(1957), and Lovern (1942).
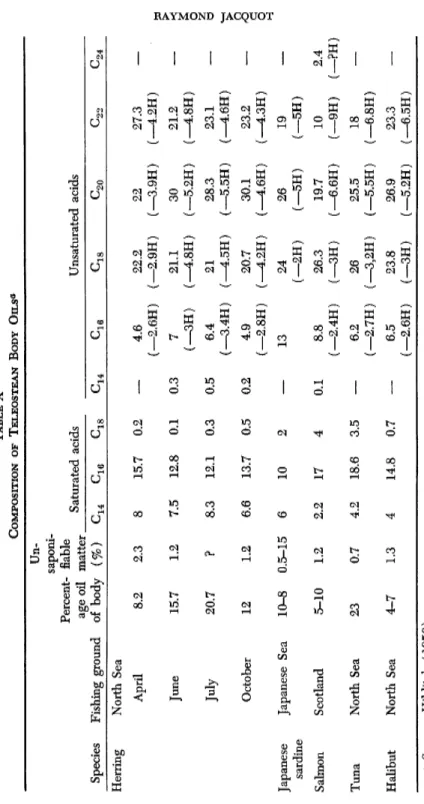
Table X gives the values published by Hilditch (1956).
Apart from the variations from one species to the other, one finds a small content of nonsaturated C i6 acids and a particularly high con
tent of nonsaturated C2 2 acids. In certain cases, as in the Japanese (Pacific) herring, small quantities of lauric ( C i2) , capric ( C i0) , and caprylic acid ( C8) were identified.
According to Swain (1952), one of the most common fatty acids in fish oils has six double bonds and reaches a degree of insaturation 5 0 %
TABLE IX FATTY ACIDS OF TELEOSTEAN LIVER ODLS* Unsa- Fishing area
Oil in liver
poni- fiable matter (% of Saturated acids Unsaturated acids Species Fishing area (%) oil) C16 ^18 C18 Cod Newfoundland 40-65 0.8-1 6 8.5 0.5
—
20 (—2H) 29 (-3H) 26 (—6H) 10 (-7H) Norway— —
5 6.5—
0.5 16 (-2H) 31 (-3H) 30.5 (-5H) 10.5 (-?H)_
North Sea— —
3.5 10—
0.5 15.5 (-2H) 25 (-3H) 31.5 (-6H) 14 (—7H)_
Haddock North Sea 70 0.7 4.3 14.1 0.3 0.5 12.4 (-2H) 30.5 (—2.6H) 29.3 (—6H) 8.6 (—7.3H) Dried stockfish Atlantic 40-50 2.5-3 1.4 17.9 1.9 0.4 11.8 (-2H) 32.6 (—3.3H) 19.3 (-7.1H) 12 (-9H) 2.3 (-?H) Catfish North Sea 30 4.5 1.5 17.9 2.3—
11.7 (-2H) 46.8 ( —2.6H) 12 (—6.4H) 5.9 (—8.2H) 1.9 (-?H) Tuna North Sea 20-25 1-8—
17.9 8.9—
3.4 (—2.5H) 23.5 (—2.8H) 28.2 (—5.5H) 18.1 (_7.4H) Halibut North Sea 20 6.6 3.9 15.1 0.5—
18.7 (-2H) 34.4 (-2H) 13.8 (—5.5H) 13.6 (—7.6H) Angler North Sea 30-50 1 4.9 9.6 1.3 0.4 12.1 (-2H) 30.9 (—3.5H) 24.9 (—6H) 15.9 (—8.6H) <* Sources: Hilditch (1947) and Lovern (1950).Cl4 C16 ^20 ^22 ^24 C16
TABLE X COMPOSITION OF TELEOSTEAN BODY OILS0 Un- Percent age oil of body saponi- fiable matter Saturated acids Unsaturated acids Species Fishing ground
Percent age oil of body (%) ^16 C18 ^16 C18 ^20 ^22 ^24 Herring North Sea April 8.2 2.3 8 15.7 0.2 — 4.6 22.2 22 27.3 April (—2.6H) (—2.9H) (—3.9H) (—4.2H) June 15.7 1.2 7.5 12.8 0.1 0.3 7 21.1 30 21.2 June (-3H) (_4.8H) (—5.2H) (_4.8H) July 20.7 ? 8.3 12.1 0.3 0.5 6.4 21 28.3 23.1 July (-3.4H) (-4.5H) (—5.5H) (_4.6H) October 12 1.2 6.6 13.7 0.5 0.2 4.9 (—2.8H) 20.7 (—4.2H) 30.1 (_4.6H) 23.2 (-4.3H) Japanese sardine Japanese Sea 10-8 0.5-15 6 10 2 — 13 24 (-2H) 26 (—5H) 19 (-5H) Salmon Scotland 5-10 1.2 2.2 17 4 0.1 8.8 (—2.4H) 26.3 (—3H) 19.7 (—6.6H) 10 (-9H) 2.4 (—?H) Tuna North Sea 23 0.7 4.2 18.6 3.5 — 6.2 (—2.7H) 26 (—3,2H) 25.5 (—5.5H) 18 (—6.8H) — Halibut North Sea 4-7 1.3 4 14.8 0.7 — 6.5 (—2.6H) 23.8 (—3H) 26.9 (—5.2H) 23.3 (—6.5H) — <* Source: Hilditch (1956).
c14 CM