Chapter 3
In Vitro Protein EvaluationA . LEONARD SHEFFNER
Department of Nutritional Biochemistry Mead Johnson Research Center
Evansville, Indiana
I. Introduction 125 II. Chemical Scores 128
A. Chemical Score of Mitchell and Block 128 B. Protein Scores by the FAO/WHO Procedure 132
III. Integrated Amino Acid Indices 134 A. Kuhnau's Integrated Index 135 B. Oser's Essential Amino Acid Index 137 C. Discussion of Integrated Essential Amino Acid Indices . 1 4 0
IV. Chemical Methods of Evaluating Protein Quality 141
A. Simple Nitrogen Analysis 141 B. Urease Inactivation 142 C. Protein Solubility Tests 143 D. Tests for Specifically Reacting Amino Groups 144
V. Enzymatic and Microbiological Methods for Measuring Protein Quality 147 A. Enzymatic Methods for Measuring Amino Acid Availability . 148 B. Microbiological Methods for Evaluation of Protein Quality 150 VI. The Pepsin Digest-Residue (PDR) Amino Acid Index 158
A. Experimental Basis for the P D R Index 159 B. Methods and Materials Used in Developing the P D R Index . 164
C. Calculation of the P D R Index 165 D. Measurement of the Net Protein Utilization of Heat-Processed Pro-
teins by the P D R Index 168 E. The P D R Index Values of Dehydrated Beef, Fish, and Beans . . 174
F. The P D R Index of Irradiated and Heated Foods 178
G. Discussion of the P D R Index Method 183
VII. Modifications of the P D R Index 184 A. A Pepsin-Pancreatin Digest Index of Protein Quality 184
B. A Shortened P D R Index 186
VIII. Conclusion 190 References 191
I. INTRODUCTION
The evaluation of proteins and mixed protein diets for nutrition in man and animals can be accomplished most accurately in the species for which the proteins are intended and under the circumstances in which they are
125
used. Since this can seldom be accomplished, proteins are more conven- iently tested in a variety of other species having analogous nutritional requirements. More recently, through our increased knowledge of amino acid requirements, better methods of amino acid analysis, and an appreciation of the importance of amino acid availability, laboratory methods have been developed which accurately reflect protein quality as applied to specific species and conditions.
Nevertheless, there are marked differences in the nutritive value of different types of proteins of similar amino acid content, and wide varia- tions in the nutritive quality of different samples of the same protein.
Variations of this kind—which arise from differences in strain or variety, from variations in raw material sources, and from changes induced by processing—impose severe limitations on the choice of a single figure which can be representative of the nutritive value.
Animal tests provide the standards by which laboratory procedures must be assessed. But the animal tests available do not all yield the same type of information, nor are they equally useful. Some of those frequently used are reviewed briefly.
The protein efficiency ratio (PER) is the gain in weight of a growing animal divided by its protein intake. It is a measure of protein quality when determined under specific conditions. However, as pointed out by Block and Mitchell (1) the PER is not a true efficiency ratio because not- all the protein is used for growth, only that consumed above maintenance (2). Also, Mitchell has criticized the PER because it varies with the food intake ( 3 ) . The PER is used mainly in feeding experiments with small animals and has been used in studies on infants.
The biological value (BV) is determined by nitrogen balance and is defined by the ratio nitrogen retained: nitrogen absorbed (4). This expres- sion of protein quality measures the percentage of absorbed nitrogen retained for growth and maintenance, but it does not include a correction for incomplete absorption. The protein must be fed at or below the level needed for maintenance in order to achieve maximum efficiency of utilization. Generally this level is 9 to 10% of the diet (w/w).
The net protein utilization (NPU) expresses in a single index both the digestibility and BV of a protein. It is the product of the coefficient of digestibility and the BV, and therefore represents the proportion of food nitrogen retained, i.e., nitrogen retained: nitrogen intake. The efficiency with which a protein is utilized is diminished if the caloric intake is too low or if the protein is fed in excess. For comparison of the quality of proteins, the NPU is measured under standardized conditions, with protein supplied at or below maintenance levels in a diet providing adequate calories (NPUst). The term NPU operative (NPUop) refers
to the utilization of a protein under those conditions in which it is actually eaten.
The efficiency and concentration of a protein may be combined in a single index, called the net dietary protein value (NDPV) (5). This expression is the product of protein concentration and NPU (determined at the same protein level). The term N DpC a l % (6) is used when in the latter expression protein concentration is expressed as a percentage of calories in the diet.
Growth results have also been assessed in terms of the contribution which a protein makes when used as a supplement to a standardized diet. For example, the gross protein value (GPV) for chicks measures the value of a protein source as a supplement for cereals (7, 8).
Granting that the nutritional quality of a protein must be established biologically, there are many advantages to be derived from an in vitro method which accurately predicts the quality of a protein; these advan- tages are primarily the saving of time, space, and expense.
The earliest in vitro methods assessed protein concentrates as sources of dietary nitrogen for use in animal feed formulations. For this purpose the conventional Kjeldahl method was used. Subsequently, various solubility tests were introduced hopefully to provide an indication of the protein quality of animal feeds. For special situations, such as in estimat- ing the heat treatment required for optimal nutritional value of soybean meals, the measurement of residual enzyme activity, e.g., urease, has been used.
Only since the publication in recent years of accurate and relatively simple methods for amino acid analysis has it been feasible to develop reliable in vitro procedures for the measurement of protein quality (9-11).
These procedures, based upon chemical analysis of proteins for their essential amino acids, yield figures which are well correlated with bio- logical values. In addition, they provide an indication of the essential amino acids limiting nutritional quality, and thus, the means of combining proteins or adding amino acids for most effective supplementation.
Nevertheless, for certain proteins the calculated values do not agree with the results of animal assays. In addition, an obvious fault with these methods is that the biological values of many proteins are considerably changed by heat processing in the absence of discernible destruction of amino acids. These discrepancies have been attributed by Mitchell and Block (9) to the following possibilities:
1. The digestibility of the protein may be depressed (12).
2. A decreased digestibility may involve the elimination in the feces of a protein fraction containing disproportionate amounts of certain amino acids (13).
3. The application of heat to a protein may promote certain combina- tions between terminal groupings that are resistant to proteolytic action, resulting in atypical peptides that may be absorbed as such (14, 15) and excreted in the urine.
Thus, in tests of protein quality which are based upon amino acid composition, the concept of amino acid "availability" must be introduced.
A variety of procedures have been developed to measure amino acid availability in vitro (16-18) and their agreement with changes in the PER measured on growing rats has been reasonably good.
Sheffner, Eckfeldt, and Spector developed an integrated index which combined the pattern of essential amino acids released by in vitro pepsin digestion with the amino acid pattern of the remainder of the protein (19). The new index—called the pepsin digest-residue (PDR) index—was found to correlate closely with the NPU value of a variety of proteins.
Subsequent application of the procedure to heat-processed protein foods indicated that the PDR index also accurately predicted changes in the NPU of the treated proteins as well (20). A modification of the PDR index utilizing ion-exchange chromatography, rather than microbiological analysis for amino acids, was published recently by Akeson and Stahmann (21).
In this chapter, I shall describe and briefly discuss many of the procedures which have contributed conceptually as well as practically to the development of in vitro methods for the evaluation of protein quality. Special emphasis will be placed on the PDR index, which was developed in the author's laboratory. In addition, a shortened P D R index is presented which appears to correlate well with the NPU of a variety of proteins, including seme subjected to heat processing.
II. CHEMICAL SCORES
A. Chemical Score of Mitchell and Block
Mitchell and Block (9) were the first to provide a reasonably suc- cessful method for the chemical evaluation of proteins based on amino acid content. The chemical score, as defined by Mitchell and Block, measured the value of proteins for growth only, since it was based on the concept that the complete absence of an essential amino acid renders a protein completely unavailable for the synthesis of body proteins. It was their idea to judge the nutritive adequacy of a protein by comparison of its amino acid composition with that of a reference protein (whole egg protein). The ratio of the quantity of each essential amino acid in a test protein compared to the quantity of the respective amino acid in whole egg protein was computed and stated as a percentage value (the egg ratio).
The nutritive value of the protein was originally expressed as a "chemical score," equal to the greatest percentage deficit in an essential amino acid in a protein or mixture of proteins being evaluated; thus, the score was set as 100 for any protein or protein mixture completely devoid of any one essential amino acid (1). However, later the chemical score was taken as the lowest egg ratio, i.e., 100 minus the greatest percentage deficit of an essential amino acid relative to that present in egg protein (9). The lower the lowest egg ratio the poorer the protein is as a source of amino acids;
the larger the chemical score the better is the protein.
The protein used as a standard was whole egg which had earlier been shown to be nearly perfectly utilized in digestion and in metabolism for the growing rat (22), the mature rat (23), the dog (24), and adult man (25). Mitchell had also shown (26) that the growth-promoting value of whole egg protein, when carefully prepared to avoid heat and other damage, was not improved for the growing rat by supplementation with any of the essential amino acids except lysine, which induced a 3 % increase (statistically significant) in body weight in a 28-day feeding period. The absence of nutritionally unavailable essential amino acids in whole-egg proteins was demonstrated by the fact that the substitution of whole egg for starch at low levels in a nitrogen-free diet fed to rats did not appreciably increase the output of urinary nitrogen (23). Bender (27) has since reported that whole egg may have an approximately 15%
surplus of essential amino acids for maximum NPU, but not necessarily for maximum growth of the rat.
The amino acid content of the proteins was computed on the basis of a uniform protein containing 16% nitrogen, according to the method used by Block and Boiling (28). This was justified on the basis that utilization of dietary proteins by animals can best be studied by the nitrogen balance sheet method. Thus, an amino acid analysis of protein would be most useful in protein nutrition as a chemical description of the nitrogen contained in it.
1. Calculation of Chemical Score
All concentrations of amino acids in proteins to be compared are calculated to 16.0 gm of nitrogen. If the protein contains 18.6% of nitrogen, then the amino acid value (w/w) is multiplied by the factor 16/18.6, or 0.86. If the nitrogen of the product is only 12.2%, then the amino acid figure is multiplied by the factor 16/12.2 = 1.31.
The essential amino acid compositions ofjseveral proteins are shown in Table I.
The ratio of the quantity of each essential amino acid in a food protein to the quantity of the respective amino acid in the same amount
T A B L E I
ESSENTIAL AMINO ACID COMPOSITION OF VARIOUS FOOD PROTEINS0 Whole Lactal- Soy White Amino acids egg bumin Casein flour flour
Histidine 2. 6 2. 2 3. 2 2. ,6 1.9
Lysine 7. ,8 9. .4 8. 1 6. ,3 2 . 2
Methionine 3. .2 2 .2 3. .0 1, ,3 1.8
Cystine 2. .1 1. .5 0. 3 1, .0 1.2
Methionine + cystine 5. .3 3 .7 3. .3 2 3 3 . 0
Phenylalanine 5 .5 4 .0 5 .5 4 .6 4 . 4
Tyrosine 3 .8 3 .4 5. ,2 3 .1 2.7
Phenylalanine + tyrosine 9 .3 7, .4 10 .7 7, .7 7.1
Leucine 8 .8 13 .0 9, .8 8, .1 7.8
Isoleucine 5 .9 7. .8 5 .8 5 .6 4 . 6
Valine 7. .1 6 .6 7, .2 5 .6 4.7
Threonine 4 .9 6 .0 4 .1 3 .8 2 . 8
Tryptophan 1 .4 2 .3 1 .2 1 .5 1.0
Total 53 .1 58 .4 53 .4 43 .5 35.1
a Obtained by microbiological assay. Values stated as grams per 16 gm of nitrogen.
T A B L E II
EGG RATIOS OF ESSENTIAL AMINO ACIDS IN VARIOUS FOOD PROTEINS
Lactal- Soy White
bumin Casein flour flour
Amino acids (%) (%) (%) (%)
Histidine 85 100 100 70
Lysine 100 100 81 28«
Methionine 69 94 U 56
Methionine + cystine 70 62 43 57
Phenylalanine 73 100 84 80
Phenylalanine + tyrosine 80 100 83 76
Leucine 100 100 92 88
Isoleucine 100 98 95 78
Valine 93 100 79 66
Threonine 100 84 78 57
Tryptophan 100 86 100 71
a The chemical score, based on the limiting amino acid, is italicized.
of egg protein is then computed. These ratios are called egg ratios and are expressed as percentages. These values are presented in Table II.
The limiting amino acid for each protein is taken to be that essential amino acid which has the greatest percentage deficit, i.e., the smallest egg ratio. Since methionine is metabolically convertible into cystine, but the reverse reaction does not occur, the limiting factor between these two is assumed to be methionine, or methionine plus cystine, whichever percentage deficit is the greater. The same relationship exists between the essential amino acid phenylalanine and the nonessential amino acid tyrosine, and these are treated in a like manner.
Histidine should be used when evaluating the score for the growing rat, but not for man since this amino acid is not essential in human nutrition.
Thus, the limiting amino acid for lactalbumin is methionine, and its chemical score is 69. For casein the limiting amino acids are methionine plus cystine, and its chemical score is 62. The chemical score for soy flour is 41 (methionine limiting) and for white flour is 28 (lysine limiting).
2. Discussion of the Chemical Score
There are obvious imperfections in the correlation between the chemical score and the biological data shown in Table III. Block and Mitchell presented other numerous comparisons in their original papers and commented that animal tissues, muscle, liver, kidney, and heart, rank higher on the chemical scale than on the biological scale. On the other hand, wheat germ proteins are rated much lower on the basis of their chemical scores than on their biological performances. Nevertheless, the correlation coefficient of the regression line relating chemical score with biological value was found to be 0.861 on the basis of biological
T A B L E I I I
COMPARISON OF THE CHEMICAL SCORE, BIOLOGICAL VALUE, AND N E T PROTEIN UTILIZATION VALUE OF FOOD PROTEINS
Chemical Protein Biological
Protein score0 score6 value N P U
Whole egg 100 100 98 97 ;
Lactalbumin 69 63 84 82
Soy flour 41 53 75 72
Casein 62 62 68 66
White flour 28 43 52 52
° Chemical score—Block and Mitchell.
b Protein score—F AO /WHO Expert Group.
values obtained with growing rats, and 0.833 when data obtained with growing pigs and dogs were included.
B. Protein Scores by the FAO/WHO Procedure
An alternative method for scoring proteins on the basis of their limiting essential amino acids was proposed by the 1963 Joint Food and Agricultural Organization/World Health Organization Expert Group (29). In the 1957 report of the FAO Committee on Protein Requirements (30) the provisional pattern of amino acid requirements was used to determine a protein score. This measured "the extent to which a food or food combination supplies the limiting amino acid as compared with the provisional pattern/' based on an estimate of the requirements of healthy human beings.
As noted by the FAO/WHO group, the provisional FAO pattern provided for more "nonessential" amino acid nitrogen than is found in natural diets. Thus, the utilization of essential amino acids for the synthesis of the nonessentials was minimized. Also, it was noted that the overall proportion of available amino acids is more important in deter- mining quality than simply the absolute amount of each of the essentials.
An unbalanced pattern may adversely affect nutrition even if the quan- tity of essentia] amino acids is sufficient. In this respect, there is evidence that the proportion of sulfur-containing amino acids (methionine plus cystine), tryptophan, and lysine in the FAO provisional pattern is too high (29). Correction of the FAO pattern for these high values made the pattern resemble that of whole egg and human milk more closely.
Therefore, the FAO/WHO Expert Group recommended adoption of the essential amino acid pattern of either egg or human milk for reference purposes.
Protein requirements for growth and maintenance are most efficiently achieved when the diet furnishes the required quantity of balanced protein (31). A balanced protein may be defined as one in which the essential amino acids are each present in optimal ratios to each other for the highest efficiency of utilization for new tissue formation and for repair of preexisting tissues; it is implied, of course, that the protein contains sufficient nonessential amino acids to minimize metabolic diversion of the essential amino acids from their function in tissue formation.
Therefore, another feature adopted by the FAO/WHO group was that the amino acid reference pattern be presented in terms of the relationship of each essential amino acid to the total of essential amino acids. This was done to facilitate the separate investigation of the effect of changes in the ratios of essential amino acids to each other and the
relationship between the essential and nonessential amino acid com- ponents of the protein requirement.
Such a pattern, that is, the ratio of each essential amino acid to the total content of essentials, had been introduced earlier by Sheffner et al.
in their P D R index of net protein utilization (19). This had been done to evaluate separately the pattern of essential amino acids as well as the total quantity of essentials per unit protein.
The concept of pattern was taken to mean that the nutritive value of a protein with a partial deficiency of one essential amino acid is limited to that fraction of the protein which has the appropriate balance of amino acids. If the single limiting amino acid is present as a certain fraction of the requirement for balance, then only that balanced fraction of the protein is usable for growth. Thus, increasing the amount of the imbal- anced protein in the diet, within limits, will increase the quantity of balanced protein which is available.
1. Calculation of Protein Scores by the FAO/WHO Procedure
To calculate the protein score: (a) Add up the contributions of all the essential amino acids, together with those of cystine and tyrosine;
(b) calculate the percentage contributions of the potentially limiting amino acids to this total; (c) compare these percentages with the cor- responding ones for the reference pattern.
The concentration of essential amino acids in whole egg protein, which is used as the standard, is given in Table I. In whole egg protein the total quantity of essential amino acids for the growing rat is 53.1 gm per 16 gm of nitrogen (for man the value for histidine is subtracted from the total). Of these, methionine and cystine furnish 5.3 gm, or 10.0%; lysine furnishes 7.8 gm, or 14.7%; and tryptophan? furnishes 1.4 gm, or 2.6%. The percentage pattern for whole egg and several other proteins, as calculated in this manner, is shown in Table IV. The ratio of the percentages in the test protein to that in whole egg (egg ratio) is then determined in the same manner as used in the chemical score method of Mitchell and Block.
For example, the limiting essential amino acids for soy flour, relative to that in whole egg protein, are methionine plus cystine (which are taken as a unit). The egg ratio for these amino acids is 5.3/10.0 or 53%, and thus the protein score for soy flour is 53. I t is pertinent that the FAO/
WHO group used the quantity of total sulfur amino acids when these were limiting; Mitchell and Block used methionine, or methionine plus cystine, whichever percentage deficit was the greater.
A comparison of "chemical score" and "protein score" values are
T A B L E I V
ESSENTIAL AMINO ACID PATTERN OF VARIOUS FOOD PROTEINS CALCULATED AS THE PERCENTAGE OF TOTAL ESSENTIAL AMINO ACIDS
Whole egg
(reference Lactal- Soy White
Amino acids standard) bumin Casein flour flour
(%) (%) (%) (%) (%) (%)
Histidine 4.9 3 . 8 6.0 6.0 5.4
Lysine 14.7 16.1 15.2 14.5 6.3
Methionine 6.0 3.8 5.6 3 . 0 5.1
Cystine 4 . 0 2.6 0.6 2.3 3 . 4
Methionine + cystine 10.0 6.3 6.2 5.3 8.5
Phenylalanine 10.4 6.8 10.3 10.6 12.5
Tyrosine 7.2 5.8 9.7 7.1 7.7
Phenylalanine + tyrosine 17.5 12.7 20.0 17.7 20.2
Leucine 16.6 22.3 18.4 18.6 22.2
Isoleucine 11.1 13.4 10.9 12.9 13.1
Valine 13.4 11.3 13.5 12.9 13.4
Threonine 9 . 2 10.3 7.7 8.7 8.0
Tryptophan 2 . 6 3 . 9 2.2 3 . 4 2 . 8
presented in Table III. In some cases, for example, soy flour and white flour, the protein scores are closer to the biological values than are the chemical scores; however, with lactalbumin the protein score is not as close. By either procedure, however, the "score" tends to underestimate the experimentally obtained biological value (or the net protein utiliza- tion) of food proteins.
I I I . INTEGRATED AMINO ACID INDICES
The concept of chemical or protein "scores" was based on the amino acid requirements for growth as differentiated from those for maintenance of body tissues. However, Block (31) presented evidence that (a) tissue loss is relatively independent of the supply of amino acid, and (b) the amount of tissue synthesized—whether for growth or maintenance—is proportional to the supply of essential amino acids. Thus, there are probably no important differences in amino acid utilization for growth as compared to that for maintenance. Differences in requirements, such as between the adult and young growing rat for lysine, may be related to differences in amino acid catabolism or in utilization for specific metabolic processes.
The protein requirement for growth is also generally small compared to that for maintenance, even in the rapidly growing animal or infant.
For example, the caloric requirement of a 1-week-old infant is about 120 cal/kg. Approximately 40% of this is for growth (32) and the remaining
60% is for basal metabolic needs and loss in excreta. Assuming the amount of nitrogen required for daily maintenance to be 2 mg per basal calorie (33), 144 mg Ν is needed for maintenance out of the estimated total requirement per kilogram of 368 mg Ν (2.3 gm reference protein) (29). Even in the first week of life only 6 1 % of the nitrogen requirement is for growth. By 3 months of age, the requirement for growth is only 36%, after 6 months 26% and by one-year is only about 14% of the total nitrogen requirement (29). Thus, the chemical and protein "scores,"
which theoretically measure the value of a protein only for growth, should not be expected to predict accurately the biological value which measures the utilization of a protein for growth plus maintenance.
It is obvious that a chemical score as defined by Mitchell and Block or by the FAO/WHO procedures can be only a partial measure of the biological value of a protein; for more accurate evaluation it became necessary to approach the problem in a different manner.
In order to improve the accuracy of the "score" methods, these additional factors had to be considered: (a) essential amino acids are used in metabolic processes other than for the synthesis of proteins;
and (b) all the necessary amino acids must be available at the site and at the time of synthesis of tissue proteins.
Amino acids are used in metabolism for more than the synthesis of proteins. They take part in a variety of reactions and are used as source material for the synthesis of compounds in which the full comple
ment of amino acids is not required. Therefore, the utilization of a protein is not entirely limited by a deficiency in a single amino acid. Furthermore, the need for all the essential amino acids to be presented to the body within a specific time interval has been emphasized by several investi
gators (34-37).
It has been suggested that the "free" amino acid composition of the intestinal contents remains rather uniform when proteins of widely varying composition are ingested (38). However, data obtained by Sheffner and Bergeim (39) and by Longenecker and Hause (40) have shown that the changes in tissue and plasma amino acids which occur following the ingestion of protein reflect, although not precisely, the amino acid composition of the administered protein. Thus, it is reasonable to consider the entire essential amino acid content of a protein or diet in order to properly evaluate its biological value.
A. Kuhnau's Integrated Index
Kuhnau, in 1949, proposed a method of rating proteins according to the sum of the percentages of essential amino acids (10). He used the amino acid composition of human milk as the standard of comparison.
The percentages of the essential amino acids, plus cystine, arginine,
and tyrosine, in the mixed proteins of human milk were summed. A similar computation was made for the proteins to be evaluated. The ratio of the sum for the test protein to that of the reference protein was called the "total value" (gesamte Wertigkeit). But this computation credits the test protein with concentrations of amino acids in excess of those occurring in the reference protein, excesses that presumably con- tribute little to the inherent nutritive value of the protein.
Therefore, Kuhnau repeated the summation, disregarding these excesses, to obtain a "pure value" (reine Wertigkeit). The differ- ence between these two values is called the "supplementary value"
{Erganzungswertigkeit), and is presumably available for supplementary relations with other proteins that may be deficient in those amino acids which occur in excess in the test protein.
1. Calculation of the Nutritive Value of Proteins by the Method of Kuhnau
An example of Kuhnau's method of calculating the nutritive value of casein is presented in Table V. Since arginine is generally considered to be synthesized by the rat (although not sufficiently for maximum growth)
TABLE V
CALCULATION OF THE NUTRITIVE VALUE OF CASEIN BY THE METHOD OF K U H N A U "
Excess of test
Human over reference
Amino acids milk6 Casein protein
Histidine 2.2 3 . 2 1.0
Lysine 6.6 8.1 1.5
Methionine 2 . 0 3 . 0 1.0
Cystine 2 . 0 0.3 —
Phenylalanine 4.3 5.5 1.2
Tyrosine 5.2 5.2
—
Leucine 9.1 9.8 0.7
Isoleucine 5.5 5.8 0.3
Valine 6.3 7.2 0.9
Threonine 4 . 5 4.1
—
Tryptophan 1.6 1.2
—
Sum 49.3 53.4 6.6
"Total" value 100 108
53.4 - 6.6
"Pure" value
—
49.3 = 95—
"Supplementary" value — 108 - 95 = 13
—
a Values expressed as grams per 16 gm of nitrogen.
6 From average values published by Orr and Watt (41).
and by man, this amino acid has not been included in the calculations. The values for casein were obtained by microbiological assay in the author's laboratory and those for human milk as published by Orr and Watt (41).
Summation is made of the essential amino acids in the reference pro- tein (human milk), plus cystine, tyrosine, and histidine (Table V).
Conceivably, histidine should be omitted when Kuhnau's index is used for evaluating the nutritive value of a protein for man.
The total of the essential amino acids in human milk proteins (based on 16 gm for nitrogen) is 49.3. A similar summation for casein yields a value of 53.4. Dividing 53.4 by 49.3 gives 108, the "total" value for casein. The value for the reference protein is arbitrarily set at 100.
The summation for casein is repeated, this time disregarding the quantities of amino acids in excess of those occurring in the reference protein. The new sum divided by the 49.3 gives a value of 95, the "pure"
value. The difference between the "total" and "pure" values is 13, the
"supplementary" value.
2. Discussion of Kuhnau's Index
Kuhnau's method at first impression does not appear to provide an accurate estimate of biological value. However, closer scrutiny of its development indicates that when first conceived the amino acid values available for human milk protein, the reference protein, were considerably higher in many cases than those now considered to be correct.
Computation of Kuhnau's index using amino acid values available in 1949 provides index values which are as close to the respective bio- logical values as those obtainable by Oser's Essential Amino Acid Index.
Mitchell, in describing Kuhnau's method in 1954, utilized values which were particularly high for lysine, isoleucine, and valine (42). Using this, in a sense, arbitrary standard the following index values are obtained:
lactalbumin 85, casein 83, fish muscle 75, soy flour 69, white flour 56, and gelatin 30, all of which are reasonably close to the experimentally ob- tained biological values.
Part of the reason for the accuracy of Kuhnau's method when the arbitrary standard is used stems from the fact that the essential amino acids account for about 60% of the total weight of the better proteins, but only about 40% of the poorer proteins (43). Thus an amino acid reference which is set arbitrarily high permits the comparison of proteins, if for no other reason, on the basis of their total essential amino acid content.
B. Osers Essential Amino Acid Index
Using a method incorporating the "egg ratio" concept of Mitchell and Block, but including all the essential amino acids, plus cystine,
tyrosine, histidine, and arginine, Oser, in 1951 (11), devised an inte
grated "Essential Amino Acid Index" which incorporated certain features of Kuhnau's index as well as the egg ratio concept of Mitchell and Block.
The novel feature of Oser's index was the use of the geometric mean of the egg ratios to estimate the nutritive value of a protein.
The probability of two or more events occurring simultaneously is a function of the probability of their individual occurrences. Thus, the probability that all the essential amino acids will be available at the site of protein synthesis within a tissue is a function of their product, not of their sum. Kuhnau's method (described above) utilizes the sum of the percentages of essential amino acids. However, a protein devoid of one essential amino acid, and therefore incapable of supporting growth, should theoretically have a nutritional value of zero. An index based on the product of these percentages, instead of their sum, would yield the theoretical value of zero in the case cited above.
Nevertheless, even proteins completely deficient in certain essential amino acids, e.g., gelatin or gluten, are found to have low, but not zero, biological values when tested in experimental animals. This is due primarily to the short test periods used, in which the products of tissue catabolism may be partially reused for the synthesis of new protein.
Consequently, Oser reasoned that, in order to correlate observed bio
logical values with an integrated essential amino acid index, it is necessary to assume the presence of a small amount of even the missing essential amino acids. Thus a more or less arbitrary assumption upon which this integrated essential amino acid is based is that the minimum ratio of essential amino acid content relative to that of the standard protein The standard protein chosen by Oser was whole egg protein, following the recommendation of Mitchell and Block. The adoption of an "ideal"
protein involved the further assumption that the percentage of an essen
tial amino acid in a protein in excess of its percentage in the standard can be ignored. Thus, the maximum ratio of essential amino acid content relative to that of the standard protein is 100%.
The essential amino acid index (EAA index) was defined as the geo
metric mean of the "egg ratios" (i.e., the ratio of the essential amino acids in a protein relative to their respective amounts in whole egg pro
tein), in which the subscript ρ refers to the food protein; s, the standard protein, whole egg; and n, the number of amino acids (counting pairs such as methionine and cystine as one) entering into the calculation.
i s l % .
The amino acid concentrations were standardized to a common nitrogen basis for the test and standard proteins, usually to 16 gm of nitrogen. The test protein:egg protein ratios were computed and ex- pressed as percentages; all percentages over 100 were then reduced to 100. A geometric mean was then taken of these ratios, equal to the antilogarithm of the mean logarithm of the ratios. Oser did not consider tyrosine in his calculations at first (11), but did include cystine and arginine. Subsequently, Oser (44) accepted Mitchell's suggestion to include tyrosine, but he would not accept the proposal to eliminate arginine from the calculation. In the example of this procedure presented in Table VI, Mitchell's proposal to add tyrosine and eliminate arginine has been followed. In addition, as suggested by Mitchell, although the semiessential amino acids tyrosine and cystine are included, they are counted only to the extent that they are contained in the standard protein.
1. Calculation of the Oser EAA Index as Modified by Mitchell (ME A A Index)
The procedure for calculating the EAA index as modified by Mitchell (42) is illustrated in Table VI using casein as an example.
T A B L E V I
COMPUTATION OF THE MODIFIED ESSENTIAL AMINO ACID INDEX
Whole egg
protein Casein Logs of
(gm/16 gm (gm/16 gm Egg Corrected corrected
Amino acids N) N) ratio ratios ratios
Histidine 2.6 3 . 2 123 100 2.0000
Lysine 7.8 8.1 104 100 2.0000
Methionine 3.2 3 . 0 94 — —
Cystine 2.1 0.3 14 — —
Methionine 5.3 3 . 3 62 62 1.7924
+ cystine
Phenylalanine 5.5 5.5 100
— —
Tyrosine 3 . 8 5.2 137 — —
Phenylalanine 9.3 10.7 115 100 2.0000
4- tyrosine
Leucine 8.8 9.8 111 100 2.0000
Isoleucine 5.9 5.8 98 98 1.9912
Valine 7.1 7.2 101 100 2.0000
Threonine 4.9 4.1 84 84 1.9243
Tryptophan 1.4 1.2 86 86 1.9345
Average logarithm = 1.9603 Modified EAA index = 9 1
Egg ratios are calculated as described for the chemical score of Mitchell and Block (Section II, A), except that the semiessential amino acids are not used in amounts above that found in the standard protein, even when the total of the essential amino acid plus its metabolic pre- cursor, e.g., tyrosine plus phenylalanine, is present in smaller quantity than in the standard. For phenylalanine a value of 5.5 is used; for tyrosine 3.8 is used (the value in egg), not 5.2. If the concentration of phenyl- alanine in casein had been less than 5.5, the value for tyrosine used would still have been 3.8, i.e., not greater than the quantity in the standard. The values used are then added (5.5 + 3.8 = 9.3) and di- vided by the sum of these amino acids in whole egg protein, 9.3. The egg ratio is thus 100, rather than 115.
The geometric mean of the corrected egg ratios is then computed by taking the logarithm of each egg ratio, averaging these logarithms, and then obtaining the antilogarithm of this average value. The average logarithm obtained was 1.9603; and its antilogarithm, 91, is the modified EAA index value for casein.
C. Discussion of Integrated Essential Amino Acid Indices
The validity of the modified essential amino acid indices and the chemical scores of proteins (or mixtures of foods) are best assessed by correlating them with the corresponding biological values determined by the nitrogen balance method. This is so because the biological value of proteins is expressed as a percentage, thus facilitating mathematical correlations between this method and the methods of chemical scoring.
Mitchell (42) selected 48 food proteins for which apparently satis- factory analyses of the essential amino acids (plus cystine and tyrosine) and for which seemingly satisfactory biological values are available.
Most of the biological values were obtained with growing rats, but also included are 7 values secured with growing pigs and 8 values for growing dogs.
The correlation between Mitchell's modified essential amino acid index and the biological values for the growing rat, pig, and dog was quite good, the coefficient, r, being 0.948. A similar comparison for Mitchell and Block's chemical score yields a correlation coefficient of 0.833. The difference between these coefficients is highly significant.
This supports Oser's contention that the use of the integrated index, utilizing all the essential amino acids, takes into account the require- ments for maintenance as well as growth, and is therefore a better method for estimating the biological value of proteins even for growing animals.
Nevertheless, factors which affect the degree or rate of release of
amino acids during gastrointestinal digestion of a protein will influence its nutritive value, especially its biological value as measured by nitrogen balance. Consequently, integrated amino acid indices based on the total essential amino acids in a protein tend to overestimate the experimental value. A comparison of the biological values of certain food proteins and their modified essential amino acid indices is shown in Table XII.
I t is obvious that for some proteins, especially casein, the index values are relatively high. Furthermore, the index does not take into consideration the effects of heat processing on the subsequent liberation of amino acids during digestion. However, the MEAA index is a useful method for (a) predicting the maximum potential biological value of a protein, (b) estimating the limiting essential amino acids of protein foods, and (c) providing a logical basis for the mutual supplementation of proteins for the improvement of diets.
I V . CHEMICAL METHODS OF EVALUATING PROTEIN QUALITY
In preparing foodstuffs, particularly for animal feeds, decisions are needed quickly: rapid evaluation is usually needed when processing machinery is being adjusted and also when consignments after arrival at port have to be purchased or rejected by buyers.
Thus, a variety of procedures have been developed which can be performed quickly on a routine basis in a chemical laboratory. In general, these procedures have been assessed by comparison with two standard biological methods: (a) the gross protein value (GPV) procedure for chicks, in which the protein source to be tested is fed as a supplement to cereal protein; and (b) by the net protein utilization (NPU) procedure with rats, in which the test material is the sole source of protein in the diet.
Neither the GPV nor the NPU test measures the amount of a single amino acid. In the GPV assay a low level of test protein is fed as a supple- ment to a higher level of cereal protein. Since lysine is the limiting amino acid in cereal proteins, the value obtained is usually a measure of the lysine contribution made by the protein supplement. However, with the NPU assay, the entire complement of essential amino acids is con- sidered, although generally methionine (plus cystine) and/or tryptophan, as well as lysine, are the limiting amino acids, and these receive greater emphasis.
A. Simple Nitrogen Analysis
Cereals vary little in protein quality, with the exception of maize (45). In maize bred to contain a high level of protein, quality is reduced because the extra protein is mostly zein, which, of course, is of low quality.
With the common varieties of maize a simple nitrogen analysis will give an indication of quality as well as the quantity of protein present (46).
With other protein sources, e.g., fish meal, meat meal, and whole meat meal, no correlation was found between protein concentration and GPV or NPU (47).
Corrections for "Useless" Nitrogen
Certain tests are available for deducting values for obviously useless nitrogenous components from crude protein figures. For example, the insoluble residue from the peptic digestion of meat meals is of little nutritional value; it comes from contamination with horn, hoof, and wool (48). Urea nitrogen can also be estimated and deducted from the total nitrogen in meals made from dogfish sharks (49).
B. Urease Inactivation
Soybean proteins exhibit marked differences in biological value after various types of processing without change in amino acid composi- tion or, in many cases, in digestibility measured in animal tests. The improvement in biological value with moderate heating is due to several factors, including destruction of a trypsin inhibitor and of a toxin (50), which apparently acts independently of the inhibitor.
The heat treatment required for optimal nutritional value also inactivates most of the enzyme urease that occurs in raw soybeans (51).
This inactivation has been widely used as a test for inadequate heating;
the test material has only to be digested in the presence of urea, which will be hydrolyzed to ammonia and CO2 at a rate proportional to the quantity of urease remaining in the preparation. The production of ammonia is easily measured; a titrimetric procedure is described by Croston et al. (52).
Boyne et al. (47) reported urease determinations conducted on 11 soybean samples and found no evidence of a simple relationship between urease values and the results of the GPV tests.
The GPV test indicates the value of a protein as a lysine source;
thus moderate heating of the soybean—which inactivates the trypsin inhibitor—should increase the GPV value. Sheffner et al. (20) have shown that there is a marked increase in the release of lysine during tryptic digestion of properly heated soybean meals relative to that which occurs with the raw preparations. The measurement of trypsin inhibitor activity per se is rather simple and would appear to provide a more accurate measure of lysine availability (and GPV value) than the urease procedure and to be more useful as a test for adequate heating of soybean meals.
C. Protein Solubility Tests
An obvious change in the physical properties of heated proteins is their reduced solubility in water. Differences between optimally heated and overheated soybean meals are shown if the test material is shaken successively with water, 5 % KC1, 70% ethanol, and 0.2% KOH. By this procedure, the range of values for the original nitrogen remaining undissolved was 30 to 60% for a series of commercial soybean meals (53).
The results suggest that this procedure can give an indication of the nutritive value of a meal. The same series of meals was also tested for their solubility after digestion with pepsin and dilute acid; but this treatment dissolved 93 to 95 % of all meals, so that the values could not be used to discriminate between them.
Solubility of soybean proteins in water, mild acid, or alkali has not been found useful for differentiating the effect of heat processing, for even with optimal heating little soybean protein remains soluble in these solutions (54).
1. Chemical Quality Index
The problem of evaluating the nutritional quality of processed cotton
seed is complicated by both protein damage and the presence of gossypol in a toxic form and by the apparent interaction of gossypol with protein during processing. Cottonseed proteins are variably soluble in 0.02 Ν NaOH depending upon treatment. Consequently, Lyman et al. (55) proposed a "chemical quality index" defined as the percentage of nitrogen soluble in 0.02 Ν NaOH divided by either the percentage of gossypol in the meal or 0.85, whichever is less. The index for a series of 22 samples was closely correlated with values obtained by chick-growth tests.
Other investigators have not found that the chemical quality index properly grades meals prepared by a wider range of procedures (56, 57).
Boyne et al. reported (47) that the chemical index values correlated closely with the GPV, but the relation was no closer than that found pre
viously between the simple solubility in alkali and the GPV of the sample.
2. Protein Quality Index
Almquist et al. (58) studied various criteria of quality that would apply in a general way to all meat industry by-products. A scheme of chemical analysis was proposed that include the following: (A) the percentage of total nitrogen precipitated by copper (inclusive of Β and C); (B) the percentage of total nitrogen not digestible with pepsin;
(C) the percentage of total protein nitrogen soluble in hot water; and
(D) the percentage of total nitrogen precipitated by phosphotungstic acid.
By comparison with chick growth data and a process of trial, an expression—the protein quality index—was calculated equal to
A — (B + 0.6 Ο + 0.4 D
The indices for various fish and meat meals varied from 40.0 to 88.5, a perfect animal protein having an arbitrary value of 100.
Independent studies by March et al. (59) have shown positive cor
relations between the index and feeding results with chicks for both fish and meat meals. Other investigators have also reported (47) that the PQI for whale meals were well correlated with the results of GPV feeding tests; the correlation was lower with fish meals. With meat, cottonseed, and soybean meals, the PQI values did not show a significant correlation with the results of either the GPV or NPU tests.
D. Tests for Specifically Reacting Amino Groups
A variety of tests to detect processing damage in soybean meals have been based on changes in the general reactivity of the protein molecules.
1. Reactivity to Dyes
Frolich (60) obtained results suggesting that heat processing increased the absorptive property of meals for dyes containing a phthalein group.
Phenolphthalein was most useful in distinguishing between underheated, properly heated, and overheated meals. Cresol red could also be used and was more stable under the alkaline conditions used in the test. With cresol red, absorption of the dye reflected heat treatments in underheated to properly heated meals; however, overtreatment could not be measured.
The orange G test is designed to give an indirect measure of reactive amino groups (61). The test protein is shaken with an aqueous orange G solution of known strength, and the unbound dyestuff measured colori- metrically. Boyne et al. (47) compared dye binding of orange G with GPV values for meals prepared from whale meat, fish, meat, and groundnut.
An indication of a correlation between GPV and dye binding was ob
tained with all the meals except groundnut.
2. Reactivity with Formaldehyde
Almquist and Maurer (62) found that overheating of soybean meals decreased their reactivity with formaldehyde. A preliminary comparison of rat-growth results with values from simple formol-titration procedure indicated a promising correlation.
3. Available Lysine Value (Carpenter)
Animal proteins contain relatively high concentrations of lysine and, when added to cereal diets, markedly improve the biological value of the supplemented diets. The most severe effect of processing on animal proteins appears to be a decrease in the nutritional availability of lysine that reduces their value as protein supplements. A chemical procedure that could show that a particular product contains much available lysine would provide a measure of the nutritional value of the raw material and in addition indicate the degree of processing to which it had been subjected.
The reduced availability of lysine is due largely to the reaction of its €-amino group with other active groups under conditions of moist heat to form a linkage that resists hydrolysis with enzymes (63). Car- penter and his associates proposed that only lysine molecules with reac- tive eamino groups are nutritionally available. This hypothesis was used as the basis for a procedure to measure "available" lysine by reac- tion of fluoro-2,4-dinitrobenzene (FDNB) with the free amino groups in intact protein; the dinitrophenyllysine released after subsequent acid hydrolysis was measured colorimetrically (64, 65).
Results obtained with Carpenter's procedure for a series of fish, whale, and meat products indicated a close correlation with corresponding results of chick feeding tests, under conditions in which the lysine con- tribution of the test materials was the most important nutritional consideration (66).
Additional studies with the "available lysine" procedure showed that the values obtained correlated well with the GPV of a variety of animal proteins. They showed no correlation with the NPU results for meat meals (47).
Determinations of "available lysine" with FDNB were also made on groundnut, cottonseed, and soybean meals; however, the range of values obtained was quite narrow; and the results with corresponding samples showed no correlation with tests on chickens.
Carpenter, in a later paper (67), suggested that for animal protein materials there was nearly the same degree of correlation of FDNB- available lysine values with the NPU test (which measures the amino acid "balance" of a protein) as there was with the "supplementary pro- tein" chick test (which essentially measures the value of a material as a lysine source). This statement does not appear to be supported by the work of Boyne et al. (47).
A modification of the original FDNB procedure, now recommended by Carpenter (68), apparently overcomes the interference by free arginine
to which the original method was subject. Free lysine is not measured, so that lysine supplemented foods cannot be evaluated. Hydroxyproline in proteins is measured although it is of no nutritive value. It is claimed that the procedure can distinguish samples differing by 5 % in their available lysine value, if they are assayed at the same time, or by 8% if at different times (68). Careful control of hydrolysis conditions is necessary, and peroxide-free diethyl ether must be used for extraction of surplus reagent and unwanted complexes formed with amino acids other than lysine.
The FDNB procedure has been adopted widely for the quality control of fish and meat meals used in animal feeding and also as one of the routine tests for material such as fish flour being developed under United Nations auspices for the feeding of children in protein-deficient areas of the world (67).
The latest procedure utilized by Carpenter (68) is as follows.
a. Stage 1. At least 50 gm of the material to be analyzed is ground so that it passes a y^Q-irwYi sieve. Samples are taken for the determina
tion of nitrogen in duplicate. Two portions, each containing an estimated 30-50 mg of nitrogen are then taken into round-bottomed flasks and to each is added 8 ml of 8% (w/v) N a H C 03. They are shaken gently to disperse the material and then left for 10 minutes. FDNB (0.3 ml), previously dissolved in 12 ml of ethanol, is added to each flask, which is then stoppered and shaken gently on a mechanical shaker for 2 hours.
The stoppers are removed and the flasks are allowed to stand in boiling water until their effervescence ceases, even on shaking. It may be checked that this point corresponds to a loss of weight of 10 gm, i.e., the weight of ethanol added. Immediately 24 ml of 8.1 Ν HC1 is added:
the flasks are then refluxed gently for 16 hours with condensers adequate to prevent loss of HC1. The flasks are disconnected after the condensers have been washed with water. (The condensers may still give a yellow color on being placed in alkaline washing water owing to the presence of dinitrophenol, a decomposition product of FDNB which is colorless in acid solution.) After the flasks have remained in ice water for 1 to 2 hours the contents are filtered through a paper, such as Whatman No. 541, with water washings and the filtrates are made up to 200 ml. A portion of each filtrate is diluted again if necessary so that 2 ml contains an estimated equivalent of 35-55 μg of "available lysine" from the original sample. (This usually involves a twofold to fivefold dilution.)
b. Stage 2. Portions (2 ml) from each diluted filtrate are pipetted into each of two glass-stoppered tubes A and B, graduated at 10 ml, and a small conical flask C. The contents of the tubes are extracted twice with 5-ml (approximately) portions of ether; the ether layers are
discarded; and the tubes are held in boiling water until effervescence from the residual ether ceases, and then they are cooled. Tube A is made up to 10 ml with Ν HC1 and kept for the final readings.
c. Stage 3. The contents of flask C are titrated with 10% (w/v) NaOH, with phenolphthalein as indicator, and then discarded. The same volume of NaOH is then added to tube B, followed by 2 ml of buffer solution, pH 8.5. Methoxycarbonyl chloride (0.045-0.055 ml) is then added, and the tube is shaken vigorously to disperse and dissolve the compound. After 5 to 10 minutes 0.75 ml of concentrated HC1 is added, cautiously at first and with agitation to prevent the contents from frothing over. The contents are again extracted twice with 5 ml of ether. The ether washings are discarded. The residual ether in the aqueous layer is evaporated by standing the tube in boiling water, and the volume is made to 10 ml with water.
d. Stage 4- The extinction coefficients of the contents of tubes A and Β are measured in 1-cm cells at 435 πΐμ (or with a filter having maximum transmission between 420 and 450 ιημ if necessary). "Reading A — reading B " was taken as the extinction due to eDNP-lysine, and is compared with the corresponding values obtained with 2 ml of standard DNP-lysine solution treated according to the described procedure from stage 2 onward, with omission only of the ether-washing in stage 2.
The equivalent amount of lysine from the test food that has reacted with FDNB is calculated with a suitable correction for losses due to hydrolysis where necessary (this appears to be multiplication by a factor of 1.09).
V . ENZYMATIC AND MICROBIOLOGICAL METHODS FOR MEASURING PROTEIN QUALITY
Mitchell (69), while reviewing in 1952 a half century of progress in nutritional evaluation of proteins, questioned whether a method which depended in its entirety upon the total amino acid composition could predict precisely the biological value of proteins, since many other factors affect the utilization of dietary protein. One of these factors is conceivably related to the observation that delayed supplementation of a deficient protein with the lacking amino acids is ineffective in correcting the deficiency.
Based upon this fact and subsequent work of their own, Melnick, Oser, and Weiss (70), and Riesen et al. (71) proposed that, in addition to the total amino acid composition, the rate of release of amino acids from protein by pancreatic digestion was also an important factor in the nutri
tional quality of a protein.
A. Enzymatic Methods for Measuring Amino Acid Availability
Melnick, Oser, and Weiss (70) allowed food proteins to be digested with U.S.P. pancreatin at pH 8.3 for 1 to 5 days at 37°C; at intervals aliquots of the incubation mixture were withdrawn and the degree of hy- drolysis was measured by formol titration. Enzymes naturally present were inactivated, and bacterial action was prevented; amide nitrogen and fat were not interfering factors under the conditions employed.
By means of this procedure, it was determined that those factors known to increase the nutritive value of soy protein also increased the susceptibility of the protein to enzymatic digestion. Improvement in biological value which occurred in the manufacture of soy grits was evidenced by the greater degree and rate of digestibility.
In addition to the measuring of protein hydrolysis by means of the formol titration procedure, several amino acids were measured individu- ally. It was found that methionine is released earlier from heat-processed soy meal than from raw soy meal. Since animal experiments indicated that the total fecal excretion of methionine was the same for both prod- ucts, it was concluded that absorption of methionine was the same for both products and that, in the case of the raw meal, absorption occurred too late in the intestinal transit. Thus, the remaining amino acids of the protein, which were absorbed relatively early, were apparently inef- ficiently utilized for the synthesis of body protein.
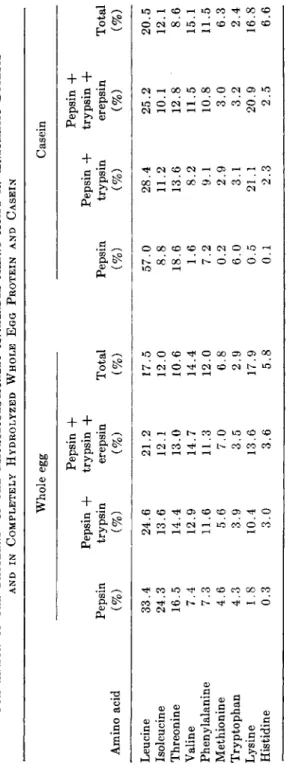
The concept developed may be correct and certainly has been useful in stimulating thought concerning the importance of amino acid avail- ability. However, two facts utilized in development of this hypothesis require comment: (a) The excretion of amino acids in the feces is rather constant although protein intake may be varied greatly, and apparently does not represent unabsorbed amino acids; more likely fecal amino acids are synthesized by intestinal bacteria or are derived from intestinal secretions and incorporated into bacterial proteins (72). (b) Although heating of soy meals markedly improves the rate at which methionine is released by pancreatin digestion, studies by Riesen et al. (71), also utilizing pancreatin, and by Sheffner et al. (20), who used pepsin plus pancreatin digestion, indicate that the liberation of other amino acids is improved as much. One reason for the discrepancy is that both of the latter groups measured methionine by microbiological methods, whereas Melnick et al. used a chemical procedure. Nevertheless, the improvement in biological value of properly heated soy meals is likely due to inactiva- tion of the "toxic" factor, as well as the greater availability of several essential amino acids resulting from destruction of the trypsin inhibitor.
Riesen et al. (71) treated soybeanjneals with pancreatin and ;mea-