CHAPTER 10
An Integrated Essential Amino Acid Index for Predicting the Biological Value of Proteins
BERNARD L. OSER
Food and Drug Research Laboratories, Inc., Maspeth, New York
Page
I. Introduction 281 II. Empirical Ratings of Proteins Based on Essential Amino Acid Content 282
III. The Standard of Reference 283 IV. Derivation of an Integrated Essential Amino Acid Index 284
V. Limitations of the Essential Amino Acid Index 289 VI. Special Applications of the Essential Amino Acid Index 290
VII. Summary 291 References 291
I. INTRODUCTION
The utilization of dietary proteins for growth and maintenance is dependent on the presence and relative amounts of the essential amino acids and on the degree and rate of digestion. The solubility and sus- ceptibility to enzymatic attack of proteins are determined by their struc- tural organization as well as by the presence of protective cellular tissue, especially in foods of plant origin. The coefficient of digestibility of protein in foods is, in general, uniformly high. However the biological value of a protein, or proportion of absorbed nitrogen retained for utilization by the animal organism, varies to a considerably greater degree. The biological value might, by analogy, be called the coefficient of utilization. It is a function of the available (i.e. absorbed) content of essential amino acids, the amino acids which the animal cannot syn- thesize at a rate commensurate with the demands for normal growth
(Rose, 1938). In the complete absence of any of the amino acids indis- pensable for an animal species, normal maintenance, growth, and sur- vival are not possible. The over-all adequacy of a diet with respect to protein depends upon the extent to which the component proteins com- plement each other in filling the essential amino acid needs of the indi- vidual, and collectively furnish enough of the amino acids, nonessential as well as essential, to replace catabolic losses and to satisfy anabolic requirements.
Since the advent of modern microbiological and Chromatographie methods for the assay of amino acids, it has become relatively simple to determine all of the essential amino acids. Instead of focusing atten-
281
tion on the one or two limiting acids in proteins as a basis for their nutri- tional assessment, it has become possible to consider the content of all of the essential amino acids as an integrated whole.
II. EMPIRICAL RATINGS OF PROTEINS BASED ON ESSENTIAL AMINO ACID CONTENT
Mitchell and Block (1946) devised a system of "chemical scores"
based on the amount of the essential amino acid in greatest deficit in a protein compared to the level present in a reference protein selected for its nutritional excellence. Despite the empirical nature of this system, the chemical scores were shown (Mitchell, 1954a) to have a high degree of correlation (r = + 0-95) with published biological values for a series of proteins. However, as Mitchell has pointed out in his excellent reviews
(Mitchell, 1954a, b) on the dependence of biological values of food proteins on their content of essential amino acids, the chemical score is an index of the value of protein for growth only, since it assumes that the absence of an essential amino acid renders the protein completely unavailable even for tissue maintenance, an assumption not consistent with reported observations (McCallum, 1911; Mason and Palmer, 1935).
Each essential amino acid may be considered as the keystone in an arch, without which a stable protein structure cannot be built. It would seem more reasonable that the rating of a protein for nutritional quality should take into account its entire contribution of essential amino acids, not merely the one in greatest deficit with respect to a nutritional stand- ard. Hence the writer was intrigued with the possibility of devising a means of representing the entire essential amino acid spectrum of a protein by an integer which might be correlated with experimentally determined coefficients of utilization, such as the biological value of Mitchell or the nitrogen balance index of Allison (Allison and Anderson, 1945).
Studies in protein utilization have directed attention to the importance of the time factor in absorption. For example it was shown that too long delay in supplementation of an incomplete amino acid mixture with the missing factor, failed to improve retention (Berg and Rose, 1929; Elman, 1939; Henry and Kon, 1946; Geiger, 1947). This led to the working hypothesis that "for optimum utilization of food proteins all essential amino acids must not only be available for absorption but must also be liberated during digestion in vivo at rates permitting mutual supple- mentation" (Melnick et al, 1946). In other words, for most efficient con- struction of the protein arch, every essential building block must be available at the site and at the time of synthesis.
The probability of two or more events occurring simultaneously is a
ESSENTIAL AMINO ACID INDEX 283 function of the product of the probability of their individual occurrences.
It follows therefore that the probability that all of the amino acid build- ing blocks will be available at the site of synthesis (that is to say for biological utilization) is a function of their product and not their sum.
Kuhnau (1949) proposed a method of rating proteins according to the sum of the percentages of essential amino acids. A protein completely lacking one of the essential amino acids and hence incapable of sup- porting growth should theoretically, at least, be assigned a rating of zero. An index based on the product of these percentages, instead of their sum, would yield the theoretical value of zero in the case cited.
However even the most deficient proteins, like gelatin or gluten, yield low but not zero biological values under experimental conditions. This probably arises from the fact that the nitrogen balance procedure in- volves the use of short test periods, during which amino acids lacking in the test proteins may be picked up from intestinal debris or from the products of tissue catabolism, albeit in trace amounts but sufficient to permit some utilization of incomplete dietary proteins. Hence in order to correlate observed biological values with an integrated essential amino acid index, it is necessary to assume the presence of a small con- tent of even the missing essential amino acids.
III. THE STANDARD OF REFERENCE
The nutritional value of any protein or mixture of essential amino acids for an animal must be related to its individual needs for growth and maintenance. The age, sex, and status of an animal with respect to pregnancy, lactation, disease, convalescence, nutritional his- tory, and so on, are significant factors in the determination of individual requirements. In view of the many variables it is obviously invalid to make the general assumption that the amino acid requirement of a specific segment of the population can serve as a universal yardstick for the evaluation of dietary proteins. For this reason it seemed preferable to adopt as the standard, a food protein of optimal nutritional value according to biological criteria. In the entire gamut of foods, the only one specifically designed (one might say divined) as food for man, namely human milk, would appear to be a logical choice. This has indeed been recommended as the standard by Kuhnau (1949), Nehring and Schwerdtfeger (1951), and others. However the author has preferred to follow the example of Mitchell and Block (1946) and adopt whole egg protein as the reference standard. It is as nearly completely utilized by the rat, the dog, and man as any food protein and is not significantly enhanced in biological value by supplementation with any of the amino acids. The adoption of an "ideal" protein as a standard involves the
corollary assumption that the percentage of an essential amino acid in a protein in excess of its percentage in the standard, can be ignored. In other words the value of the food protein in this respect is regarded as equal to, but not greater than, the standard.
IV. DERIVATION OF AN INTEGRATED ESSENTIAL AMINO ACID INDEX
Thus the two more or less arbitrary assumptions upon which the calculation of an integrated essential amino acid index is based are that the minimum ratio of essential amino acid content relative to that of standard protein is 1%, and the maximum 100%.
The Essential Amino Acid Index (EAA index) may be defined as the geometric mean of "the egg ratios," i.e. the ratios of the essential amino acids in a protein relative to their respective amounts in whole egg protein.
Τ Γ Λ Λ Τ Λ nlLYsp y TrYp Z UisP
EAA Index = <d- X — X · · · —^-—
1 Lyss Trys Hiss
in which the subscript p refers to the food protein; s, the standard pro- tein (whole egg); and n, the number of amino acids (counting pairs such as methionine and cystine as one) entering into the calculation. It is generally of interest to inspect the individual egg ratios and hence these are recorded in the computation of EAA indexes.
Amino acid contents are usually expressed on a nitrogen = 16 basis.
However EAA indexes may be computed from the amino acid content relative to the total nitrogen in both the food protein and the standard.
This avoids the necessity of applying the conventional factors 6.25, 6.38, or 5.7 for converting nitrogen to protein. The simplicity of the computa- tion as conducted logarithmically is illustrated by the model table used in the author's laboratory, shown in Table I. The figures entered in roman type are printed on the form whereas those shown in italics are entered by hand. Occasionally certain amino acid values are not available but reasonably close approximations to the EAA indexes may be ob- tained even omitting these values provided, of course, that the appro- priate value for n is used. When data for cystine and tyrosine are lacking, as is not infrequently the case, methionine and phenylalanine, respec- tively, may be considered individually.
In the original paper on the EAA index (Oser, 1951) the author used the analytical values reported by Block and Boiling (1951) for the essen- tial amino acid content of whole egg protein. This practice was subse- quently followed by Mitchell (1954a). However the values summarized recently by Orr and Watt (1957), which were derived from improved
ESSENTIAL AMINO ACID INDEX 285
I
fe
O
•2? cd ü
w S
'-a <!
bC bJD CP O
2 «
^
3
O 1 C N Öl N
8
Ή "H * 0 *C^ 0 5 b - l O O 05 OJ OS N
<N M M M M
O ^ ^ ί θ 0 5 ΜΪ tsl 0 0 M< CO CSJ 0 0 0 5 0 5 lO
CO © b » 0 0 CO CO b - 0 5 0 5 O CO CO l O *C
^ O ^ ^ cq ^ o
d d d d d d d
O H H O ^ IC !>■ T}J >-j rtj
c4 oi d ci c4
o coio t
O O H C 0
""Φ »—I ^ ""Φ Tt1 i—i
ό ό ό ό ό ö &
CO
ο ιο ο CM co τ« rt<
rjn CD CD τ}Η I C ^J CO CD H CO N CD CO (N
CN N 0 5
oq ^ co
C O C 5 - N
CO ^ CO 0 5 1C M 0 5 <N| O <N CSj <M CO CO CO
d d d d d
0 0 i*H
823
^ι 00 co co CO *H
d d
cq cq oq σ> oq oo cq co ι-ί
(SI H O H OS O O Tt< H I ß CO Φ CO 1C C0# CO I C CO C<j CO r-i
ό ö ö ö ό d o
00 00 O 00 O
^ Φ oo t> co
IC Tj" 0 0 IC ^ 00 O O Th Ö CM*
cp p
.9 a, 3 S -S 3
^ ? - o ^ EPS o a
I—I i >
'S O G
b 0
«I
5« O•a β
+
s °*
O l-l
H CM H i
and more numerous microbiological assays, have been used as the basis for computing the indexes tabulated in the Appendix to this presenta- tion. In Table II are shown the assumed values for the essential amino acid content of whole egg protein according to both sets of published data. It is of incidental interest to note that the Orr and Watt data for whole egg are in closer agreement than Block and Boiling's with the
TABLE II
ESSENTIAL AMINO ACID CONTENT OF WHOLE EGG PROTEIN
Amino acid Lysine Tryptophan Isoleucine Valine Arginine Methionine Cystine Methionine +
Cystine Threonine Leucine Phenylalanine Tyrosine
Phenylalanine + Tyrosine Histidine
Data of Block and Boiling (1951)
Per cent (N = 16)
7.0 1.5 7.7 7.2 6.6 4.0 2.4 6.4 4.3 9.2 6.3
2.4
Data of Orr and Watt (1957) Number of
samples assayed
26 27 16 16 21 34 24
27 16 26 18
26
gm./gm. N 0.400 0.103 0.415 0.464 0.410 0.196 0.146 0.342 0.311 0.550 0.361 0.269 0.630 0.150
Per cent (N = 16)
6.40 1.65 6.60 7.42 6.56 3.14 2.34 5.48 4.98 8.80 5.78 4.30 10.08 2.40
"best average values" selected in the Rutgers report (Allison et ah, 1950).
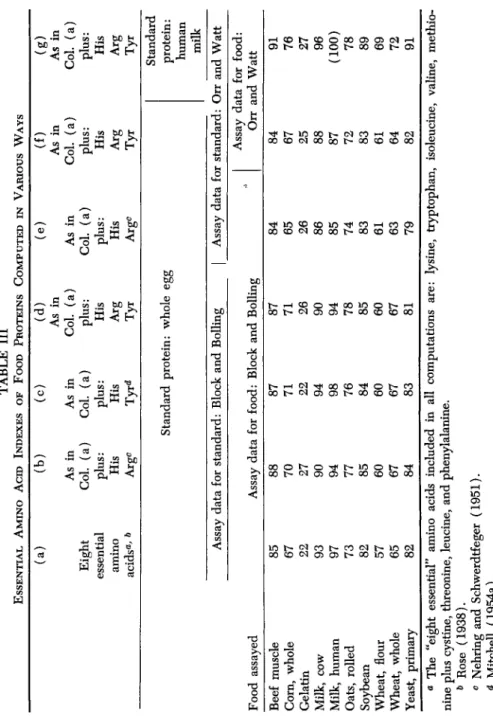
The differences, in any case, are small and fall well within the reported range of variation for the amino acid content of whole egg. Table III is intended to demonstrate the small magnitude of the differences in EAA index as affected by the selection of amino acids regarded as essential, or by the source of assay data for the amino acid content of either the standard or the food proteins. It is evident from this table that either Block and Boiling's or Orr and Watt's data for the reference protein may be used in computing EAA indexes. For all practical purposes no dif- ferences were found in this series of typical food proteins [cf. columns
(d) and ( e ) ] .
It is suggested that pending possible future agreement on standard values by the Food and Agriculture Organization of the United Nations or a similar official agency, the data summarized by Orr and Watt
TABLE III ESSENTIAL AMINO ACID INDEXES OF FOOD PROTEINS COMPUTED IN VARIOUS WAYS Food assayed Beef muscle Corn, whole Gelatin Milk, cow Milk, human Oats, rolled Soybean Wheat, flour Wheat, whole Yeast, primary
(a) Eight essential amino acidsa ' b Assay
85 67 22 93 97 73 82 57 65 82
(b) As in Col. (a) plus: His Argc
(c) As in Col. (a) plus: His Tyr<*
(d) As in Col. (a) plus: His Arg Tyr Standard protein: whole egg data for standard: Block and Boiling Assay data for food: Block and Boiling
88 70 27 90 94 77 85 60 67 84 87 71 22 94 98 76 84 60 67 83 87 71 26 90 94 78 85 60 67 81
(e) As in Col. (a) plus: His Arg°
(f) As in Col. (a) plus: His Arg Tyr
(g) As in Col. (a) plus: His Arg Tyr Standard protein: human milk Assay data for standard: Orr and Watt 1 Assay data for food:
84 65 26 86 85 74 83 61 63 79
Orr and Watt
84 67 25 88 87 72 83 61 64 82 91 76 27 96
(100)
78 89 69 72 91
W 3 H
1 s
o >§
2 Ös
a The "eight essential" amino acids included in all computations are: lysine, tryptophan, isoleucine, valine, methio- nine plus cystine, threonine, leucine, and phenylalanine. » Rose (1938). 0 Nehring and Schwerdtfeger (1951). * Mitchell (1954a).(Table II) be used since these are derived from the most up-to-date and extensive series of assays.
Mitchell has modified (1954a) the author's original proposal for cal- culating EAA indexes (Oser, 1951) by disregarding arginine, as being nonessential, and including tyrosine together with phenylalanine (in analogy with the pairing of cystine with methionine) because of its par- tial replacement value. The negligible over-all effect of these modifica- tions may be seen by comparing columns (b) and (c) in Table III. Even restricting the "essential" amino acids to the eight shown by Rose et al.
(1954) to be required for nitrogen balance in young adult males (but including cystine with methionine) has little influence on the indexes
[column ( a ) ] .
The author is inclined now to accept Mitchell's recommendation to include tyrosine with phenylalanine but not to consider arginine as dis- pensable until further data on human beings in various physiological states indicates this to be justified [cf. columns (d) and (f)]. In any event the differences in indexes are not greatly influenced by whether or not arginine is included.
It is of interest to compare the values for EAA indexes calculated with reference to egg protein, to those based on human milk protein as the standard. This comparison is shown in columns (f) and (g) of Table III. It will be noted that somewhat higher indexes are consistently ob- tained in relation to human milk protein, the increases in the foods listed ranging from 8 to 15%.
A high degree of correlation between EAA indexes and reported biological values are obtained regardless of whether human milk or egg protein is used as the standard. Mitchell has reported the following re- gression equation based on 48 such comparisons, with a correlation coefficient (r) of + 0.948.
Biological value = 1.0747 (EAA index) — 13.74 (1) The author's smaller series (Oser, 1951) comprised 29 comparisons and
yielded the following equation:
Biological value = 1.1403(EAA) — 8.415 (2) On the basis of the foregoing discussion, indicating that the methods of
computation employed in both of these series of data yield essentially the same results, the following equation, weighting the two series of 77 comparisons, is derived:
Biological value = 1.09(EAA) — 11.73 (3) As Mitchell has pointed out, the correlation between the EAA index
ESSENTIAL AMINO ACID INDEX 289 and the biological value is so consistently high that estimates of the latter may be made from essential amino acid assay with a degree of reliability greater, in the long run, than is obtainable in the usual biological assay employing 10 rats per group. However it is necessary to recall that this method of estimation is predicated upon the availability to the animal organism of the microbiological or chromatographically determined amino acids. Factors such as insolubility or heat treatment, which impair the degree or rate of digestibility and absorption of protein, militate against the use of this procedure in all cases. Proteins like hemoglobin and keratin are poorly utilized and the utilization of certain food pro- teins, like soybean or casein, are affected by processing conditions. It is not valid to assume that the entire amino acid content of these proteins, as estimated by nonbiological methods, is physiologically available.
The table shown in the Appendix is based on the analytical data of Orr and Watt and the application of Eq. (3) above, the resultant values being rounded off to the nearest whole numbers. Whereas biological values for many of these food proteins are to be found scattered in the literature, those cited in the last column were taken from Mitchell's paper (1954a) merely to illustrate the general agreement between calculated and observed estimates even though the samples upon which these esti- mates are based differed.
V. LIMITATIONS OF THE ESSENTIAL AMINO ACID INDEX As has been previously pointed out, factors which affect the degree or rate of digestibility of proteins influence not only their over-all nu- tritive value but specifically their biological value, in the Mitchell sense.
Hence any index of utilization based on the total content of essential amino acids in a protein may tend to overestimate the true value.
Sheffner and associates (1956) have attempted to overcome this dif- ficulty by basing the computation of the index on the pattern of essential amino acids in enzymatic digests of proteins rather than on the total essential amino content in complete hydrolyzates. For this purpose they used peptic, followed by tryptic and ereptic digestion for periods of 24, 24, and 72 hours, respectively. The essential amino acid content of these digests is computed according to the author's method as modified by Mitchell [cf. column (b), Table III] and the result is expressed as a PDR index (Protein Digestion Residue index). The data for eight series of comparisons show that the PDR index, corrected for digestibility, cor- relates quite closely with the biological value. However it is questionable whether the improvement in this relationship over that of the EAA index itself justifies the considerably greater volume of work involved. Only in those cases where there would appear to be reason for believing that
digestibility or utilization were significantly impaired would this tech- nique be warranted. In only two instances (Labco casein and white flour) cited by these authors did this appear to be the case. (Compare also the values for casein shown in the Appendix.)
It is of interest to point out that Kuiken and Lyman (1948) observed in metabolic studies that all of the essential amino acids were completely available in roast beef, wheat and peanut flour, whereas the amino acids in cottonseed flour were less available, values ranging from 64% in the case of lysine to 94% in the case of arginine. If the entire essential amino acid content of cottonseed flour were available the EAA index would be approximately 71 whereas that of the available fraction only is 58.
VI. SPECIAL APPLICATIONS OF THE ESSENTIAL AMINO ACID INDEX A useful property of the EAA index as a tool for predicting biological values is that it permits estimates to be made for combinations of proteins or for proteins supplemented with individual amino acids or combina- tions thereof. For instance, it has been computed that the addition of 0.55% lysine to white flour would affect an increase in the index from 60 to 69, corresponding to an increase in the expected biological value from 54 to 64, or approximately the value for whole wheat. In making such calculations it is of course necessary to express the essential amino acid content of the final mix or supplemented proteins on an isonitro- genous basis.
Another example of the use of this procedure is the estimation of the EAA index for mixtures of proteinaceous foods such as that employed by Scrimshaw for the prevention of protein malnutrition in Guatemala
(Behar et al., 1957). This consists of corn, sesame meal, cottonseed pressed cake, and torula yeast mixed in the proportions of 50:35:9:3. The EAA index of these components are 72, 75, 72, and 80, respectively, whereas that of the mixture is 79.
The EAA index for corn flakes, according to recent analyses, is 60 (predicted B.V. = 54). Ordinarily, one ounce of this breakfast cereal is taken with 8 fluid ounces of milk which has an EAA index of 88. The proteins from these sources are in the approximate ratio of 1:3.5, and the EAA index for the combination is calculated to be 84 with a pre- dicted biological value of 80.
In computing the essential amino acid indexes of combinations of proteins their full individual contributions are taken into account before disregarding that proportion of the egg ratio of the combination in excess of 100%.
ESSENTIAL AMINO ACID INDEX 291 VII. SUMMARY
A system of rating dietary proteins has been described based in part on the rationale that the efficiency of utilization is a function of the product of the essential amino acids made available at the site of syn- thesis. Designated the Essential Amino Acid Index (EAA index), it is the geometric mean of the ratios of the essential amino acids in the food protein relative to their content in a highly nutritive reference protein, viz. whole egg. The basis for the choice of this "standard" and of the pertinent analytical data is discussed. Application of the regression equation
Biological value = 1.09 (EAA) - 11.7
yields close agreement between predicted and observed biological values.
The EAA index not only integrates all the essential amino acids into the calculation but permits estimation of the effect of amino acid or protein supplementation on biological values.
Certain limitations in the use of the index are discussed, particularly those cases where the utilization of amino acids is influenced by factors which affect the rate of enzymatic release of essential amino acids.
REFERENCES
Allison, J. B., and Anderson, J. A. (1945). /. Nutrition 29, 413.
Allison, J. B., Barnes, R. H., Cole, W. H., and Harte, R. A. (1950). Rutgers Univ.
Bur. Biol. Research Rept. pp. 114, 1946.
Behar, M., Viteri, F., Bressani, R., Arroyave, G., Squibb, R. L., and Scrimshaw, N. S. (1957). Ann. Ν.Ύ. Acad. Set. 69, 954.
Berg, C. P., and Rose, W. C. (1929). /. Biol. Chem. 82, 479.
Block, R. J., and Boiling, D. (1951). "The Amino Acid Composition of Proteins and Foods," 2nd ed. C. C Thomas, Springfield, Illinois.
Elman, R. (1939). Proc. Soc. Exptl. Biol Med. 40, 484.
Geiger, E. (1947). /. Nutrition 34, 97.
Henry, K. M., and Kon, S. K. (1946). /. Dairy Research 14, 330.
Kuhnau, J. (1949). Angew. Chem. 61, 357.
Kuiken, K. A., and Lyman, C M . (1948). /. Nutrition 36, 359.
McCollum, E. V. (1911). Am. J. Physiol. 29, 215.
Mason, I. D., and Palmer, L. S. (1935). /. Nutrition 9, 489.
Melnick, D., Oser, B. L., and Weiss, S. (1946). Science 103, 326.
Mitchell, H. H. (1954a). Wiss. Abhandl. deut. Akad. Landwirtsch. 2, 279.
Mitchell, H. H. (1954b). Biological value of proteins and amino acid interrelations.
Quartermaster Food & Container Inst. Surveys. National Research Council, Washington, D. C.
Mitchell, H. H., and Block, R. J. (1946). /. Biol. Chem. 163, 599.
Nehring, K., and Schwerdtfeger, E. (1951). Arch. Tieremähr. 1, 295.
Orr, M. L., and Watt, B. K. (1957). Home Econ. Research Repts. No. 4.
Oser, B. L. (1951). /. Am. Dietet. Assoc. 27, 396.
Rose, W. C. (1938). Physiol. Revs. 18, 109.
Rose, W. C , Haines, W. J., and Warner, D. T. (1954). /. Biol. Chem. 206, 421.
Sheffner, A. L., Eckfeldt, G. A., and Spector, H. (1956). /. Nutrition 60, 105.
APPENDIX
ESSENTIAL AMINO ACID INDEXES AND BIOLOGICAL VALUES OF FOOD PROTEINS
Milk 3. 1.
Item number and description0 Cow, whole, nonfat, evaporated, or dry Human
Milk products 5. 6.
7.
8. 9.
10.
11.
Buttermilk Casein
Cheese: cheddar, other ripened cheeses/
and processed cheese foods Cottage
Cream cheese Lactalbumin Whey, dried Eggs, chicken
12.
13. 14.
Meat 15. 16.
20. 17.
22.
Poultry 23. 24.
Whole, raw or dried Whites, raw or dried Yolks, raw or dried Beef cuts,e fresh or canned Lamb cuts,e fresh or canned Pork cuts: fresh pork,e raw or canned Ham and other cured pork, raw,
cooked, or canned Veal cuts, fresh or canned Chicken, muscle without skin Duck, muscle without skin Fish and shellfish
26. 27.
28. 29.
31. 32.
33. 34.
35. 36.
41. 42.
43.
Fish, raw or canned
Shellfish, shrimp, including prawns, raw or canned
Other shellfish Brains
Fish flour Gelatin
Gizzard, chicken Heart
Kidney Liver
Sausage containing liver Other sausage
Tongue, fresh or smoked
IndexEAA 0
88 87 88 88
86 86 82 89 69
(100) 95 93
84 84 83 83 81
82 82
80 67 76 85 77 25 75 86 86 89 83 77 82
Biological value Predicted0 Observed
84 83 84 84
82 77 82 85 61
92 97 89 80 78 79 77 79
78 78
76 61 71 81 73 70 16 82 82 85 78 72 77
90
72
84
93 96
76
85
25 74 77 77
ESSENTIAL AMINO ACID INDEX 293
APPENDIX (Continued)
Item number and description0 IndexEAA 0
Biological value Predicted0 Observed Legume seeds and their products
Beans, includes kidney, navy, pinto, red, others 45. Raw
46. Baked with pork, canned 47. Baked with tomato sauce, canned 48. Black gram (Phaseolus mungo) 49. Broad beans {Vicia faba) 50. Chickpeas (Cicer arietinum) 51. Cowpeas (Vigna spp.) 53. Lentils (Lens culinaris) 54. Lima beans (Phaseolus lunatus) 57. Mung beans (Phaseolus aureus) 58. Peanuts, flour, meal, peanut butter
(Arachis hypogaea) 59. Peas (Pisum sativum)
61. Soybeans and flour (Glycine max) 63. Soybean milk
Common nuts
65. Almonds (Prunus amygdalus) 66. Brazil nuts (BerthoUetia excelsa) 67. Cashews (Anacardium occidentale) 68. Coconut and other palm family nuts
and meals/
69. Filberts (Corylus spp.) 70. Pecans (Carya illinoensis)
71. Walnuts, English or Persian (Juglans regia)
Seeds and seed meals
78. Cottonseed flour and meal (Gossypium spp.)
83. Sesame seed and seed meal (Sesamum indicum)
84. Sunflower seed meal (Helianthus annuus) Grains and their products
85. Barley (Hordeum vulgäre)
86. Bread: white made with refined wheat flour and 4% nonfat dry milk, flour basis
88. Buckwheat flour (Fagopyrum esculentum) 93. Corn, cornmeal, grits (Zea mays) Corn products
94. Flakes 95. Germ
80 73 65 80 70 77 79 71 78 70 69 81 83 86 64 69 64 68 68 76 70
72
75 68 60 76 65 72 74 65 74 65 64 77 78 82 58 64 58 63 62 71 65
67
57 75
64 73 71
66
64 73 67
60 73
68 66
60
58 68 61
54 67
71 65
62
78
APPENDIX (Continued)
Item number and description« EAA Index0
63 68 66 31 75 72 73 68 70 64 61 71 74 60 55 67 65 72 79 84 64
64 56 61 82 76
54 65 82 81 62 66
Biological value Predicted0 Observed
57~~
62 60 22 70 67 68 62 65 58 54 66 69 54 48 61 59 66 74 79 58
58 49 54 77 71
47 59 78 76 56 60
65 70
67 52
75 96. Gluten
97. Hominy 100. Tortilla 101. Zein
105. Pearl millet (Pennisetum glaucum) 107. Oats, oatmeal, rolled oats (Avena sativa) 109. Rice (Oryza sativa): brown, converted,
white
112. Rye (Secale cereale), whole grain, and flours of different extractions 113. Sorghum (Sorghum vulgäre) 115. Wheat (Triticum aestivum): whole
grain and whole grain flour 117. White flour
Wheat products 118. Bran 122. Germ 123.. Gluten
124. Macaroni or spaghetti 125. Noodles (contain egg solids) 126. Shredded wheat
Vegetables: immature seeds 146. Corn (Zea mays)
Cowpeas (Vigna. spp.)
Lima beans, large and small seeded varieties (Phaseolus lunatus includ- ing var. macrocarpus)
Peas, raw or canned (Pisum sativum) Leafy vegetables
152. Brussels sprouts (Brassica oleracea var.
gemmifera)
153. Cabbage (Brassica oleracea var. capitata) 157. Kale (Brassica oleracea var. acephala) 161. Spinach (Spinacia oleracea)
162. Turnip greens (Brassica rapa) Starchy roots and tubers
165. Cassava, root and flour (Manihot esculenta)
Potatoes (SoL·num tuherosum) Sweet potatoes (Ipomoea batatas) Taro (Colocasia spp.)
Other vegetables
171. Asparagus (Asparagus officinalis) 172. Beans, snap (Phaseolus vulgaris)
147.
148.
149.
166.
167.
168.
ESSENTIAL AMINO ACID INDEX 295
APPENDIX (Continued)
Item number and description0
IndexEAA 6
39 66 73 59 57 65 54
Biological value Predicted0 Observed
31 60 52 68 59 50 47 173. Beets (Beta vulgaris)
174. Broccoli (Brassica oleracea var. botrytis) 175. Carrots (Daucus carota)
176. Cauliflower (Brassica oleracea var. botrytis) 182. Eggplant (Solanum melongena)
186. Okra (Hibiscus esculentus) 190. Pumpkin (Cucurbita pepo) 195. Tomatoes and cherry tomatoes (Lyco-
persicon esculentum and L. esculentum cerasiforme)
Miscellaneous food items 199. Yeast: Baker's 200. Yeast: Brewer's, dried
201. Yeast: Primary, dried (Saccharomyces cerevisiae)
202. Torula yeast (Torulopsis utilis)
48 41 80 83
82 88
76 79
77 85
« As listed by Orr and Watt (1957).
» Computed from data of Orr and Watt (1957), cf. Table III, column (f).
* BV = 1.09 (EAA) — 11.73. See page 288.
d Includes such kinds as Blue, Limburger, and Swiss.
e Based on data from many cuts.
/ Including coconut (Cocos nucifera), babassu (Orbignya speciosa), palm cohune (Orbignya cohune), and palm nut (Elaeis guineensis).