Abstract:Impact of macroelements in soil on NDVI parameter was analyzed in the paper. Remote sensing and laboratory soil analysis results were compared. Macroelements and NDVI parameter values are variables which relations are not linear. Statistic was used in order to define the relations more clearly. Results of soil sampling and laboratory analysis were compared with NDVI values collected by remote sensing. Main causes of variation of the NDVI parameter are the content of organic matter i.e. humus, soil acidity and content of nitrate nitrogen.
Keywords:remote sensing, soil, GIS, NDVI, analysis 1. Introduction
The daily increase in population and standard of living will lead to the need to increase food production.
In order to ensure that demands to increase growth of food production and supplies, as well as to maintain the safety of sufficient quantities of healthy food, it is necessary to find a way to achieve these goals from the same area of arable land. One way to increase production is to make more intensive use of basic agricultural resources, such as land. Deforestation, drainage of ponds and wetlands can increase the area of arable land. However, this would not fully meet the increasing needs. Another way would be to increase the use of other agricultural inputs, such as labor, mechanization, fertilizers, pesticides and water. Changes in the technology that farmers use to transform inputs into edible products are also possible. Each of these responses to demand growth is, in fact, a feature of the progress of agriculture in different parts of the world over the last century.
2. Literature
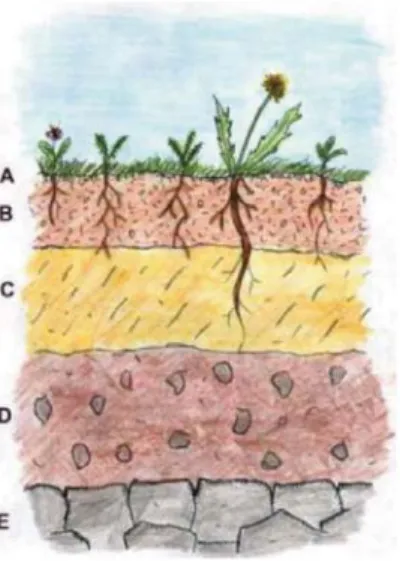
The earth is to disperse the surface layer of the lithosphere. It is located above a solid rock mass and its upper limit is its biosphere, hydrosphere and atmosphere. Physically speaking, land is a multiphase system. It consists of particles (grains) and pores (cavities) (Fig. 1.). Soil is created by a process called pedogenesis, and it takes two stages. The first phase begins with the decomposition of the rocks and the second with the decomposition of dead remains of plant and animal origin. Soil types include: dust, clay, sand, gravel, but also their combinations (Miller, 1953).
Soil as a substrate for plant cultivation is the largest chemical industry in the world. Proper growth and development of plants requires equal balance of nutrients found in the soil. According to the physiological role, the nutrients are divided into macro (essential) and microelements. Macros can be divided into primary and secondary macros. Primary macronutrients are those without which plants cannot grow or develop.
Without them, the plants cannot complete the vegetative and reproductive phase of their life cycle, which is why they are present in larger quantities in the plants. The most significant of these are nitrogen (N), phosphorus (P) and potassium (K). Secondary macroelements by role are the same as primary macroelements,
DOI: 10.17676/HAE.2020.37.14
NDVI REMOTE DETECTION AND LABORATORY SOIL TEST RESULTS PRESENTATION IN GIS ENVIRONMENT
Author(s):
S. Negovanović, A. Belingar and G. Topisirović Affiliation:
University of Belgrade, Faculty of Agriculture, Institute of Agricultural Engineering Nemanjina 6, 11080 Belgrade-Zemun, Serbia
Email address:
stefannegovanovicbg@gmail.com
SZENT ISTVÁN UNIVERSITY Faculty of Mechanical Engineering Received: 10.11.2019 - Accepted: 10.02.2020
but plants need those in smaller quantities. These include sulfur (S), magnesium (Mg) and calcium (Ca).
Certain secondary elements are dominant in determining the yield of a given culture (Licina, 2009).
Geographic Information System is a system for managing spatial data and associated properties. This system is a computer system capable of integrating, editing, storing, analyzing and displaying geographically defined information. GIS can be considered as a tool for creating a "smart" map that allows users to set up interactive queries, analyze spatial information and edit data. (Magó-Cvetanovski 2019a) GIS technology is nowadays widely used in various fields and can primarily be used for scientific research, development planning, spatial planning, cartography (Bolstad, 2005) (Magó 2009). The use of a geographical information system in the fields of agricultural production is very important. Today the integration of this system with conventional agriculture enables the development of a completely new direction in agriculture called precision agriculture.
(Magó-Cvetanovski 2019b) Precision agriculture is not a term that has emerged in the last 20 years; This is supported by the fact that the basic principles of modern precision agriculture were used around 400 years ago, when colonizers of the Americas noticed that local tribes applied different practices in individual places on the plot (Negovanovic, 2018). Further development of this technology has made it possible to gain an understanding of the spatial variability that characterizes most agricultural arable land. Based on this knowledge, there is a need to manage these variability. In addition to GIS, there has been an increasing presence of global positioning systems (GPS) and remote sensing technologies (RS). Remote detection or teledetection is a modern method of gathering information through systems that are not in direct physical contact with the investigated phenomenon or object (Campbell, 2002).
HUNGARIAN AGRICULTURAL ENGINEERING N° 37/2020 NDVI REMOTE DETECTION AND LABORATORY
SOIL TEST RESULTS PRESENTATION IN GIS ENVIRONMENT
Figure 1. General land profile
Figure 2. Remote sensing principle
The principle of remote sensing (Fig. 2.) comes down to the systematic measurement of a certain part of the electromagnetic spectrum and the interpretation of the anomalies found by differences in the properties of the object under study. Remote sensing relies on the wavelengths of reflected light and does not come in direct contact with the object being observed.
The Normalized Difference Vegetation Index (NDVI) is a simple graphical indicator that can be used to analyze measurements obtained by remote detection. The aim of such analyzes is to estimate the amount of green space on the total observed area (Fig. 3). The values of this index vary in the range from -1 to +1. Values approaching the negative extreme indicate the fields where water is on the surface of the earth, and the opposite is the positive extreme indicating the parts with intensive green vegetation.
3. Material and methods
The basic indicators of soil fertility are: total nitrogen, readily available phosphorus and potassium, humus and calcium carbonate content, pH in water and potassium chloride, all of which are determined on the basis of soil analyzes. These fertility indicators are changing during the period of land exploitation in the agricultural production process. Therefore, monitoring them is of great importance for proper land management. Fertility checks must be carried out every four years.
In this fertility control process, the first and very important step is certainly the soil sampling process (Fig.
4.). The soil sampling process consists of several stages: determination of sampling time, preparation for sampling, sampling, preparation and packaging of the soil sample. The best time to sample the soil is after the crop is harvested.
Figure 3. Thematic map of the NDVI parameter values
Figure 4. Soil sampling
There are several land sampling systems: diagonal, chess, circle method, combined method, control plots.
All of the above systems should aim to have the best coverage of the sampled soil with individual stitches in order to better represent the given plot. The above mentioned sampling systems are in practice the most commonly used systems so far. However, being limited with the approved number of soil samples for laboratory analysis, we have used an adapted sampling method. Namely, through the Internet platform we created thematic maps with values of the NDVI parameter, and in accordance with individual stress and healthy zones, we determined the points from which we took soil samples (Fig. 5.).
Stress areas are parts of the plot where the value of the NDVI parameter is quite low, which practically means that vegetation in that part of the plot is extremely poor, which further leads to lower yields. On the contrary, there are portions of the plot where healthy and intensive green vegetation is represented, and these portions are destined to carry higher yields than in the case described previously. Once the points bearing the coordinates are marked, it was necessary to find those locations using a GPS unit on the plot (Fig. 6.).
Chemical, biological and micro-biological methods were used to determine soil fertility in order to apply fertilizers for proper plant nutrition. Chemical methods are based on the effect of certain chemical reagents on the soil sample by which the elements are converted into a solution from which the concentration of the test nutrient for plants is determined by a suitable analytical procedure. Before the chemical analysis of the soil, it is necessary to prepare properly the sample, and this procedure involves several work operations (Fig.
7.). It is necessary to dry the sample, then to grind it and remove any impurities from it.
Figure 5. Determining the location for soil sampling
Figure 6. Exact location of the measuring point using the GPS unit
HUNGARIAN AGRICULTURAL ENGINEERING N° 37/2020 NDVI REMOTE DETECTION AND LABORATORY
SOIL TEST RESULTS PRESENTATION IN GIS ENVIRONMENT
After drying, it is necessary to inspect the sample once more and remove any residual impurities, and then grind it manually or with special electric mill. Both methods are efficient with the capacity of the electric mill being far greater.
4. Results and discussion
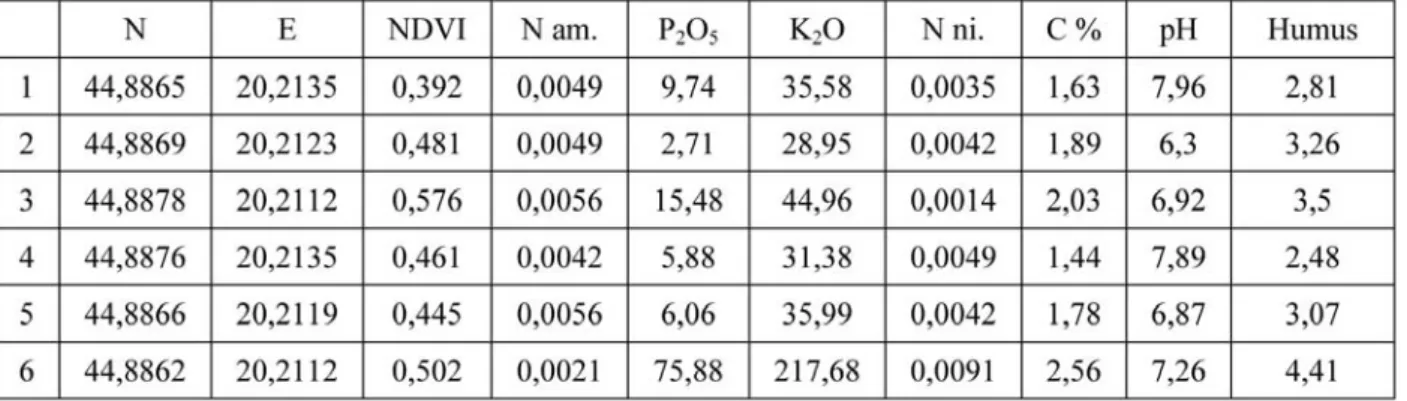
The values obtained show that there are certain variations of this index within one plot. The aim of this paper is to determine the reasons for these variations through soil testing. At the time of taking this data, vegetation on these areas was not in its full stage of development, so it is understandable why the values of this index are not within maximum limits.
Based on the statistical data processing, the strongest relation between the observed variables is observed for humus. Namely the content of organic matter causes variation of NDVI parameter on Plot 1. Below are presented results on other plots.
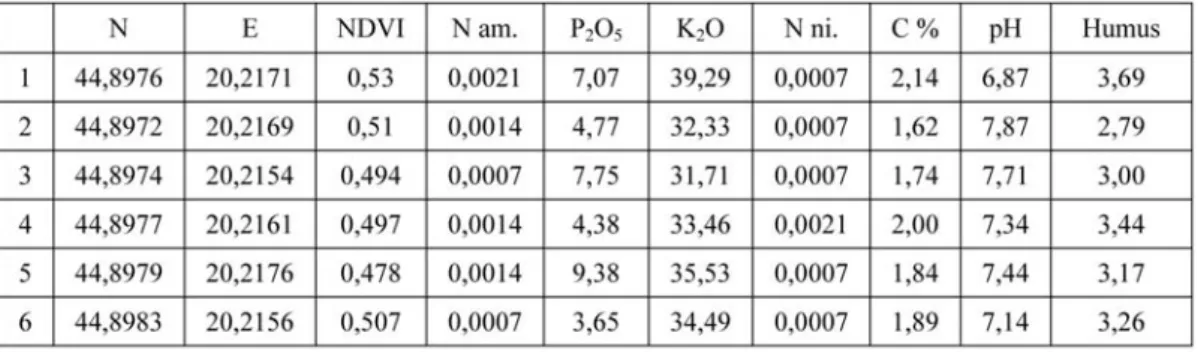
According to the data obtained from Plot 2, significant relation was found between soil acidity and NDVI parameter value. In addition to the acidity, the nitric nitrogen content affected variations of NDVI parameter. Other parameters have the same bond strengths and in this case are not interesting for further consideration.
In Plot 3 analysis, the strength of the dependency between nitrate nitrogen and the NDVI parameter is extremely weak, which is opposite to that found at the previous plot. Other parameters have similar significances of influence to the variations of the observed NDVI parameter.
Figure 7. Drying of samples
Table 1. Comparative presentation of the NDVI parameter value and the results of chemical analysis of soil - Plot 1
Table 2. Correlation analysis of observed phenomena - Plot 1
Table 4. Correlation analysis of observed phenomena - Plot 2
Table 5.Comparative presentation of the NDVI parameter value and the results of chemical analysis of soil - Plot 3
Table 3. Comparative presentation of the NDVI parameter value and the results of chemical analysis of soil - Plot 2
HUNGARIAN AGRICULTURAL ENGINEERING N° 37/2020 NDVI REMOTE DETECTION AND LABORATORY
SOIL TEST RESULTS PRESENTATION IN GIS ENVIRONMENT
Conclusions
Data science has a strong influence on the way we consider the data obtained through remote detection, and the large amount of data obtained through this must somehow be correlated with respect to all mathematical and statistical regularities. By sampling and chemical analysis of the soil we obtain all the information that we cannot obtain by remote sensing. By remote sensing we get images that visualize data on the consequences of soil quality, while by chemical analysis we try to find the cause of certain consequences. By combining the two methods, we can come to closer conclusions more clearly, faster and more accurately. The general conclusion is that in all three plots observed, the main causes of variation of the NDVI parameter are the content of organic matter (humus), soil acidity and nitrate nitrogen content.
References
[1] Aleksandar R. Djordjevic, Svetlana B. Radmanović.(2016): Pedology, Faculty of Agriculture Zemun, Belgrade.
[2] Bolstad, P.(2005): GIS Fundamentals: A first text on Geographic Information Systems, Second Edition, White Bear Lake.
[3] Buol S. W., Hole F. D., McCracken R. J.(1973): Soil Genesis and Classification, lowa State University Press, USA, Ames.
[4] Campbell, J. B. (2002): Introduction to remote sensing (3rd edition), New York.
[5] Jovanovic, V., Djurdjev, B., Srdic, Z., Stankov U. (2012): Geographic Information Systems, Faculty of Science, Novi Sad, Belgrade.
[6] Kablar, N., Kvrgic, V.(2012): Geographic Information Systems Review and Examples, Lola Institute and Faculty of Computer Science, Belgrade.
[7] Licina, V. (2009): Agrochemistry, Faculty of Agriculture, Zemun, Belgrade.
[8] Magó L.: (2009) „Reduction of Mechanisation Costs by the Application of GPS in Arable Crop Production”, Agricultural Engineering Scientific Journal, Belgrade-Zemun, Serbia, 2009. Vol. 34. No 2., p.
91-95.
[9] Magó L., Cvetanovski A.:(2019a) „Smart Attached Working Equipment in Precision Agriculture”, Hungarian Agricultural Engineering, Vol. 35/2019. p. 5-12., DOI: 10.17676/HAE.2019.35.5
[10] Magó L., Cvetanovski A.: (2019b) „Smart Machines for Precision and Efficient Fertilizing and Spreading”, ISAE 2019 - Proceedings of the 4th International Symposium on Agricultural Engineering, 31st October -2nd November 2019, Belgrade–Zemun, Serbia, p. I-51. – I-58.
[11] Miller, Austin. (1953): The Skin of the Earth, Methuen, London.
[12] Negovanovic, S. (2018): Analysis of the effect of soil compaction on NDVI values using remote sensing methods and quantum GIS, Graduate thesis, Faculty of Agriculture, Zemun, Belgrade.
[13] Predic, T. (2011): Practicum Agrochemistry and Plant Nutrition, Faculty of Agriculture, Banja Luka, Banja Luka.
Table 6. Correlation analysis of observed phenomena - Plot 3