E COCYCLES Scientific journal of the
ISSN 2416-2140
European Ecocycles Society
Ecocycles, Vol. 4, No. 1, pp. 83-87 (2018) DOI: 10.19040/ecocycles.v4i1.124
CASE STUDY
Normalized difference vegetation index (NDVI) as a tool for the evaluation of agricultural drought
Veronika Zuzulova
1and Jaroslav Vido
2Slovak University of Agriculture in Nitra, Slovakia; Technical University in Zvolen, Slovakia Email addresses: veronika.zuzulova@uniag.sk and vido@tuzvo.sk
Abstract – The paper deals with the evaluation of agricultural drought in Slovakia by remote sensing data. For this purpose, monthly normalized difference vegetation index (NDVI) values were derived from MODIS spectroradiometer at district level during the time period of 2000 to 2014. Verification was based on correlations with the Palmer drought severity index (PDSI) for twelve sites selected according to limited climatic parameters. Correlations showed a strong relationship (α ≤ 0.1) between NDVI and PDSI values, mainly in the middle of the growing season (June to September). The aim of the paper is testing NDVI as a suitable tool for drought assessment in an agricultural land in Slovakia.
Keywords – remote sensing, agricultural drought, NDVI, PDSI Received: October 31, 2018 Accepted: February 4, 2018
Introduction
Climate change has a serious impact on the agriculture as well as on other economic sectors (e.g. forestry, energetics, agri-tourism, economy). Agro-climatic ana- lyses showed that the weather is one of the limiting factors in agricultural production and its effect could be stronger in the future.
Changes in atmospheric composition affect global air temperature, spatial and temporal distribution of precipitation, evaporation, runoff, snow cover and soil moisture. Variation of meteorological elements results in an increasing frequency of ecological disturbance, for instance, drought, severe thunderstorm, forest fires, insect and disease outbreaks. The disturbances can have a negative impact on the human food supply (Backlund et al., 2008).
Technological development has enabled to invent methods of assessment the Earth's surface features. One such method is also remote sensing.
Vegetation indices are used as a tool to evaluate vegetation cover through remote sensing. Normalized difference vegetation index (NDVI) was introduced in 1973 (Rouse et al., 1973). It has become the most widely used vegetation index, which confirms the number of
scientific works from different areas using this vegetation cover assessment method.
NDVI values range from 1 to -1. Values lower than 0.1 correspond to rocky surfaces, sands, snow cover and barren soils. Sparse vegetation (e.g. shrubs, meadows and pastures) are expressed by values of 0.2 – 0.5. High values (from 0.6 to 0.9) correspond to areas with dense vegetation such as forest or agricultural vegetation in the productive phase (U. S. Geological Survey, 2015).
The use of data from satellite imagery in various areas (e.g. meteorology, agriculture, forestry, and water management) is nowadays current.
The aim of the paper was to find out the possibility of using the normalized differenced vegetation index derived from MOD13Q1 (MODIS) in the assessment of drought in the agricultural land of Slovakia.
Materials and Methods
1. Data processing for assessment of vegetation vigor The assessment of vegetation vigor was realized by NDVI:
84
where
NIR – the reflectance in near-infrared band and R – the reflectance in the red band.
Remote sensing images were made by a Moderate Resolution Imaging Spectroradiometer (MODIS), one of five complementary scientific instruments, which Terra satellite has (NASA, 2018a). MODIS is an instrument, which provides multispectral observations of land, atmosphere features, and oceans at a spatial resolution ranging from 250 m to 1000 m. Approximately forty data products are produced from the MODIS data, including vegetation indices (NASA, 2018b). In this study, NDVI was derived from MOD13Q1. The spatial resolution of images was 250 m and the temporal resolution was 16 days. NDVI was generated for 12 districts across Slovakia during the time period of 2000 to 2014.
Work with imagery included the following steps:
a. Conversion of MODIS Land products in hdf format to output files in format tif by MODIS Reprojection Tool (MRT) (LP DAAC, U. S. Geological Survey, EROS, 2011). Then the output files were suitable for work in ArcGIS.
b. Multiply by the scale factor, which is 0.0001 for NDVI (LP DAAC, NASA, U.S. Geological Survey, 2016).
Fig. 1: Image with NDVI values multiply by scale factor 0.0001
c. Reduction of NDVI values without vegetation cover (< 0.3), e.g. water, bare rocks, snow cover.
d. Application of layer with arable land in Slovakia.
e. Calculation of monthly NDVI values by averaging two temporally adjacent 16-day NDVI values and averaging monthly NDVI values in each district during selected time series.
Fig. 2: Image with NDVI values for vegetation cover
Fig. 3: NDVI of vegetation cover on arable land in Slovakia
Fig. 4: NDVI of vegetation cover on arable land in each district in Slovakia
2. Drought assessment by PDSI
Palmer drought severity index was used as a source for validation of NDVI as a method suitable for drought assessment. PDSI was chosen from other drought indices commonly used in Slovakia, due to its widespread usage.
The index was developed in the second half of the 1960s by W. C. Palmer (Palmer, 1965). It is standardized for different regions with different climatic conditions (Dunkel, 2009) and involves climatic and pedological data. Software for calculations was created by Tom Heddinghaus from the University of Nebraska-Lincoln.
Input data include rainfall and average air temperature per month and average air temperature per whole period.
These data were provided by the Slovak hydrometeoro- logical institute in Bratislava. Latitude and available water capacity were provided by Soil science and
85
conservation research institute. Palmer divided PDSI values into 11 categories: extremely wet (≥ 4), very wet (3 to 3.99), moderately wet (2 to 2.99), slightly wet (1 to 1.99), incipient wet spell (0.5 to 0.99), near normal (0.49 to -0.49), incipient drought (-0.5 to -0.99), mild drought (-1 to -1.99), moderate drought (-2 to -2.99), severe drought (-3 to -3.99) and extreme drought (≤ -4). As dry seasons were identified those with values ≤ -1 and at least one month during the season was classified as moderately dry. (Žalud et al., 2006).
Twelve sites were chosen to compare and verify NDVI values: Bratislava, Piešťany, Hurbanovo, Čadca, Sliač, Boľkovce, Rimavská Sobota, Telgárt, Poprad, Košice, Milhostov and Kaminica nad Cirochou. These were selected based on limited climatic parameters. PDSI was calculated for the same time series as NDVI.
3. Assessment of relationships between NDVI and PDSI
Correlations between monthly NDVI values and monthly PDSI values in twelve selected districts during 2000- 2014 were calculated in the Statgraphics and Microsoft Excel (144 correlations were displayed by charts and evaluated). Pearson's correlation coefficient (r) was calculated for quantification of relationships. Karl Pearson designed it in 1896. It is used to find how strong a relationship is between two quantitative variables, calculated by the formula:
Numerator expresses how the values of two variables
change simultaneously. A positive value indicates that variables change in one direction, and a negative value indicates that variables change in the opposite direction.
If the numerator is 0, values change independently from each other. The result of Pearson's correlation coefficient ranges between -1 and 1. The correlation coefficient of - 1 means, that all data lie on decreasing line and value of 1, that all data lie on an increasing line. We cannot make conclusions only according to the value of the coefficient. It is necessary to examine the X-Y chart, due to the influence of extreme values. The strong nonlinear relationship can be also found between two variables from the chart (Rimarčík, M., 2014).
The coefficient of determination (r2) was calculated after creating the charts. This coefficient is a measure of how well the regression model describes the observed data.
P-values (level of significance) were also calculated, which indicates the probability that the dependence between variables is random.
Results and Discussion
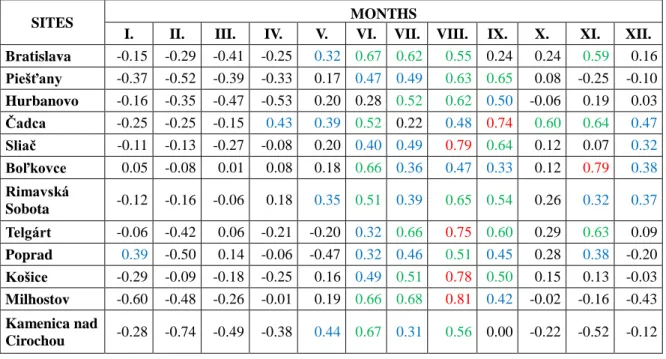
The relationship between vegetation vigor (NDVI) and drought (PDSI) was determined from average monthly values of both indices on each of twelve districts (sites) during the period 2000-2014. The values of Pearson's correlation coefficient are shown in table 1. The strength of correlation was highlighted by a color scale. We used blue color to highlight low correlated variables (0.3 ≤ r <
0.5), green to highlight moderately correlated variables (0.5 ≤ r < 0.7) and red to highlight highly correlated variables (0.7 ≤ r < 0.9). Very highly correlated variables
Table 1. Pearson's correlation coefficient between NDVI and PDSI during the time series 2000 – 2014.
SITES MONTHS
I. II. III. IV. V. VI. VII. VIII. IX. X. XI. XII.
Bratislava -0.15 -0.29 -0.41 -0.25 0.32 0.67 0.62 0.55 0.24 0.24 0.59 0.16 Piešťany -0.37 -0.52 -0.39 -0.33 0.17 0.47 0.49 0.63 0.65 0.08 -0.25 -0.10 Hurbanovo -0.16 -0.35 -0.47 -0.53 0.20 0.28 0.52 0.62 0.50 -0.06 0.19 0.03 Čadca -0.25 -0.25 -0.15 0.43 0.39 0.52 0.22 0.48 0.74 0.60 0.64 0.47 Sliač -0.11 -0.13 -0.27 -0.08 0.20 0.40 0.49 0.79 0.64 0.12 0.07 0.32 Boľkovce 0.05 -0.08 0.01 0.08 0.18 0.66 0.36 0.47 0.33 0.12 0.79 0.38 Rimavská
Sobota -0.12 -0.16 -0.06 0.18 0.35 0.51 0.39 0.65 0.54 0.26 0.32 0.37 Telgárt -0.06 -0.42 0.06 -0.21 -0.20 0.32 0.66 0.75 0.60 0.29 0.63 0.09 Poprad 0.39 -0.50 0.14 -0.06 -0.47 0.32 0.46 0.51 0.45 0.28 0.38 -0.20 Košice -0.29 -0.09 -0.18 -0.25 0.16 0.49 0.51 0.78 0.50 0.15 0.13 -0.03 Milhostov -0.60 -0.48 -0.26 -0.01 0.19 0.66 0.68 0.81 0.42 -0.02 -0.16 -0.43 Kamenica nad
Cirochou -0.28 -0.74 -0.49 -0.38 0.44 0.67 0.31 0.56 0.00 -0.22 -0.52 -0.12
86
(0.9 ≤ r) were not observed. Vegetation vigor depended on drought mainly in June, July, August, and September with a percentage of correlations from low to high 92%, 92%, 100%, and 83%. Negative linear trends were observed in January, February, March, April, May, October, November, and December (Figures 6–17 in the Supplementary Data file). Negative correlations mean that with rising PDSI values, NDVI values decreased.
The causes could be plants growth stage or lack of data because of snow cover on arable land during winter months. But as we can see, winter crops were grown in some districts. Ji and Peters (2003) assessed vegetation response to drought by correlations between NDVI and SPI (McKee et al., 1993) during the growing season months from May to October. They found out that stronger relationship is in the middle of the growing season (June – September) than at the beginning (April and May) and end (October). Seasonality has a significant effect on the relationship between NDVI and other drought indices.
Coefficient of determination (r2) indicates how a change of PDSI affects a change of NDVI. In table 2 high level of explained variability (0.5 < r2 < 0.8) was highlighted with red color and moderate level (0.25 < r2 < 0.5) with green color. Values of both levels represented 50% of the sites in June, 42% of the sites in July, 83% of the sites in August and 50% of the sites in September. Some significant values in winter months could mark winter crops on arable land in the districts.
The next step was the calculation of p-values to found out statistical significance of correlations. Only the main growing season of crops was evaluated. It means a season, which is limited by the temperature ≥10 °C. It
contained months from April to October. We tested five levels of significance: α ≤ 0.01; α ≤ 0.05; α ≤ 0.1; α ≤ 0.15, and α ≤ 0.2 (Fig. 5). There was no 100% share of significant p-values of all selected sites in any month at levels of significance α ≤ 0.01 and α ≤ 0.05. Statistical significance of correlations on all sites was observed in August at α ≤ 0.1. Significant correlations contained 8%
of the sites in April and May, 67% of the sites in June, July, and September and 8% of the sites in October. The decrease in significance level to α ≤ 0.15 or α ≤ 0.2 is not necessary, because it would cause only small changes.
The share of the sites with significant p-values would be still the same in August and October.
Fig. 5: Statistical significance of correlations between NDVI and PDSI
Conclusions
The results of the research showed that the strongest correlations between NDVI and PDSI were observed
Table 2. Coefficient of determination between NDVI and PDSI during the time series 2000 – 2014.
SITES MONTHS
I. II. III. IV. V. VI. VII. VIII. IX. X. XI. XII.
Bratislava 0.05 0.09 0.16 0.06 0.10 0.45 0.39 0.30 0.06 0.06 0.35 0.03 Piešťany 0.14 0.27 0.15 0.11 0.03 0.22 0.24 0.40 0.42 0.01 0.06 0.01 Hurbanovo 0.03 0.12 0.22 0.28 0.04 0.08 0.27 0.38 0.25 0.00 0.04 0.00 Čadca 0.06 0.06 0.02 0.18 0.15 0.27 0.05 0.23 0.54 0.36 0.41 0.22 Sliač 0.01 0.02 0.08 0.01 0.04 0.16 0.24 0.63 0.40 0.02 0.00 0.10 Boľkovce 0.00 0.01 0.00 0.01 0.03 0.44 0.13 0.22 0.11 0.01 0.63 0.14 Rimavská
Sobota 0.01 0.03 0.00 0.03 0.12 0.26 0.15 0.42 0.29 0.07 0.11 0.14 Telgárt 0.00 0.18 0.00 0.04 0.04 0.10 0.44 0.57 0.36 0.08 0.40 0.01 Poprad 0.15 0.25 0.02 0.00 0.22 0.10 0.21 0.26 0.20 0.08 0.15 0.04 Košice 0.09 0.01 0.03 0.06 0.03 0.24 0.26 0.61 0.25 0.02 0.02 0.00 Milhostov 0.36 0.23 0.07 0.00 0.04 0.44 0.46 0.65 0.18 0.00 0.03 0.18 Kamenica nad
Cirochou 0.08 0.55 0.24 0.15 0.19 0.45 0.10 0.31 0.00 0.05 0.27 0.01
87
from June to September. Smaller impact of drought to vegetation vigor on arable land in Slovakia were noted at the beginning (April, May) and end (October) of the growing season. Reactions of vegetation were different between months. It was caused by growth stage of crops.
Linear trends in months with strong correlations were increasing. So with increasing PDSI (more wet months) values of NDVI increased (better vegetation condition).
Contrariwise more seasons of drought results in less healthy or sparse vegetation cover. We can conclude that NDVI could be a suitable method for the evaluation of agricultural drought in Slovakia.
Open access statement
This article has been published under a Creative Commons Attribution 4.0 international license that provides immediate open access to its content on the principle that making research freely available to the public supports a greater global exchange of knowledge.
Public interest statement
The paper deals with the evaluation of agricultural drought in Slovakia by remote sensing data. For this purpose, monthly normalized difference vegetation index values were derived from MODIS spectroradiometer at district level during the time period of 2000 to 2014.
Verification was based on correlations with the Palmer drought severity index for twelve sites selected according to limited climatic parameters. Correlations showed a strong relationship between the two index values, mainly in the middle of the growing season.
Acknowledgment
This work was supported by the Slovak Grant Agency for Science (VEGA) Grant No. 1/0767/17 Response of ecosystem services of the grape growing country to climate change regional impact – change of function to adaptation potential.
References
Backlund, P., Janetos, A., Schimel, D. S., Hatfield, J., Ryan, M., Archer, S., Lettenmaier, D., 2008. Executive summary. In Backlund, P., Janetos, A., Schimel, D. The effects of climate change on agriculture, land resources, water resources, and biodiversity in the United States.
Washington D. C. pp. 1-10. Available online:
https://www.fs.fed.us/rm/pubs_other/rmrs_2008_backlun d_p003.pdf
Dunkel, Z., 2009. Brief surveying and discussing of drought indices used in agricultural meteorology. In Idojaras: Quarterly Journal of the Hungarian Meteoro- logical Service, 113, (1-2), pp. 23-37.
Ji, L., Peters, A. J., 2003. Assessing vegetation response to drought in the northern Great Plains using vegetation and drought indices. In Remote Sensing of Environment, 87 (1), pp. 85-98. ISSN 0034-4257.
DOI: 10.1016/S0034-4257(03)00174-3
LP DAAC, NASA, U. S. Geological Survey, 2016.
MOD13Q1: MODIS/Terra Vegetation Indices 16-Day L3 Global 250m Grid SIN V006. Available online:
https://lpdaac.usgs.gov/dataset_discovery/modis/modis_
products_table/mod13q1_v0 06
LP DAAC, U. S. Geological Survey, EROS, 2011.
MODIS Reprojection Tool, User´s manual, Release 4.1.
Available online:
https://lpdaac.usgs.gov/sites/default/files/public/mrt41_u sermanual_032811.pdf
McKee, T. B., Doesken, N. J., Kleist, J., 1993. The rela- tionship of drought frequency and duration to time scales. In Eighth Conference on Applied Climatology, 17 –22. January 1993, Anaheim, California, pp. 179-184.
NASA, 2018a. Terra. Available online:
https://eospso.gsfc.nasa.gov/sites/default/files/mission_h andbooks/Terra.pdf
NASA, 2018b. Aqua. Available online:
https://eospso.gsfc.nasa.gov/sites/default/files/mission_h andbooks/Aqua.pdf
Palmer, W. C., 1965. Meteorologic Drought: Research Paper no. 45. Washington, D.C.: U.S. Weather Bureau, 58 p.
Rimarčík, M., 2014. Two dimensional inductive statistics - interval variables (in Slovak). Available online:
http://rimarcik.com/navigator/interval2.html
Rouse, J. W., Jr., Haas, R. H., Deering, D. W., Schell, J.
A., 1973. Monitoring the vernal advancement and retro- gradation (green wave effect) of natural vegetation:
Progress Report RSC 1978-2. Available online:
http://ntrs.nasa.gov/archive/nasa/casi.ntrs.nasa.gov/1974 0004927.pdf
U. S. Geological Survey, 2015. NDVI, the Foundation for Remote Sensing Phenology. Available online:
http://phenology.cr.usgs.gov/ndvi_foundation.php Žalud, Z., Trnka, M., Kapler, P., Semerádová, D., Dub- rovský, M., 2006. Drought - a problem for the present and for the future. In Kvasný prumysl, 52, (7-8), pp.
203-234. Available online:
http://kvasnyprumysl.cz/pdfs/kpr/2006/07/04.pdf